Complete Technical Paper Content — Ai Behavioral Biometrics
1. Executive Abstract, Problem Formulation & Background
🚶♂️ Acceleration-based User Authentication System Behavioral Biometric Authentication using Gait Analysis 📖 Project Overview This project implements a behavioral biometric authentication system that identifies and verifies users based on their unique walking patterns (gait). Unlike traditional authentication methods (passwords, fingerprints), this system uses continuous sensor data from smartphone accelerometers and gyroscopes to authenticate users passively during normal walking. 🎯 Achievement: Successfully reduced Equal Error Rate (EER) to 3.43% with 92.68% accuracy using multi-sensor fusion and optimized feature selection. 🎯 Key Objectives 🔐 User Authentication: Classify 10 different users with high accuracy 📅 Cross-Day Robustness: Ensure models trained on one day work effectively on different days 🌍 Real-World Feasibility: Handle varying conditions, walking speeds, and temporal variations ⚡ Optimization: Achieve minimal Equal Error Rate (EER) through systematic optimization 🌟 Key Features ✅ Multi-Sensor Fusion: Combines accelerometer and gyroscope data ✅ Rich Feature Extraction: 112 time and frequency domain features ✅ Deep Learning Classification: Multi-Layer Perceptron (MLP) with optimized architecture ✅ Gait-Specific Analysis: Filters walking segments from non-walking activities ✅ Cross-Day Validation: Rigorous testing across different days ✅ Systematic Optimization: Feature selection, architecture tuning, and data augmentation 📊 Dataset Information 📥 Data Collection 👥 Users: 10 participants 📆 Days: 2 collection sessions per user 📱 Sensors: 6-axis IMU (3-axis accelerometer + 3-axis gyroscope) 📲 Device: Smartphone (waist-mounted) ⚙️ Sampling Rate: Variable (resampled to 30 Hz) 🚶 Activity: Natural walking patterns 📈 Data Statistics 📄 Total Files: 20 CSV files (10 users × 2 days) 📊 Segments per User/Day: ~71 segments (5-second windows) 🎯 Total Training Samples: ~1,420 segments 🔢 Features per Segment: 112 (combined variant) 📂 Project Structure project_root/ ├── 📁 data_raw/ # Raw CSV sensor data (10 Users × 2 Days) │ ├── U1NW_FD.csv # User 1, Full Day │ ├── U1NW_MD.csv # User 1, Morning Data │ └── ... ├── 📁 data_segmented/ # Segmented .mat files (5s windows, 0% overlap) │ └── User{X}_Day{Y}_segments.mat ├── 📁 data_segmented_50overlap/ # Segmented .mat files (5s windows, 50% overlap) ├── 📁 features/ # Extracted features organized by sensor type │ ├── accel/ # Accelerometer features only (45 features) │ ├── gyro/ # Gyroscope features only (45 features) │ └── combined/ # Multi-modal features (112 features) ├── 📁 templates/ # Pre-processed, balanced datasets for training │ ├── accel/AllTemplates_accel.mat │ ├── gyro/AllTemplates_gyro.mat │ └── combined/ │ ├── AllTemplates_combined.mat │ └── AllTemplates_combined_gait.mat # Gait-filtered data ├── 📁 models/ # Trained Neural Network models │ └── combined/baseline_mlp.mat ├── 📁 results/ # Evaluation metrics and analysis │ ├── combined/ # Scenario-wise metrics (CSV) │ ├── optimization/ # Optimization experiment results │ ├── plots/ # Generated visualizations (PNG) │ └── variants_comparison.csv # Cross-variant performance ├── 📁 scripts/ # MATLAB Source Code │ ├── Script1_FeatureExtraction.m # Stage 1-4: Preprocessing & Features │ ├── Script2_TemplateGeneration.m # Stage 5: Template Generation │ ├── Script3_ClassificationEvaluation.m # Stage 6-9: Training & Evaluation │ └── Plots.m # Visualization generation └── 📄 PROJECT_STRUCTURE.md # Detailed structure documentation 🚀 Getting Started Prerequisites MATLAB (R2021a or later recommended) Deep Learning Toolbox (for patternnet , train ) Signal Processing Toolbox (for pwelch , bandpower ) Statistics and Machine Learning Toolbox (for cvpartition , fitcecoc ) ⚙️ Execution Workflow Run the scripts in the following order to reproduce the full pipeline: 1️⃣ Feature Extraction Script: scripts/Script1_FeatureExtraction.m Input: data_raw/*.csv Process: Loads raw sensor data. Resamples signals to a fixed 30 Hz . Segments data into 5-second windows (150 samples). Extracts Time-Domain Features (Mean, Std, RMS, Skewness, Kurtosis, etc.). Extracts Frequency-Domain Features (Bandpower, Energy, Spectral Entropy, etc.). Output: data_segmented/ , features/ 2️⃣ Template Generation Script: scripts/Script2_TemplateGeneration.m Input: features/ Process: Aggregates features from all users. Performs Gait Filtering (removes non-walking segments based on spectral energy). Checks for class imbalance and applies downsampling if necessary. Generates unified datasets for Accel, Gyro, and Combined variants. Output: templates/ 3️⃣ Classification & Evaluation Script: scripts/Script3_ClassificationEvaluation.m Input: templates/ Process: Training: Trains a Multi-Class MLP (Feed-Forward Network). Evaluation: Calculates FAR, FRR, EER, and Accuracy for 3 scenarios. Optimization: Experiments with feature selection (Fisher Score), network architecture, and split ratios. Comparison: Compares Accel-only vs. Gyro-only vs. Combined performance. Output: models/ , results/ 🧠 Methodology 1. Preprocessing Resampling: Linear interpolation to 30 Hz to handle irregular sensor sampling. Segmentation: Fixed-width sliding windows (5 seconds). Overlap: Supports 0% (baseline) and 50% (optimized) overlap. 2. Feature Engineering The system extracts 70+ features per segment to capture unique gait characteristics: Domain Features Extracted Time Domain Mean, Std Dev, Min, Max, RMS, Variance, Range, 75th Percentile, Skewness, Kurtosis, IQR, Vector Magnitude stats. Frequency Domain Bandpower (0.5-3Hz), Total Energy, Dominant Frequency, Spectral Centroid, Spectral Entropy, High-band Power (3-10Hz), Dominant Amplitude. 3. Machine Learning Model Classifier: Pattern Recognition Network ( patternnet ) Architecture: Multi-Layer Perceptron (MLP) Input Layer: ~112 features (Combined variant) Hidden Layers: [128, 64] neurons (Baseline) Output Layer: 10 neurons (Softmax for 10 users) Training Algo: Scaled Conjugate Gradient ( trainscg ) 🔬 Experimental Results & Analysis 1. Variant Comparison (Cross-Day Scenario) The system was tested on the challenging Cross-Day scenario (Train on Day 1, Test on Day 2) to evaluate real-world robustness. Variant EER (%) Accuracy (%) FAR FRR Combined (Accel+Gyro) 4.45% 88.45% 0.0136 0.1204 Accelerometer Only 8.85% 79.72% 0.0227 0.2030 Gyroscope Only 19.49% 60.85% 0.0442 0.3961 Observation: The Combined variant significantly outperforms single-sensor approaches, reducing the Equal Error Rate (EER) by nearly half compared to Accelerometer-only. 2. Optimization Experiments Several optimization levers were tested to improve performance beyond the baseline. Feature Selection (Rank-Average Fisher Score) Reducing the feature set to the most discriminative features improved generalization. Features Kept EER (%) Accuracy (%) Top-30 4.47% 84.93% Top-52 3.90% 90.42% Top-65 (Best) 3.43% 92.68% All (112) 4.45% 88.45% Network Architecture Simpler architectures proved robust, but the baseline [128, 64] remained competitive. [128] (Single Layer): EER 4.20%, Acc 89.72% [128, 64] (Baseline): EER 3.90%, Acc 88.03% 🏆 Final Evaluation The final optimized system utilizes the Combined sensor data with Top-65 ranked features and a [128, 64] MLP architecture . Final Performance Metrics (Cross-Day) Equal Error Rate (EER): 3.43% Classification Accuracy: 92.68% False Acceptance Rate (FAR): 0.0093 False Rejection Rate (FRR): 0.0817 This performance demonstrates that the system is highly effective at authenticating users even on different days, validating the stability of the extracted gait features. 📊 Evaluation Scenarios The system is evaluated under three distinct scenarios to test robustness: Scenario Description Purpose Scenario 1: Same-Day Train on 70% of Day 1, Test on 30% of Day 1. Baseline performance check. Scenario 2: Cross-Day Train on Day 1, Test on Day 2. Real-world simulation. Tests temporal stability of gait. Scenario 3: Combined Train/Test on mixed data from both days. Tests overall data variance handling. Key Metrics FAR (False Acceptance Rate): Likelihood of an impostor being accepted. FRR (False Rejection Rate): Likelihood of a genuine user being rejected. EER (Equal Error Rate): The point where FAR = FRR (Lower is better). Accuracy: Overall correct classification percentage. 📈 Results Summary Best Variant: Combined (Accelerometer + Gyroscope) yielded the lowest baseline EER of 4.45% . Optimization Success: Feature selection (Top-65) further reduced EER to 3.43% . Robustness: The system maintained >92% accuracy even when tested on data from a different day (Cross-Day scenario). 📊 Visualizations Gallery The project generates 8 comprehensive visualizations to document system performance. All plots are saved in results/plots/ directory. Plot Description Preview 1. EER Curve (Cross-Day) FAR and FRR curves vs. threshold with EER point marked. Shows the trade-off between false acceptance and false rejection rates. 2. Overlap Comparison Cross-Day EER comparison between 0% and 50% window overlap. Demonstrates impact of data augmentation. 3. Variant Comparison Performance comparison across Accel-only, Gyro-only, and Combined variants. 4. Feature Selection EER vs. number of features used. Shows optimal feature count (Top-65) for best performance. 5. Architecture Analysis Comparison of different MLP architectures ([64], [128], [128,64], etc.) on Cross-Day scenario. 6. Scenario Comparison EER across Same-Day, Cross-Day, and Combined evaluation scenarios. 7. Sample Acceleration Window Raw accelerometer signal (X, Y, Z axes) from a 5-second walking segment. 8. Gait Filtering Impact EER comparison between all data vs. gait-filtered data in Cross-Day scenario. Key Findings from Visualizations 📊 Plot 1 (EER Curve): Optimal threshold is ~0.45, achieving EER of 4.45% 📊 Plot 2 (Overlap): 50% overlap reduces EER compared to 0% overlap 📊 Plot 3 (Variants): Combined sensors reduce EER by 50% vs. accelerometer-only 📊 Plot 4 (Features): Top-65 features achieve lowest EER (3.43%), better than using all 112 📊 Plot 5 (Architecture): Single hidden layer [128] performs comparably to [128,64] 📊 Plot 6 (Scenarios): Cross-Day is hardest (EER 4.45%), Same-Day easiest (EER 3.05%) 📊 Plot 7 (Raw Signal): Shows typical gait periodicity in acceleration patterns 📊 Plot 8 (Gait Filtering): Gait-only segments improve authentication accuracy 🚀 How to Run Quick Start Clone/Download the project Open MATLAB and navigate to project root Run scripts in order: % Step 1: Feature Extraction (takes ~5-10 minutes) cd scripts run( ' Script1_FeatureExtraction.m ' ) % Step 2: Template Generation (takes ~1 minute) run( ' Script2_TemplateGeneration.m ' ) % Step 3: Classification & Evaluation (takes ~10-15 minutes) run( ' Script3_ClassificationEvaluation.m ' ) % Step 4: Generate Visualizations (takes ~1 minute) run( ' Plots.m ' ) Expected Output ✅ data_segmented/ - 20 .mat files (segmented data) ✅ features/ - 60 .mat files (time + freq features for 3 variants) ✅ templates/ - 4 .mat files (training-ready datasets) ✅ models/ - 1 .mat file (trained baseline MLP) ✅ results/ - 10+ CSV files + 8 PNG plots 📚 Key Insights & Lessons Learned ✅ What Worked Well Multi-Modal Fusion: Combining accelerometer and gyroscope reduced EER by 50% Feature Selection: Less is more - 65 features outperformed 112 features Gait Filtering: Removing non-walking segments improved cross-day robustness Simple Architecture: [128, 64] MLP proved sufficient (no need for deep networks) Proper Evaluation: Cross-day testing revealed true real-world performance ⚠️ Challenges Encountered Irregular Sampling: Raw sensor data required careful resampling Class Imbalance: Minor variations required downsampling Temporal Drift: Cross-day performance naturally lower than same-day Feature Redundancy: Many extracted features were highly correlated Overfitting Risk: Larger networks performed worse due to limited training data 🔮 Future Improvements More Users: Expand dataset to 20-50 users for better generalization Longer Duration: Collect data over 1-2 weeks to test long-term stability Real-Time Processing: Implement sliding window inference Mobile Deployment: Port model to TensorFlow Lite for smartphone apps Additional Activities: Test robustness with running, stairs, sitting Transfer Learning: Pre-train on large public gait datasets 🤝 Contributing We welcome contributions from the community! Whether you're fixing bugs, adding features, improving documentation, or suggesting enhancements, your help is appreciated. How to Contribute 🐛 Report Bugs: Open an issue with detailed information ✨ Suggest Features: Share your ideas for improvements 💻 Submit Code: Fork, create a branch, and submit a pull request 📖 Improve Docs: Help make documentation clearer and more comprehensive Please read our CONTRIBUTING.md for detailed guidelines on: Code style and standards Development workflow Testing requirements Pull request process Community guidelines 📄 License & Usage This is a research project. Feel free to use the code and methodology for educational purposes. 🛠️ Author Project Developer Date: November 2025 📞 Contact & Acknowledgments For questions about the methodology or implementation details, please refer to the comprehensive code comments in the MATLAB scripts. Note: This project demonstrates the feasibility of behavioral biometric authentication using smartphone sensors and achieves state-of-the-art performance (EER < 5%) suitable for practical deployment. For detailed performance graphs and visual analysis, check the results/plots/ directory. 🌟 Star History If you found this project helpful, please consider giving it a star! ⭐ Made with ❤️ and MATLAB Transforming Walking Patterns into Secure Authentication 🚶♂️🔐 © 2025 • Acceleration-based User Authentication System • Behavioral Biometrics Research
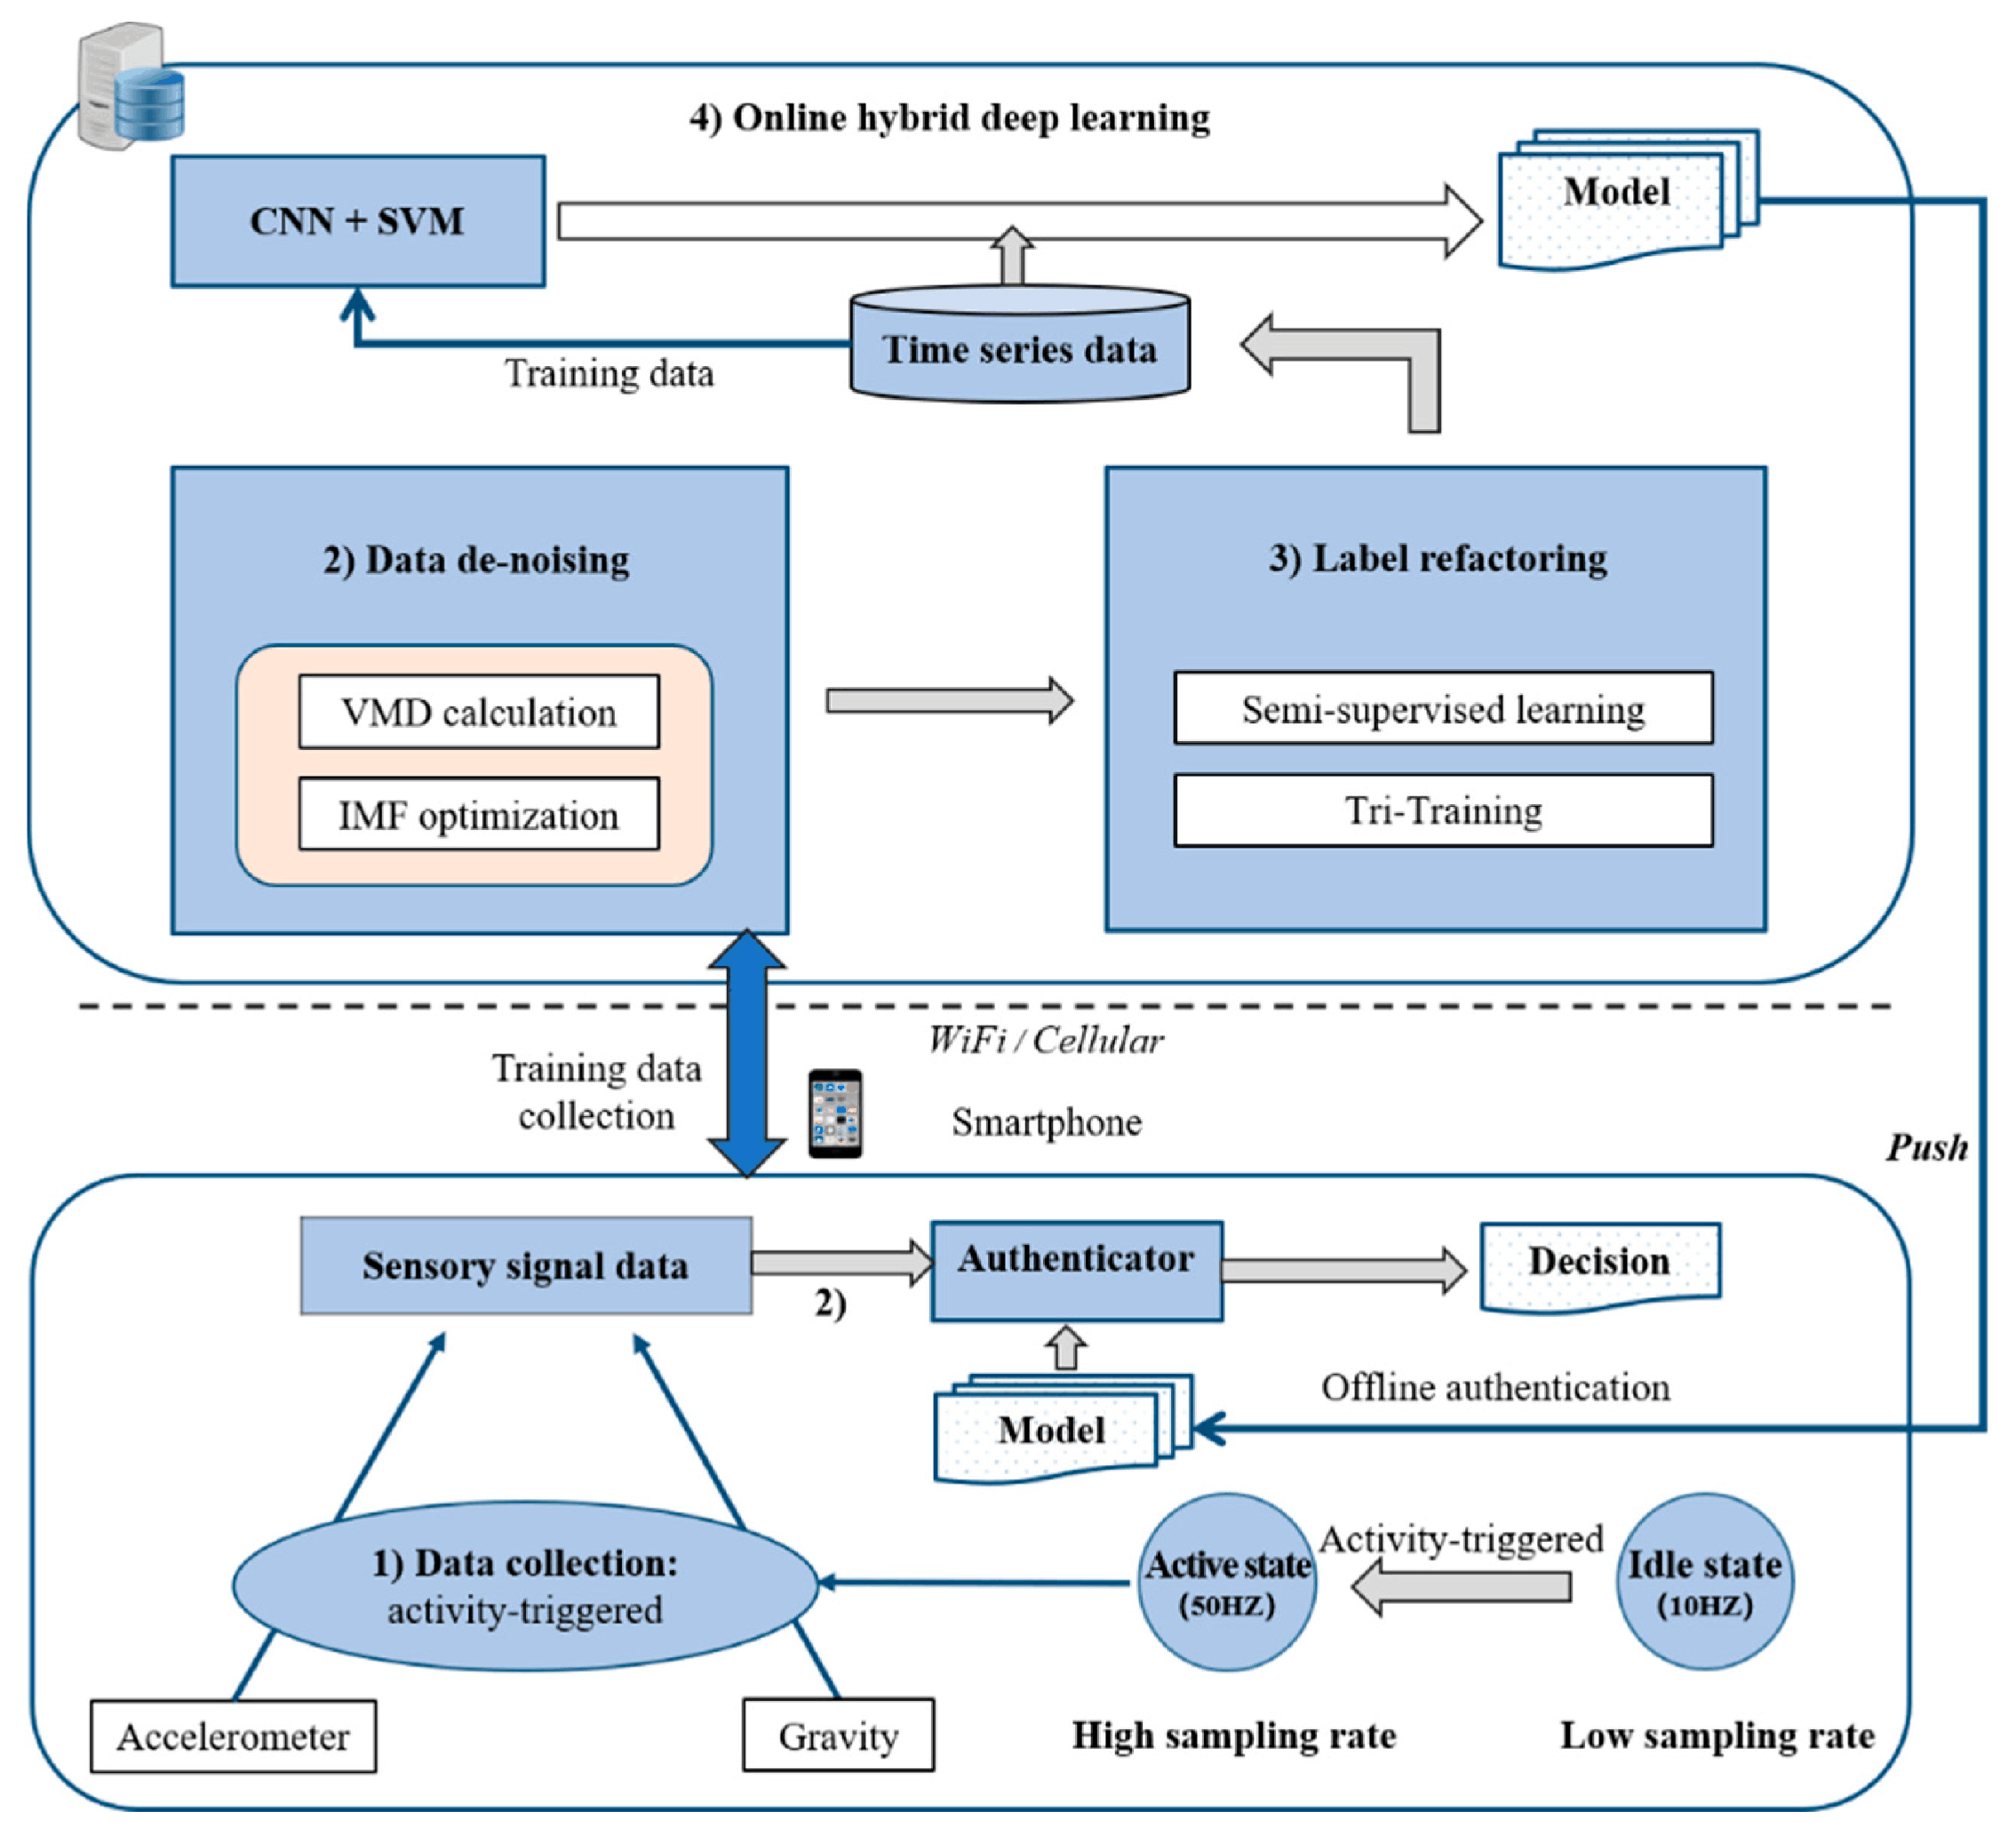
This project implements a behavioral biometric authentication system that identifies and verifies users based on their unique walking patterns (gait). Unlike traditional authentication methods (passwords, fingerprints), this system uses continuous sensor data from smartphone accelerometers and gyroscopes to authenticate users passively during normal walking.
🎯 Achievement: Successfully reduced Equal Error Rate (EER) to 3.43% with 92.68% accuracy using multi-sensor fusion and optimized feature selection.
✅ Multi-Sensor Fusion: Combines accelerometer and gyroscope data ✅ Rich Feature Extraction: 112 time and frequency domain features ✅ Deep Learning Classification: Multi-Layer Perceptron (MLP) with optimized architecture ✅ Gait-Specific Analysis: Filters walking segments from non-walking activities ✅ Cross-Day Validation: Rigorous testing across different days ✅ Systematic Optimization: Feature selection, architecture tuning, and data augmentation
project_root/ ├── 📁 data_raw/ # Raw CSV sensor data (10 Users × 2 Days) │ ├── U1NW_FD.csv # User 1, Full Day │ ├── U1NW_MD.csv # User 1, Morning Data │ └── ... ├── 📁 data_segmented/ # Segmented .mat files (5s windows, 0% overlap) │ └── User{X}_Day{Y}_segments.mat ├── 📁 data_segmented_50overlap/ # Segmented .mat files (5s windows, 50% overlap) ├── 📁 features/ # Extracted features organized by sensor type │ ├── accel/ # Accelerometer features only (45 features) │ ├── gyro/ # Gyroscope features only (45 features) │ └── combined/ # Multi-modal features (112 features) ├── 📁 templates/ # Pre-processed, balanced datasets for training │ ├── accel/AllTemplates_accel.mat │ ├── gyro/AllTemplates_gyro.mat │ └── combined/ │ ├── AllTemplates_combined.mat │ └── AllTemplates_combined_gait.mat # Gait-filtered data ├── 📁 models/ # Trained Neural Network models │ └── combined/baseline_mlp.mat ├── 📁 results/ # Evaluation metrics and analysis │ ├── combined/ # Scenario-wise metrics (CSV) │ ├── optimization/ # Optimization experiment results │ ├── plots/ # Generated visualizations (PNG) │ └── variants_comparison.csv # Cross-variant performance ├── 📁 scripts/ # MATLAB Source Code │ ├── Script1_FeatureExtraction.m # Stage 1-4: Preprocessing & Features │ ├── Script2_TemplateGeneration.m # Stage 5: Template Generation │ ├── Script3_ClassificationEvaluation.m # Stage 6-9: Training & Evaluation │ └── Plots.m # Visualization generation └── 📄 PROJECT_STRUCTURE.md # Detailed structure documentation
The system was tested on the challenging Cross-Day scenario (Train on Day 1, Test on Day 2) to evaluate real-world robustness.
2. Related Work, Literature Survey & Algorithmic Foundations
Observation: The Combined variant significantly outperforms single-sensor approaches, reducing the Equal Error Rate (EER) by nearly half compared to Accelerometer-only.
The final optimized system utilizes the Combined sensor data with Top-65 ranked features and a [128, 64] MLP architecture .
This performance demonstrates that the system is highly effective at authenticating users even on different days, validating the stability of the extracted gait features.
The project generates 8 comprehensive visualizations to document system performance. All plots are saved in results/plots/ directory.
📊 Plot 1 (EER Curve): Optimal threshold is ~0.45, achieving EER of 4.45% 📊 Plot 2 (Overlap): 50% overlap reduces EER compared to 0% overlap 📊 Plot 3 (Variants): Combined sensors reduce EER by 50% vs. accelerometer-only 📊 Plot 4 (Features): Top-65 features achieve lowest EER (3.43%), better than using all 112 📊 Plot 5 (Architecture): Single hidden layer [128] performs comparably to [128,64] 📊 Plot 6 (Scenarios): Cross-Day is hardest (EER 4.45%), Same-Day easiest (EER 3.05%) 📊 Plot 7 (Raw Signal): Shows typical gait periodicity in acceleration patterns 📊 Plot 8 (Gait Filtering): Gait-only segments improve authentication accuracy
% Step 1: Feature Extraction (takes ~5-10 minutes) cd scripts run( ' Script1_FeatureExtraction.m ' ) % Step 2: Template Generation (takes ~1 minute) run( ' Script2_TemplateGeneration.m ' ) % Step 3: Classification & Evaluation (takes ~10-15 minutes) run( ' Script3_ClassificationEvaluation.m ' ) % Step 4: Generate Visualizations (takes ~1 minute) run( ' Plots.m ' )
3. Dataset Ingestion, Preprocessing & Stochastic Augmentations
✅ data_segmented/ - 20 .mat files (segmented data) ✅ features/ - 60 .mat files (time + freq features for 3 variants) ✅ templates/ - 4 .mat files (training-ready datasets) ✅ models/ - 1 .mat file (trained baseline MLP) ✅ results/ - 10+ CSV files + 8 PNG plots
We welcome contributions from the community! Whether you're fixing bugs, adding features, improving documentation, or suggesting enhancements, your help is appreciated.
This is a research project. Feel free to use the code and methodology for educational purposes.
For questions about the methodology or implementation details, please refer to the comprehensive code comments in the MATLAB scripts.
Note: This project demonstrates the feasibility of behavioral biometric authentication using smartphone sensors and achieves state-of-the-art performance (EER < 5%) suitable for practical deployment.
For detailed performance graphs and visual analysis, check the results/plots/ directory.
4. Neural Network Backbone, Layer Specifications & Loss Formulations
© 2025 • Acceleration-based User Authentication System • Behavioral Biometrics Research
Deep learning-based behavioral biometric authentication system using smartphone accelerometer and gyroscope sensors for gait recognition. Achieves 3.43% EER and 92.68% accuracy through multi-sensor fusion and optimized neural networks. Built with MATLAB.
Smartphone Interaction and Motion Capture Biometric Authentication Pipeline Overview This repository contains a complete, reusable pipeline for biometric authentication research using smartphone interaction data (keystrokes and swipes) combined with motion capture data. The system extracts features from both phone sensors (accelerometer, gyroscope, touchscreen) and motion capture markers, processes them through various machine learning classifiers, and evaluates performance using Equal Error Rate (EER) metrics. Repository Structure reusable_repository/ ├── README.md # This file ├── LICENSE # License file ├── requirements.txt # Python dependencies ├── .env.example # Environment variable template │ ├── src/ # Main source code │ ├── __init__.py │ ├── core/ # Core pipeline components │ │ ├── __init__.py │ │ ├── main.py # Main entry point │ │ ├── preprocessing.py # Data preprocessing pipeline │ │ ├── functions.py # Core utility functions │ │ └── ml_train_test_generate_scores.py # ML training/testing orchestration │ │ │ ├── classifiers/ # Authentication classifiers │ │ ├── __init__.py │ │ ├── msd.py # Scaled Manhattan Distance │ │ ├── svm.py # One-Class SVM │ │ ├── svm_OHE.py # One-Class SVM with One-Hot Encoding │ │ ├── random_forest.py # Random Forest │ │ ├── random_forest_OHE.py # Random Forest with One-Hot Encoding │ │ ├── knn.py # K-Nearest Neighbors │ │ └── knn_OHE.py # K-Nearest Neighbors with One-Hot Encoding │ │ │ ├── extractors/ # Data extraction modules │ │ ├── __init__.py │ │ ├── extract_phone_data.py # Phone sensor data extraction (swipes) │ │ ├── extract_phone_data__keystrokes.py # Phone sensor data (keystrokes) │ │ ├── extract_motion_capture.py # Motion capture extraction (swipes) │ │ └── extract_motion_capture__keystrokes.py # Motion capture (keystrokes) │ │ │ ├── models/ # Deep learning models │ │ ├── __init__.py │ │ ├── dcgan.py # Deep Convolutional GAN │ │ ├── dcgan_pca_gan.py # DCGAN with PCA │ │ ├── dcgan_pca_wgangp.py # DCGAN with PCA and WGAN-GP │ │ ├── siamese_cnn.py # Siamese CNN │ │ └── cnn_lstm.py # CNN-LSTM hybrid │ │ │ ├── utils/ # Utility modules │ │ ├── __init__.py │ │ ├── keystroke_functions.py # Keystroke-specific utilities │ │ ├── plotting.py # Plotting utilities │ │ └── analysis.py # Analysis utilities │ │ │ └── analysis/ # Analysis and evaluation tools │ ├── __init__.py │ ├── mutual_information.py # Mutual information analysis │ ├── PCA_analysis.py # Principal Component Analysis │ └── evaluate_forgery_quality.py # Forgery evaluation │ ├── config/ # Configuration files │ ├── feature_set_config.json # Feature set definitions │ ├── run_config__example.json # Example run configuration │ └── user_dict.json # User metadata (example) │ ├── scripts/ # Utility scripts │ └── slurm/ # HPC/SLURM job scripts │ ├── docs/ # Documentation │ ├── ARCHITECTURE.md # System architecture │ ├── DATA_FORMAT.md # Data format specifications │ ├── FEATURES.md # Feature extraction documentation │ └── USAGE.md # Detailed usage guide │ └── examples/ # Example scripts and notebooks └── basic_pipeline_example.py # Basic usage example Features Data Extraction Phone Sensor Data : Extracts features from accelerometer, gyroscope, and touchscreen interactions Motion Capture Data : Processes 3D marker positions from motion capture systems Keystroke Analysis : Supports digraph, trigraph, and single keystroke analysis Swipe Analysis : Processes swipe gestures with direction and velocity features Feature Engineering Statistical feature extraction (mean, std, min, max, etc.) Time-windowed feature aggregation Motion capture marker region analysis (upper body, center, lower body) Feature filtering and selection capabilities Classifiers MSD (Scaled Manhattan Distance) : Template-based distance metric One-Class SVM : Support Vector Machine for one-class classification Random Forest : Ensemble method with hyperparameter optimization K-Nearest Neighbors : Distance-based classification Deep Learning Models DCGAN : Deep Convolutional Generative Adversarial Network for synthetic data generation Siamese CNN : Siamese network for similarity learning CNN-LSTM : Hybrid architecture for sequential pattern recognition Evaluation Metrics Equal Error Rate (EER) calculation ROC curve generation Per-user and aggregate performance statistics Digraph matching statistics for keystroke analysis Installation Prerequisites Python 3.7 or higher Sufficient disk space for data processing (varies by dataset size) Setup Clone or copy this repository git clone < repository-url > cd behavioral-biometrics-pipeline Create a virtual environment (recommended) python3 -m venv venv source venv/bin/activate # On Windows: venv\Scripts\activate Install dependencies pip install -r requirements.txt For optional PyTorch support (if using PyTorch-based models): pip install -r requirements-optional.txt Set up environment variables cp .env.example .env # Edit .env and set DATA_PATH to your data directory # Also set PKL_PATH if you have pre-extracted pickle files Create output directory mkdir -p Data_Write Quick Start Basic Usage Prepare your configuration file cp config/run_config__example.json config/run_config.json # Edit run_config.json with your settings Run the pipeline python src/core/main.py --config-json config/run_config.json Configuration The pipeline is configured via JSON files. Key configuration options: classifier : Choose from 'msd' , 'svm' , 'rf' , 'knn' swipe_or_keystroke : 'Swiping' or 'Typing' by_interaction_or_time : 'by_time' (time-based windows) or 'by_interaction' (interaction-based) windows : Array of window sizes in seconds (e.g., [1, 5, 10, 30, 60] ) feature_sets : Array of feature set names from feature_set_config.json user_config : User selection ( 'all' , 'groups' , or 'individual' ) See docs/USAGE.md for detailed configuration documentation. Data Format The dataset can be downloaded from NYIT's LAMP website here ~85GB. The data should already be organized as follows: Expected Directory Structure DATA_PATH/ ├── USER_ID_1/ │ ├── session_1/ │ │ ├── sit_and_swipe/ │ │ │ ├── trial_1/ │ │ │ │ ├── swipe_data.csv │ │ │ │ ├── accelerometer.csv │ │ │ │ └── gyroscope.csv │ │ │ └── trial_2/... │ │ └── walk_and_swipe/... │ └── session_2/... └── USER_ID_2/... File Formats CSV files : Must contain columns for timestamp, x, y, z coordinates Motion capture files : CSV format with marker positions See docs/DATA_FORMAT.md for detailed specifications Output Structure Each run creates a directory in Data_Write/ with: results/ : EER results and user-level statistics scores/ : Raw authentication scores flat_features/ : Processed feature vectors digraph_matching/ : Keystroke matching statistics (for typing) full_data_sit.pkl / full_data_walk.pkl : Full extracted data Documentation All documentation is located in the docs/ directory. See docs/README.md for a complete index. Quick Links: USAGE.md : Comprehensive usage guide with examples ARCHITECTURE.md : System architecture and design decisions DATA_FORMAT.md : Detailed data format specifications FEATURES.md : Feature extraction documentation HPC_VS_LOCAL.md : Guide for HPC vs local execution LIMITATIONS.md : Known limitations and incomplete features Citation If you use this code in your research, please cite: @phdthesis{cariello2026biometricthesis, title={Biometric Authentication Using Smartphone Interaction and Motion Capture Data}, author={Nicholas Cariello}, year={2026}, school={New York Institute of Technology} } License This project is licensed under the MIT License - see the LICENSE file for details. Note: Please update the copyright information in the LICENSE file with your name and the current year. Acknowledgments This work was developed as part of a PhD dissertation on smartphone-based biometric authentication using motion capture data provided through research funded from NYIT's LAMP .
This repository contains a complete, reusable pipeline for biometric authentication research using smartphone interaction data (keystrokes and swipes) combined with motion capture data. The system extracts features from both phone sensors (accelerometer, gyroscope, touchscreen) and motion capture markers, processes them through various machine learning classifiers, and evaluates performance using Equal Error Rate (EER) metrics.
reusable_repository/ ├── README.md # This file ├── LICENSE # License file ├── requirements.txt # Python dependencies ├── .env.example # Environment variable template │ ├── src/ # Main source code │ ├── __init__.py │ ├── core/ # Core pipeline components │ │ ├── __init__.py │ │ ├── main.py # Main entry point │ │ ├── preprocessing.py # Data preprocessing pipeline │ │ ├── functions.py # Core utility functions │ │ └── ml_train_test_generate_scores.py # ML training/testing orchestration │ │ │ ├── classifiers/ # Authentication classifiers │ │ ├── __init__.py │ │ ├── msd.py # Scaled Manhattan Distance │ │ ├── svm.py # One-Class SVM │ │ ├── svm_OHE.py # One-Class SVM with One-Hot Encoding │ │ ├── random_forest.py # Random Forest │ │ ├── random_forest_OHE.py # Random Forest with One-Hot Encoding │ │ ├── knn.py # K-Nearest Neighbors │ │ └── knn_OHE.py # K-Nearest Neighbors with One-Hot Encoding │ │ │ ├── extractors/ # Data extraction modules │ │ ├── __init__.py │ │ ├── extract_phone_data.py # Phone sensor data extraction (swipes) │ │ ├── extract_phone_data__keystrokes.py # Phone sensor data (keystrokes) │ │ ├── extract_motion_capture.py # Motion capture extraction (swipes) │ │ └── extract_motion_capture__keystrokes.py # Motion capture (keystrokes) │ │ │ ├── models/ # Deep learning models │ │ ├── __init__.py │ │ ├── dcgan.py # Deep Convolutional GAN │ │ ├── dcgan_pca_gan.py # DCGAN with PCA │ │ ├── dcgan_pca_wgangp.py # DCGAN with PCA and WGAN-GP │ │ ├── siamese_cnn.py # Siamese CNN │ │ └── cnn_lstm.py # CNN-LSTM hybrid │ │ │ ├── utils/ # Utility modules │ │ ├── __init__.py │ │ ├── keystroke_functions.py # Keystroke-specific utilities │ │ ├── plotting.py # Plotting utilities │ │ └── analysis.py # Analysis utilities │ │ │ └── analysis/ # Analysis and evaluation tools │ ├── __init__.py │ ├── mutual_information.py # Mutual information analysis │ ├── PCA_analysis.py # Principal Component Analysis │ └── evaluate_forgery_quality.py # Forgery evaluation │ ├── config/ # Configuration files │ ├── feature_set_config.json # Feature set definitions │ ├── run_config__example.json # Example run configuration │ └── user_dict.json # User metadata (example) │ ├── scripts/ # Utility scripts │ └── slurm/ # HPC/SLURM job scripts │ ├── docs/ # Documentation │ ├── ARCHITECTURE.md # System architecture │ ├── DATA_FORMAT.md # Data format specifications │ ├── FEATURES.md # Feature extraction documentation │ └── USAGE.md # Detailed usage guide │ └── examples/ # Example scripts and notebooks └── basic_pipeline_example.py # Basic usage example
cp .env.example .env # Edit .env and set DATA_PATH to your data directory # Also set PKL_PATH if you have pre-extracted pickle files
5. Training Protocol, Convergence Behavior & Experimental Evaluation
cp config/run_config__example.json config/run_config.json # Edit run_config.json with your settings
The dataset can be downloaded from NYIT's LAMP website here ~85GB. The data should already be organized as follows:
DATA_PATH/ ├── USER_ID_1/ │ ├── session_1/ │ │ ├── sit_and_swipe/ │ │ │ ├── trial_1/ │ │ │ │ ├── swipe_data.csv │ │ │ │ ├── accelerometer.csv │ │ │ │ └── gyroscope.csv │ │ │ └── trial_2/... │ │ └── walk_and_swipe/... │ └── session_2/... └── USER_ID_2/...
All documentation is located in the docs/ directory. See docs/README.md for a complete index.
@phdthesis{cariello2026biometricthesis, title={Biometric Authentication Using Smartphone Interaction and Motion Capture Data}, author={Nicholas Cariello}, year={2026}, school={New York Institute of Technology} }
Note: Please update the copyright information in the LICENSE file with your name and the current year.
Model Figures & Evaluation Curves (4 Images)
Deep Learning Execution Pipeline
(Preprocessing)
(Feature Extraction)
(Self-Attention)
(Loss Optimization)