Complete Technical Paper Content — Ai Biometric Authentication
1. Executive Abstract, Problem Formulation & Background
Biometrics are body measurements and calculations related to human characteristics and features. Biometric authentication (or realistic authentication) is used in computer science as a form of identification and access control. It is also used to identify individuals in groups that are under surveillance. Biometric identifiers are the distinctive, measurable characteristics used to label and describe individuals. Biometric identifiers are often categorized as physiological characteristics which are related to the shape of the body. Examples include, but are not limited to fingerprint, palm veins, face recognition, DNA, palm print, hand geometry, iris recognition, retina, odor/scent, voice and shape of ears. Behavioral characteristics are related to the pattern of behavior of a person, including but not limited to mouse movement, typing rhythm, gait, signature, voice, and behavioral profiling. Some researchers have coined the term "Behaviometrics" (behavioral biometrics) to describe the latter class of biometrics. More traditional means of access control include token-based identification systems, such as a driver's license or passport, and knowledge-based identification systems, such as a password or personal identification number. Since biometric identifiers are unique to individuals, they are more reliable in verifying identity than token and knowledge-based methods; however, the collection of biometric identifiers raises privacy concerns.
Universality: Every person using a system should possess the trait. Uniqueness: The trait should be sufficiently different for individuals in the relevant population such that they can be distinguished from one another. Permanence: The manner in which a trait varies over time. More specifically, a trait with good permanence will be reasonably invariant over time with respect to the specific matching algorithm. Measurability (collectability): The ease of acquisition or measurement of the trait. In addition, acquired data should be in a form that permits subsequent processing and extraction of the relevant feature sets. Performance: The accuracy, speed, and robustness of technology used (see performance section for more details). Acceptability: How well individuals in the relevant population accept the technology such that they are willing to have their biometric trait captured and assessed. Circumvention: The ease with which a trait might be imitated using an artifact or substitute. Proper biometric use is application dependent. Certain biometrics will be more suitable than others based on the required levels of convenience and security. No single biometric will meet all the requirements of every possible application.
The block diagram illustrates the two basic modes of a biometric system. First, in verification (or authentication) mode the system performs a one-to-one comparison of a captured biometric with a specific template stored in a biometric database in order to verify the individual is the person they claim to be. Three steps are involved in the verification of a person. In the first step, reference models for all the users are generated and stored in the model database. In the second step, some samples are matched with reference models to generate the genuine and impostor scores and calculate the threshold. The third step is the testing step. This process may use a smart card, username, or ID number (e.g. PIN) to indicate which template should be used for comparison. Positive recognition is a common use of the verification mode, "where the aim is to prevent multiple people from using the same identity".
Second, in identification mode the system performs a one-to-many comparison against a biometric database in an attempt to establish the identity of an unknown individual. The system will succeed in identifying the individual if the comparison of the biometric sample to a template in the database falls within a previously set threshold. Identification mode can be used either for positive recognition (so that the user does not have to provide any information about the template to be used) or for negative recognition of the person "where the system establishes whether the person is who she (implicitly or explicitly) denies to be". The latter function can only be achieved through biometrics since other methods of personal recognition, such as passwords, PINs, or keys, are ineffective. The first time an individual uses a biometric system is called enrollment. During enrollment, biometric information from an individual is captured and stored. In subsequent uses, biometric information is detected and compared with the information stored at the time of enrollment. Note that it is crucial that storage and retrieval of such systems themselves be secure if the biometric system is to be robust. The first block (sensor) is the interface between the real world and the system; it has to acquire all the necessary data. Most of the time it is an image acquisition system, but it can change according to the characteristics desired. The second block performs all the necessary pre-processing: it has to remove artifacts from the sensor, to enhance the input (e.g. removing background noise), to use some kind of normalization, etc. In the third block, necessary features are extracted. This step is an important step as the correct features need to be extracted in an optimal way. A vector of numbers or an image with particular properties is used to create a template. A template is a synthesis of the relevant characteristics extracted from the source. Elements of the biometric measurement that are not used in the comparison algorithm are discarded in the template to reduce the file size and to protect the identity of the enrollee. However, depending on the scope of the biometric system, original biometric image sources may be retained, such as the PIV-cards used in the Federal Information Processing Standard Personal Identity Verification (PIV) of Federal Employees and Contractors (FIPS 201). During the enrollment phase, the template is simply stored somewhere (on a card or within a database or both). During the matching phase, the obtained template is passed to a matcher that compares it with other existing templates, estimating the distance between them using any algorithm (e.g. Hamming distance). The matching program will analyze the template with the input. This will then be output for a specified use or purpose (e.g. entrance in a restricted area), though it is a fear that the use of biometric data may face mission creep. Selection of biometrics in any practical application depending upon the characteristic measurements and user requirements. In selecting a particular biometric, factors to consider include, performance, social acceptability, ease of circumvention and/or spoofing, robustness, population coverage, size of equipment needed and identity theft deterrence. The selection of a biometric is based on user requirements and considers sensor and device availability, computational time and reliability, cost, sensor size, and power consumption.
2. Related Work, Literature Survey & Algorithmic Foundations
False match rate (FMR, also called FAR = False Accept Rate): the probability that the system incorrectly matches the input pattern to a non-matching template in the database. It measures the percent of invalid inputs that are incorrectly accepted. In case of similarity scale, if the person is an imposter in reality, but the matching score is higher than the threshold, then he is treated as genuine. This increases the FMR, which thus also depends upon the threshold value. False non-match rate (FNMR, also called FRR = False Reject Rate): the probability that the system fails to detect a match between the input pattern and a matching template in the database. It measures the percent of valid inputs that are incorrectly rejected. Receiver operating characteristic or relative operating characteristic (ROC): The ROC plot is a visual characterization of the trade-off between the FMR and the FNMR. In general, the matching algorithm performs a decision based on a threshold that determines how close to a template the input needs to be for it to be considered a match. If the threshold is reduced, there will be fewer false non-matches but more false accepts. Conversely, a higher threshold will reduce the FMR but increase the FNMR. A common variation is the Detection error trade-off (DET), which is obtained using normal deviation scales on both axes. This more linear graph illuminates the differences for higher performances (rarer errors). Equal error rate or crossover error rate (EER or CER): the rate at which both acceptance and rejection errors are equal. The value of the EER can be easily obtained from the ROC curve. The EER is a quick way to compare the accuracy of devices with different ROC curves. In general, the device with the lowest EER is the most accurate. Failure to enroll rate (FTE or FER): the rate at which attempts to create a template from an input is unsuccessful. This is most commonly caused by low-quality inputs. Failure to capture rate (FTC): Within automatic systems, the probability that the system fails to detect a biometric input when presented correctly. Template capacity: the maximum number of sets of data that can be stored in the system.
An early cataloguing of fingerprints dates back to 1885 when Juan Vucetich started a collection of fingerprints of criminals in Argentina. Josh Ellenbogen and Nitzan Lebovic argued that Biometrics originated in the identification systems of criminal activity developed by Alphonse Bertillon (1853–1914) and by Francis Galton's theory of fingerprints and physiognomy. Historian Keith Breckenridge note that Galton's travels in South Africa reinforced his early racial prejudices and inspired his later commitment to classifying human difference scientifically. According to Lebovic, Galton's work "led to the application of mathematical models to fingerprints, phrenology, and facial characteristics", as part of "absolute identification" and "a key to both inclusion and exclusion" of populations. Accordingly, "the biometric system is the absolute political weapon of our era" and a form of "soft control". The theoretician David Lyon showed that during the past two decades biometric systems have penetrated the civilian market, and blurred the lines between governmental forms of control and private corporate control. Kelly A. Gates identified 9/11 as the turning point for the cultural language of our present: "in the language of cultural studies, the aftermath of 9/11 was a moment of articulation, where objects or events that have no necessary connection come together and a new discourse formation is established: automated facial recognition as a homeland security technology."
It is possible that data obtained during biometric enrollment may be used in ways for which the enrolled individual has not consented. For example, most biometric features could disclose physiological and/or pathological medical conditions (e.g., some fingerprint patterns are related to chromosomal diseases, iris patterns could reveal sex, hand vein patterns could reveal vascular diseases, most behavioral biometrics could reveal neurological diseases, etc.). Moreover, second generation biometrics, notably behavioral and electro-physiologic biometrics (e.g., based on electrocardiography, electroencephalography, electromyography), could be also used for emotion detection. There are three categories of privacy concerns:
Unintended functional scope: The authentication goes further than authentication, such as finding a tumor. Unintended application scope: The authentication process correctly identifies the subject when the subject did not wish to be identified. Covert identification: The subject is identified without seeking identification or authentication, i.e. a subject's face is identified in a crowd. In terms of recognition or identification performance for a given trait, a biometric system should not exhibit accuracy differences across demographic groups. Disparities in accuracy can lead to uneven error rates for populations defined by gender, race, age, or other attributes. Therefore, biometric systems should be designed and evaluated to ensure demographic fairness, providing equitable performance for all users.
3. Dataset Ingestion, Preprocessing & Stochastic Augmentations
To ensure we can shut down terrorist networks before they ever get to the United States, we must also take the lead in driving international biometric standards. By developing compatible systems, we will be able to securely share terrorist information internationally to bolster our defenses. Just as we are improving the way we collaborate within the U.S. Government to identify and weed out terrorists and other dangerous people, we have the same obligation to work with our partners abroad to prevent terrorists from making any move undetected. Biometrics provide a new way to bring terrorists' true identities to light, stripping them of their greatest advantage—remaining unknown. According to an article written in 2009 by S. Magnuson in the National Defense Magazine entitled "Defense Department Under Pressure to Share Biometric Data" the United States has bilateral agreements with other nations aimed at sharing biometric data. To quote that article:
Miller [a consultant to the Office of Homeland Defense and America's security affairs] said the United States has bilateral agreements to share biometric data with about 25 countries. Every time a foreign leader has visited Washington during the last few years, the State Department has made sure they sign such an agreement.
GDPR in the European Union became law in 2018 LGPD in Brazil became law in 2020 Protection of Personal Information Act in South Africa came into force in 2020 Personal Data Protection Act in Sri Lanka implementation started in 2023
Countries using biometrics include Australia, Brazil, Bulgaria, Canada, Cyprus, Greece, China, Gambia, Germany, India, Iraq, Ireland, Israel, Italy, Malaysia, Netherlands, New Zealand, Nigeria, Norway, Pakistan, Poland, South Africa, Saudi Arabia, Tanzania, Turkey, Ukraine, United Arab Emirates, United Kingdom, United States and Venezuela. Among low to middle income countries, roughly 1.2 billion people have already received identification through a biometric identification program. There are also numerous countries applying biometrics for voter registration and similar electoral purposes. According to the International IDEA's ICTs in Elections Database, some of the countries using (2017) Biometric Voter Registration (BVR) are Armenia, Angola, Bangladesh, Bhutan, Bolivia, Brazil, Burkina Faso, Cambodia, Cameroon, Chad, Colombia, Comoros, Congo (Democratic Republic of), Costa Rica, Ivory Coast, Dominican Republic, Fiji, Gambia, Ghana, Guatemala, India, Iraq, Kenya, Lesotho, Liberia, Malawi, Mali, Mauritania, Mexico, Morocco, Mozambique, Namibia, Nepal, Nicaragua, Nigeria, Panama, Peru, Philippines, Senegal, Sierra Leone, Solomon Islands, Somaliland, Swaziland, Tanzania, Uganda, Uruguay, Venezuela, Yemen, Zambia, and Zimbabwe.
4. Neural Network Backbone, Layer Specifications & Loss Formulations
Keystroke dynamics, keystroke biometrics, typing dynamics, or typing biometrics refer to the collection of biometric information generated by key-press-related events that occur when a user types on a keyboard. Use of patterns in key operation to identify operators predates modern computing, and has been proposed as an authentication alternative to passwords and PIN numbers.
🚶♂️ Acceleration-based User Authentication System Behavioral Biometric Authentication using Gait Analysis 📖 Project Overview This project implements a behavioral biometric authentication system that identifies and verifies users based on their unique walking patterns (gait). Unlike traditional authentication methods (passwords, fingerprints), this system uses continuous sensor data from smartphone accelerometers and gyroscopes to authenticate users passively during normal walking. 🎯 Achievement: Successfully reduced Equal Error Rate (EER) to 3.43% with 92.68% accuracy using multi-sensor fusion and optimized feature selection. 🎯 Key Objectives 🔐 User Authentication: Classify 10 different users with high accuracy 📅 Cross-Day Robustness: Ensure models trained on one day work effectively on different days 🌍 Real-World Feasibility: Handle varying conditions, walking speeds, and temporal variations ⚡ Optimization: Achieve minimal Equal Error Rate (EER) through systematic optimization 🌟 Key Features ✅ Multi-Sensor Fusion: Combines accelerometer and gyroscope data ✅ Rich Feature Extraction: 112 time and frequency domain features ✅ Deep Learning Classification: Multi-Layer Perceptron (MLP) with optimized architecture ✅ Gait-Specific Analysis: Filters walking segments from non-walking activities ✅ Cross-Day Validation: Rigorous testing across different days ✅ Systematic Optimization: Feature selection, architecture tuning, and data augmentation 📊 Dataset Information 📥 Data Collection 👥 Users: 10 participants 📆 Days: 2 collection sessions per user 📱 Sensors: 6-axis IMU (3-axis accelerometer + 3-axis gyroscope) 📲 Device: Smartphone (waist-mounted) ⚙️ Sampling Rate: Variable (resampled to 30 Hz) 🚶 Activity: Natural walking patterns 📈 Data Statistics 📄 Total Files: 20 CSV files (10 users × 2 days) 📊 Segments per User/Day: ~71 segments (5-second windows) 🎯 Total Training Samples: ~1,420 segments 🔢 Features per Segment: 112 (combined variant) 📂 Project Structure project_root/ ├── 📁 data_raw/ # Raw CSV sensor data (10 Users × 2 Days) │ ├── U1NW_FD.csv # User 1, Full Day │ ├── U1NW_MD.csv # User 1, Morning Data │ └── ... ├── 📁 data_segmented/ # Segmented .mat files (5s windows, 0% overlap) │ └── User{X}_Day{Y}_segments.mat ├── 📁 data_segmented_50overlap/ # Segmented .mat files (5s windows, 50% overlap) ├── 📁 features/ # Extracted features organized by sensor type │ ├── accel/ # Accelerometer features only (45 features) │ ├── gyro/ # Gyroscope features only (45 features) │ └── combined/ # Multi-modal features (112 features) ├── 📁 templates/ # Pre-processed, balanced datasets for training │ ├── accel/AllTemplates_accel.mat │ ├── gyro/AllTemplates_gyro.mat │ └── combined/ │ ├── AllTemplates_combined.mat │ └── AllTemplates_combined_gait.mat # Gait-filtered data ├── 📁 models/ # Trained Neural Network models │ └── combined/baseline_mlp.mat ├── 📁 results/ # Evaluation metrics and analysis │ ├── combined/ # Scenario-wise metrics (CSV) │ ├── optimization/ # Optimization experiment results │ ├── plots/ # Generated visualizations (PNG) │ └── variants_comparison.csv # Cross-variant performance ├── 📁 scripts/ # MATLAB Source Code │ ├── Script1_FeatureExtraction.m # Stage 1-4: Preprocessing & Features │ ├── Script2_TemplateGeneration.m # Stage 5: Template Generation │ ├── Script3_ClassificationEvaluation.m # Stage 6-9: Training & Evaluation │ └── Plots.m # Visualization generation └── 📄 PROJECT_STRUCTURE.md # Detailed structure documentation 🚀 Getting Started Prerequisites MATLAB (R2021a or later recommended) Deep Learning Toolbox (for patternnet , train ) Signal Processing Toolbox (for pwelch , bandpower ) Statistics and Machine Learning Toolbox (for cvpartition , fitcecoc ) ⚙️ Execution Workflow Run the scripts in the following order to reproduce the full pipeline: 1️⃣ Feature Extraction Script: scripts/Script1_FeatureExtraction.m Input: data_raw/*.csv Process: Loads raw sensor data. Resamples signals to a fixed 30 Hz . Segments data into 5-second windows (150 samples). Extracts Time-Domain Features (Mean, Std, RMS, Skewness, Kurtosis, etc.). Extracts Frequency-Domain Features (Bandpower, Energy, Spectral Entropy, etc.). Output: data_segmented/ , features/ 2️⃣ Template Generation Script: scripts/Script2_TemplateGeneration.m Input: features/ Process: Aggregates features from all users. Performs Gait Filtering (removes non-walking segments based on spectral energy). Checks for class imbalance and applies downsampling if necessary. Generates unified datasets for Accel, Gyro, and Combined variants. Output: templates/ 3️⃣ Classification & Evaluation Script: scripts/Script3_ClassificationEvaluation.m Input: templates/ Process: Training: Trains a Multi-Class MLP (Feed-Forward Network). Evaluation: Calculates FAR, FRR, EER, and Accuracy for 3 scenarios. Optimization: Experiments with feature selection (Fisher Score), network architecture, and split ratios. Comparison: Compares Accel-only vs. Gyro-only vs. Combined performance. Output: models/ , results/ 🧠 Methodology 1. Preprocessing Resampling: Linear interpolation to 30 Hz to handle irregular sensor sampling. Segmentation: Fixed-width sliding windows (5 seconds). Overlap: Supports 0% (baseline) and 50% (optimized) overlap. 2. Feature Engineering The system extracts 70+ features per segment to capture unique gait characteristics: Domain Features Extracted Time Domain Mean, Std Dev, Min, Max, RMS, Variance, Range, 75th Percentile, Skewness, Kurtosis, IQR, Vector Magnitude stats. Frequency Domain Bandpower (0.5-3Hz), Total Energy, Dominant Frequency, Spectral Centroid, Spectral Entropy, High-band Power (3-10Hz), Dominant Amplitude. 3. Machine Learning Model Classifier: Pattern Recognition Network ( patternnet ) Architecture: Multi-Layer Perceptron (MLP) Input Layer: ~112 features (Combined variant) Hidden Layers: [128, 64] neurons (Baseline) Output Layer: 10 neurons (Softmax for 10 users) Training Algo: Scaled Conjugate Gradient ( trainscg ) 🔬 Experimental Results & Analysis 1. Variant Comparison (Cross-Day Scenario) The system was tested on the challenging Cross-Day scenario (Train on Day 1, Test on Day 2) to evaluate real-world robustness. Variant EER (%) Accuracy (%) FAR FRR Combined (Accel+Gyro) 4.45% 88.45% 0.0136 0.1204 Accelerometer Only 8.85% 79.72% 0.0227 0.2030 Gyroscope Only 19.49% 60.85% 0.0442 0.3961 Observation: The Combined variant significantly outperforms single-sensor approaches, reducing the Equal Error Rate (EER) by nearly half compared to Accelerometer-only. 2. Optimization Experiments Several optimization levers were tested to improve performance beyond the baseline. Feature Selection (Rank-Average Fisher Score) Reducing the feature set to the most discriminative features improved generalization. Features Kept EER (%) Accuracy (%) Top-30 4.47% 84.93% Top-52 3.90% 90.42% Top-65 (Best) 3.43% 92.68% All (112) 4.45% 88.45% Network Architecture Simpler architectures proved robust, but the baseline [128, 64] remained competitive. [128] (Single Layer): EER 4.20%, Acc 89.72% [128, 64] (Baseline): EER 3.90%, Acc 88.03% 🏆 Final Evaluation The final optimized system utilizes the Combined sensor data with Top-65 ranked features and a [128, 64] MLP architecture . Final Performance Metrics (Cross-Day) Equal Error Rate (EER): 3.43% Classification Accuracy: 92.68% False Acceptance Rate (FAR): 0.0093 False Rejection Rate (FRR): 0.0817 This performance demonstrates that the system is highly effective at authenticating users even on different days, validating the stability of the extracted gait features. 📊 Evaluation Scenarios The system is evaluated under three distinct scenarios to test robustness: Scenario Description Purpose Scenario 1: Same-Day Train on 70% of Day 1, Test on 30% of Day 1. Baseline performance check. Scenario 2: Cross-Day Train on Day 1, Test on Day 2. Real-world simulation. Tests temporal stability of gait. Scenario 3: Combined Train/Test on mixed data from both days. Tests overall data variance handling. Key Metrics FAR (False Acceptance Rate): Likelihood of an impostor being accepted. FRR (False Rejection Rate): Likelihood of a genuine user being rejected. EER (Equal Error Rate): The point where FAR = FRR (Lower is better). Accuracy: Overall correct classification percentage. 📈 Results Summary Best Variant: Combined (Accelerometer + Gyroscope) yielded the lowest baseline EER of 4.45% . Optimization Success: Feature selection (Top-65) further reduced EER to 3.43% . Robustness: The system maintained >92% accuracy even when tested on data from a different day (Cross-Day scenario). 📊 Visualizations Gallery The project generates 8 comprehensive visualizations to document system performance. All plots are saved in results/plots/ directory. Plot Description Preview 1. EER Curve (Cross-Day) FAR and FRR curves vs. threshold with EER point marked. Shows the trade-off between false acceptance and false rejection rates. 2. Overlap Comparison Cross-Day EER comparison between 0% and 50% window overlap. Demonstrates impact of data augmentation. 3. Variant Comparison Performance comparison across Accel-only, Gyro-only, and Combined variants. 4. Feature Selection EER vs. number of features used. Shows optimal feature count (Top-65) for best performance. 5. Architecture Analysis Comparison of different MLP architectures ([64], [128], [128,64], etc.) on Cross-Day scenario. 6. Scenario Comparison EER across Same-Day, Cross-Day, and Combined evaluation scenarios. 7. Sample Acceleration Window Raw accelerometer signal (X, Y, Z axes) from a 5-second walking segment. 8. Gait Filtering Impact EER comparison between all data vs. gait-filtered data in Cross-Day scenario. Key Findings from Visualizations 📊 Plot 1 (EER Curve): Optimal threshold is ~0.45, achieving EER of 4.45% 📊 Plot 2 (Overlap): 50% overlap reduces EER compared to 0% overlap 📊 Plot 3 (Variants): Combined sensors reduce EER by 50% vs. accelerometer-only 📊 Plot 4 (Features): Top-65 features achieve lowest EER (3.43%), better than using all 112 📊 Plot 5 (Architecture): Single hidden layer [128] performs comparably to [128,64] 📊 Plot 6 (Scenarios): Cross-Day is hardest (EER 4.45%), Same-Day easiest (EER 3.05%) 📊 Plot 7 (Raw Signal): Shows typical gait periodicity in acceleration patterns 📊 Plot 8 (Gait Filtering): Gait-only segments improve authentication accuracy 🚀 How to Run Quick Start Clone/Download the project Open MATLAB and navigate to project root Run scripts in order: % Step 1: Feature Extraction (takes ~5-10 minutes) cd scripts run( ' Script1_FeatureExtraction.m ' ) % Step 2: Template Generation (takes ~1 minute) run( ' Script2_TemplateGeneration.m ' ) % Step 3: Classification & Evaluation (takes ~10-15 minutes) run( ' Script3_ClassificationEvaluation.m ' ) % Step 4: Generate Visualizations (takes ~1 minute) run( ' Plots.m ' ) Expected Output ✅ data_segmented/ - 20 .mat files (segmented data) ✅ features/ - 60 .mat files (time + freq features for 3 variants) ✅ templates/ - 4 .mat files (training-ready datasets) ✅ models/ - 1 .mat file (trained baseline MLP) ✅ results/ - 10+ CSV files + 8 PNG plots 📚 Key Insights & Lessons Learned ✅ What Worked Well Multi-Modal Fusion: Combining accelerometer and gyroscope reduced EER by 50% Feature Selection: Less is more - 65 features outperformed 112 features Gait Filtering: Removing non-walking segments improved cross-day robustness Simple Architecture: [128, 64] MLP proved sufficient (no need for deep networks) Proper Evaluation: Cross-day testing revealed true real-world performance ⚠️ Challenges Encountered Irregular Sampling: Raw sensor data required careful resampling Class Imbalance: Minor variations required downsampling Temporal Drift: Cross-day performance naturally lower than same-day Feature Redundancy: Many extracted features were highly correlated Overfitting Risk: Larger networks performed worse due to limited training data 🔮 Future Improvements More Users: Expand dataset to 20-50 users for better generalization Longer Duration: Collect data over 1-2 weeks to test long-term stability Real-Time Processing: Implement sliding window inference Mobile Deployment: Port model to TensorFlow Lite for smartphone apps Additional Activities: Test robustness with running, stairs, sitting Transfer Learning: Pre-train on large public gait datasets 🤝 Contributing We welcome contributions from the community! Whether you're fixing bugs, adding features, improving documentation, or suggesting enhancements, your help is appreciated. How to Contribute 🐛 Report Bugs: Open an issue with detailed information ✨ Suggest Features: Share your ideas for improvements 💻 Submit Code: Fork, create a branch, and submit a pull request 📖 Improve Docs: Help make documentation clearer and more comprehensive Please read our CONTRIBUTING.md for detailed guidelines on: Code style and standards Development workflow Testing requirements Pull request process Community guidelines 📄 License & Usage This is a research project. Feel free to use the code and methodology for educational purposes. 🛠️ Author Project Developer Date: November 2025 📞 Contact & Acknowledgments For questions about the methodology or implementation details, please refer to the comprehensive code comments in the MATLAB scripts. Note: This project demonstrates the feasibility of behavioral biometric authentication using smartphone sensors and achieves state-of-the-art performance (EER < 5%) suitable for practical deployment. For detailed performance graphs and visual analysis, check the results/plots/ directory. 🌟 Star History If you found this project helpful, please consider giving it a star! ⭐ Made with ❤️ and MATLAB Transforming Walking Patterns into Secure Authentication 🚶♂️🔐 © 2025 • Acceleration-based User Authentication System • Behavioral Biometrics Research
This project implements a behavioral biometric authentication system that identifies and verifies users based on their unique walking patterns (gait). Unlike traditional authentication methods (passwords, fingerprints), this system uses continuous sensor data from smartphone accelerometers and gyroscopes to authenticate users passively during normal walking.
🎯 Achievement: Successfully reduced Equal Error Rate (EER) to 3.43% with 92.68% accuracy using multi-sensor fusion and optimized feature selection.
5. Training Protocol, Convergence Behavior & Experimental Evaluation
✅ Multi-Sensor Fusion: Combines accelerometer and gyroscope data ✅ Rich Feature Extraction: 112 time and frequency domain features ✅ Deep Learning Classification: Multi-Layer Perceptron (MLP) with optimized architecture ✅ Gait-Specific Analysis: Filters walking segments from non-walking activities ✅ Cross-Day Validation: Rigorous testing across different days ✅ Systematic Optimization: Feature selection, architecture tuning, and data augmentation
project_root/ ├── 📁 data_raw/ # Raw CSV sensor data (10 Users × 2 Days) │ ├── U1NW_FD.csv # User 1, Full Day │ ├── U1NW_MD.csv # User 1, Morning Data │ └── ... ├── 📁 data_segmented/ # Segmented .mat files (5s windows, 0% overlap) │ └── User{X}_Day{Y}_segments.mat ├── 📁 data_segmented_50overlap/ # Segmented .mat files (5s windows, 50% overlap) ├── 📁 features/ # Extracted features organized by sensor type │ ├── accel/ # Accelerometer features only (45 features) │ ├── gyro/ # Gyroscope features only (45 features) │ └── combined/ # Multi-modal features (112 features) ├── 📁 templates/ # Pre-processed, balanced datasets for training │ ├── accel/AllTemplates_accel.mat │ ├── gyro/AllTemplates_gyro.mat │ └── combined/ │ ├── AllTemplates_combined.mat │ └── AllTemplates_combined_gait.mat # Gait-filtered data ├── 📁 models/ # Trained Neural Network models │ └── combined/baseline_mlp.mat ├── 📁 results/ # Evaluation metrics and analysis │ ├── combined/ # Scenario-wise metrics (CSV) │ ├── optimization/ # Optimization experiment results │ ├── plots/ # Generated visualizations (PNG) │ └── variants_comparison.csv # Cross-variant performance ├── 📁 scripts/ # MATLAB Source Code │ ├── Script1_FeatureExtraction.m # Stage 1-4: Preprocessing & Features │ ├── Script2_TemplateGeneration.m # Stage 5: Template Generation │ ├── Script3_ClassificationEvaluation.m # Stage 6-9: Training & Evaluation │ └── Plots.m # Visualization generation └── 📄 PROJECT_STRUCTURE.md # Detailed structure documentation
The system was tested on the challenging Cross-Day scenario (Train on Day 1, Test on Day 2) to evaluate real-world robustness.
Observation: The Combined variant significantly outperforms single-sensor approaches, reducing the Equal Error Rate (EER) by nearly half compared to Accelerometer-only.
Model Figures & Evaluation Curves (4 Images)
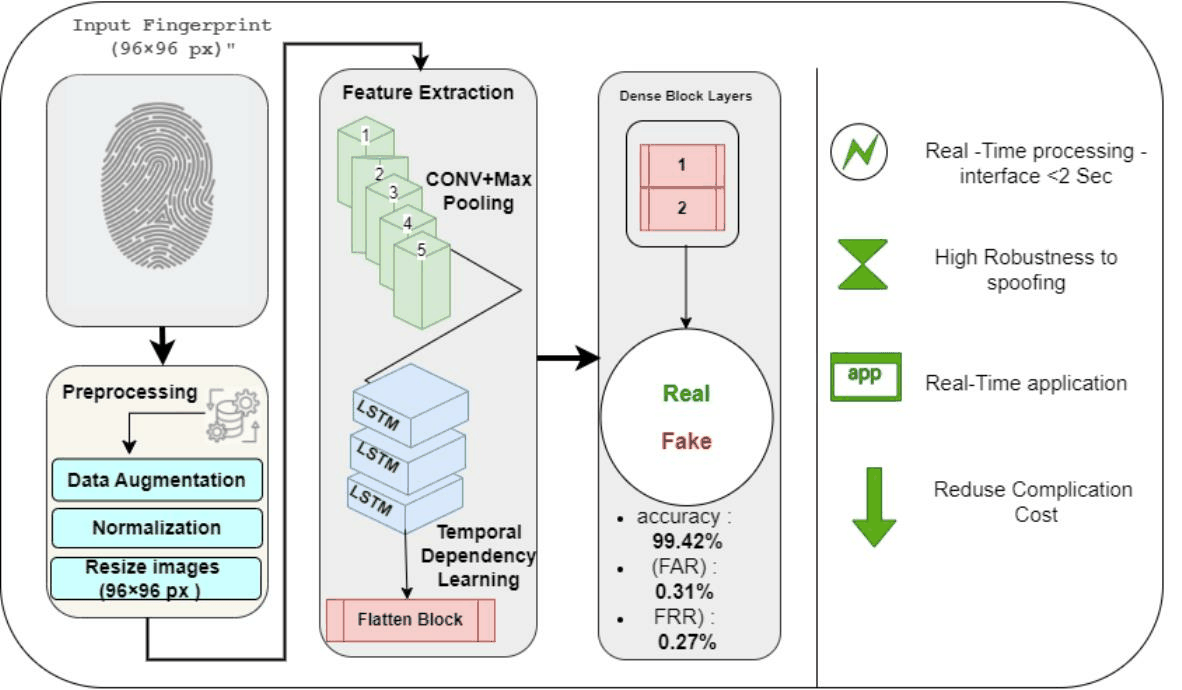
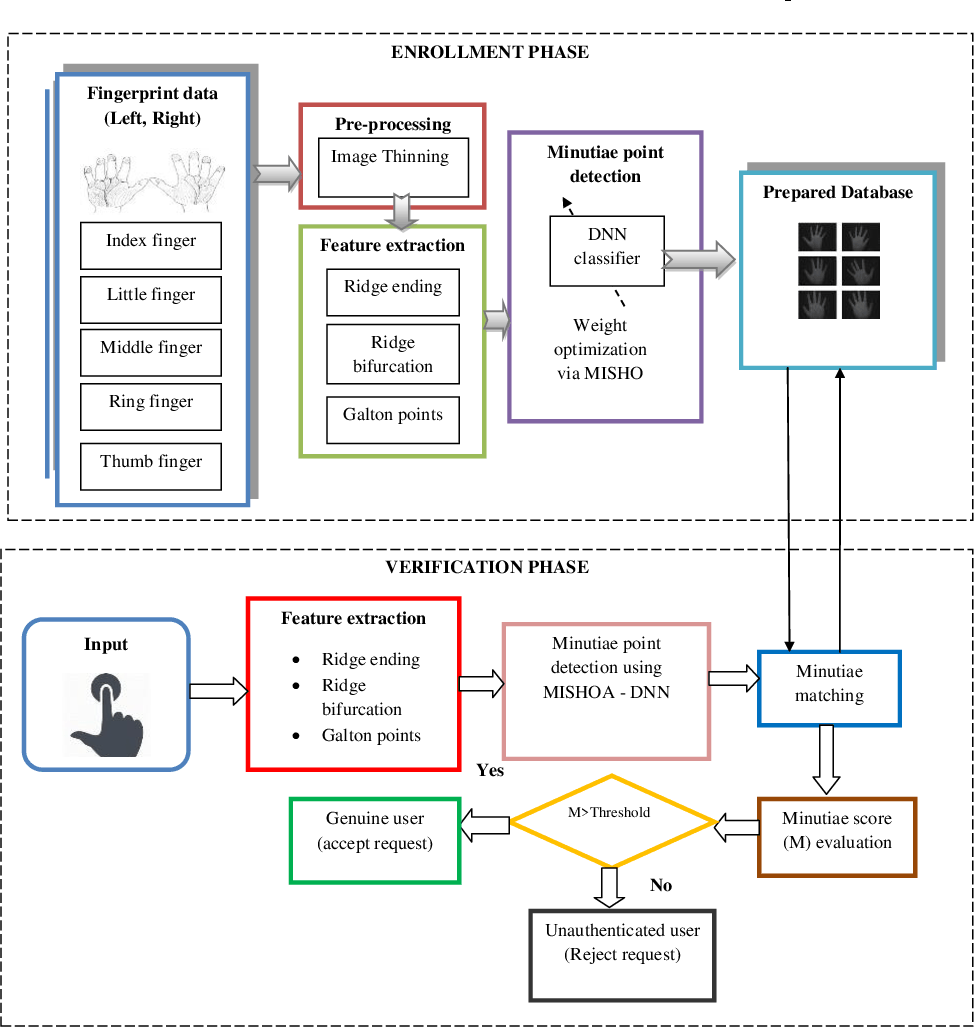
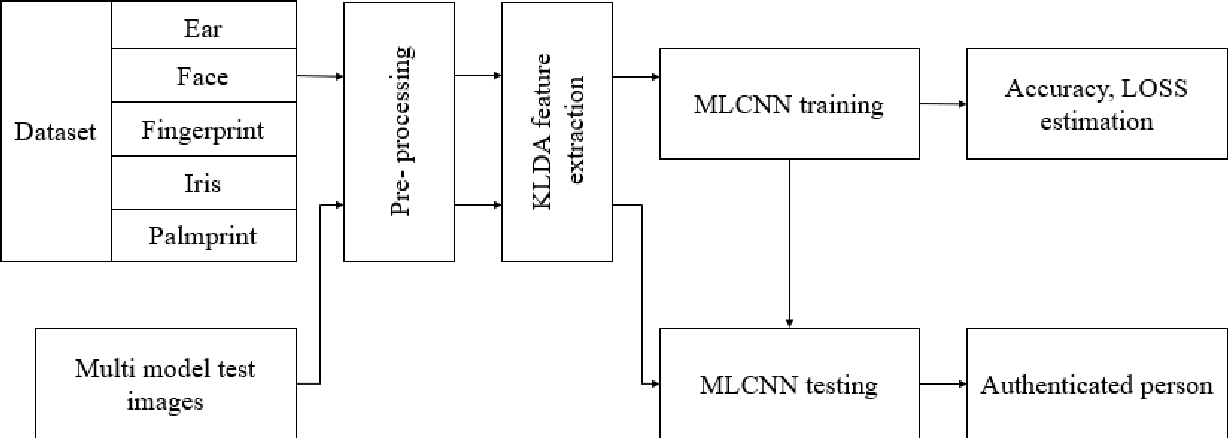
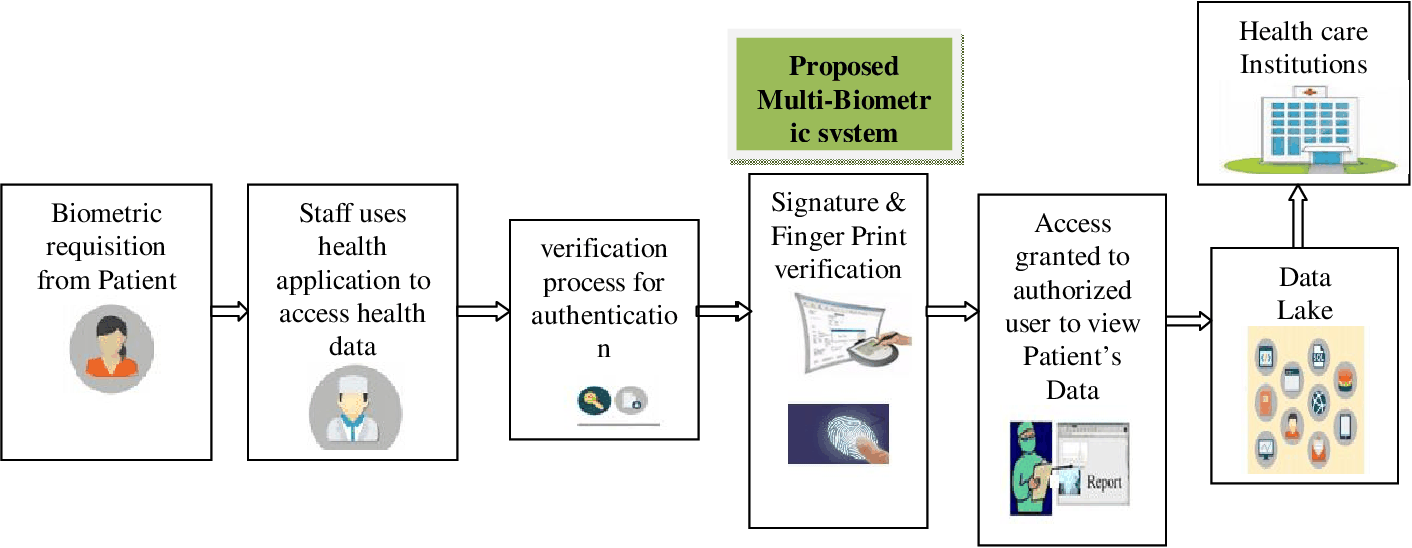
Deep Learning Execution Pipeline
(Preprocessing)
(Feature Extraction)
(Self-Attention)
(Loss Optimization)