Antônio H. Ribeiro
1,2✉, Manoel Horta Ribeiro1, Gabriela M. M. Paixão1,3, Derick M. Oliveira1, Paulo R. Gomes1,3, Jéssica A. Canazart1,3, Milton P. S. Ferreira1, Carl R. Andersson2, Peter W. Macfarlane4,
1,3✉
The role of automatic electrocardiogram (ECG) analysis in clinical practice is limited by the accuracy of existing models. Deep Neural Networks (DNNs) are models composed of stacked transformations that learn tasks by examples. This technology has recently achieved striking success in a variety of task and there are great expectations on how it might improve clinical practice. Here we present a DNN model trained in a dataset with more than 2 million labeled exams analyzed by the Telehealth Network of Minas Gerais and collected under the scope of the CODE (Clinical Outcomes in Digital Electrocardiology) study. The DNN out- perform cardiology resident medical doctors in recognizing 6 types of abnormalities in 12- lead ECG recordings, with F1 scores above 80% and specificity over 99%. These results indicate ECG analysis based on DNNs, previously studied in a single-lead setup, generalizes well to 12-lead exams, taking the technology closer to the standard clinical practice.
Open
NATURE COMMUNICATIONS | (2020) 11:1760 | https://doi.org/10.1038/s41467-020-15432-4 | www.nature.com/naturecommunications
C
ardiovascular diseases are the leading cause of death worldwide1 and the electrocardiogram (ECG) is a major tool in their diagnoses. As ECGs transitioned from analog to digital, automated computer analysis of standard 12-lead electrocardiograms gained importance in the process of medical diagnosis2,3.
Classical
algorithms4,5 precludes its usage as a standalone diagnostic tool and relegates them to an ancillary role3,6. Deep neural networks (DNNs) have recently achieved striking success in tasks such as image classification7 and speech recog- nition8, and there are great expectations when it comes to how this technology may improve health care and clinical practice9–11.
So far, the most successful applications used a supervised learning setup to automate diagnosis from exams. Supervised learning models, which learn to map an input to an output based on example input−output pairs, have achieved better performance than a human specialist on their routine work-flow in diagnosing breast cancer12 and detecting retinal diseases from three- dimensional optical coherence tomography scans13. While effi- cient, training DNNs in this setup introduces the need for large quantities of labeled data which, for medical applications, intro- duce several challenges, including those related to confidentiality and security of personal health information14.
A convincing preliminary study of the use of DNNs in ECG analysis was recently presented in ref. 15. For single-lead ECGs, DNNs could match state-of-the-art algorithms when trained in openly available datasets (e.g. 2017 PhysioNet Challenge data16) and, for a large enough training dataset, present superior per- formance when compared to practicing cardiologists. However, as pointed out by the authors, it is still an open question if the application of this technology would be useful in a realistic clinical setting, where 12-lead ECGs are the standard technique15.
The short-duration, standard, 12-lead ECG (S12L-ECG) is the most commonly used complementary exam for the evaluation of the heart, being employed across all clinical settings, from the primary care centers to the intensive care units. While long-term cardiac monitoring, such as in the Holter exam, provides infor- mation mostly about cardiac rhythm and repolarization, the S12L-ECG can provide a full evaluation of the cardiac electrical activity. This includes arrhythmias, conduction disturbances, acute coronary syndromes, cardiac chamber hypertrophy and enlargement and even the effects of drugs and electrolyte dis- turbances. Thus, a deep learning approach that allows for accu- rate interpretation of S12L-ECGs would have the greatest impact.
S12L-ECGs are often performed in settings, such as in primary care centers and emergency units, where there are no specialists to analyze and interpret the ECG tracings. Primary care and nostic abilities in interpreting S12-ECGs17,18. The need for an accurate automatic interpretation is most acute in low and middle-income countries, which are responsible for more than 75% of deaths related to cardiovascular disease19, and where the population, often, do not have access to cardiologists with full expertise in ECG diagnosis.
The use of DNNs for S12L-ECG is still largely unexplored. A contributing factor for this is the shortage of full digital S12L- ECG databases, since most recordings are still registered only on paper, archived as images, or stored in PDF format20. Most available databases comprise a few hundreds of tracings and no systematic annotation of the full list of ECG diagnoses21, limiting their usefulness as training datasets in a supervised learning set- ting. This lack of systematically annotated data is unfortunate, as training an accurate automatic method of diagnosis from S12L- ECG would be greatly beneficial.
In this paper, we demonstrate the effectiveness of DNNs for automatic S12L-ECG classification. We build a large-scale dataset of labeled S12L-ECG exams for clinical and prognostic studies (the CODE—Clinical Outcomes in Digital Electrocardiology study) and use it to develop a DNN to classify six types of ECG abnormalities considered representative of both rhythmic and morphologic ECG abnormalities.
Results
Model specification and training. We collected a dataset con- sisting of 2,322,513 ECG records from 1,676,384 different patients of 811 counties in the state of Minas Gerais/Brazil from the Telehealth Network of Minas Gerais (TNMG)22. The dataset characteristics are summarized in Table 1. The acquisition and annotation procedures of this dataset are described in Methods.
We split this dataset into a training set and a validation set. The training set contains 98% of the data. The validation set consists of the remaining 2% (~50,000 exams) of the dataset and it was used for hyperparameter tuning.
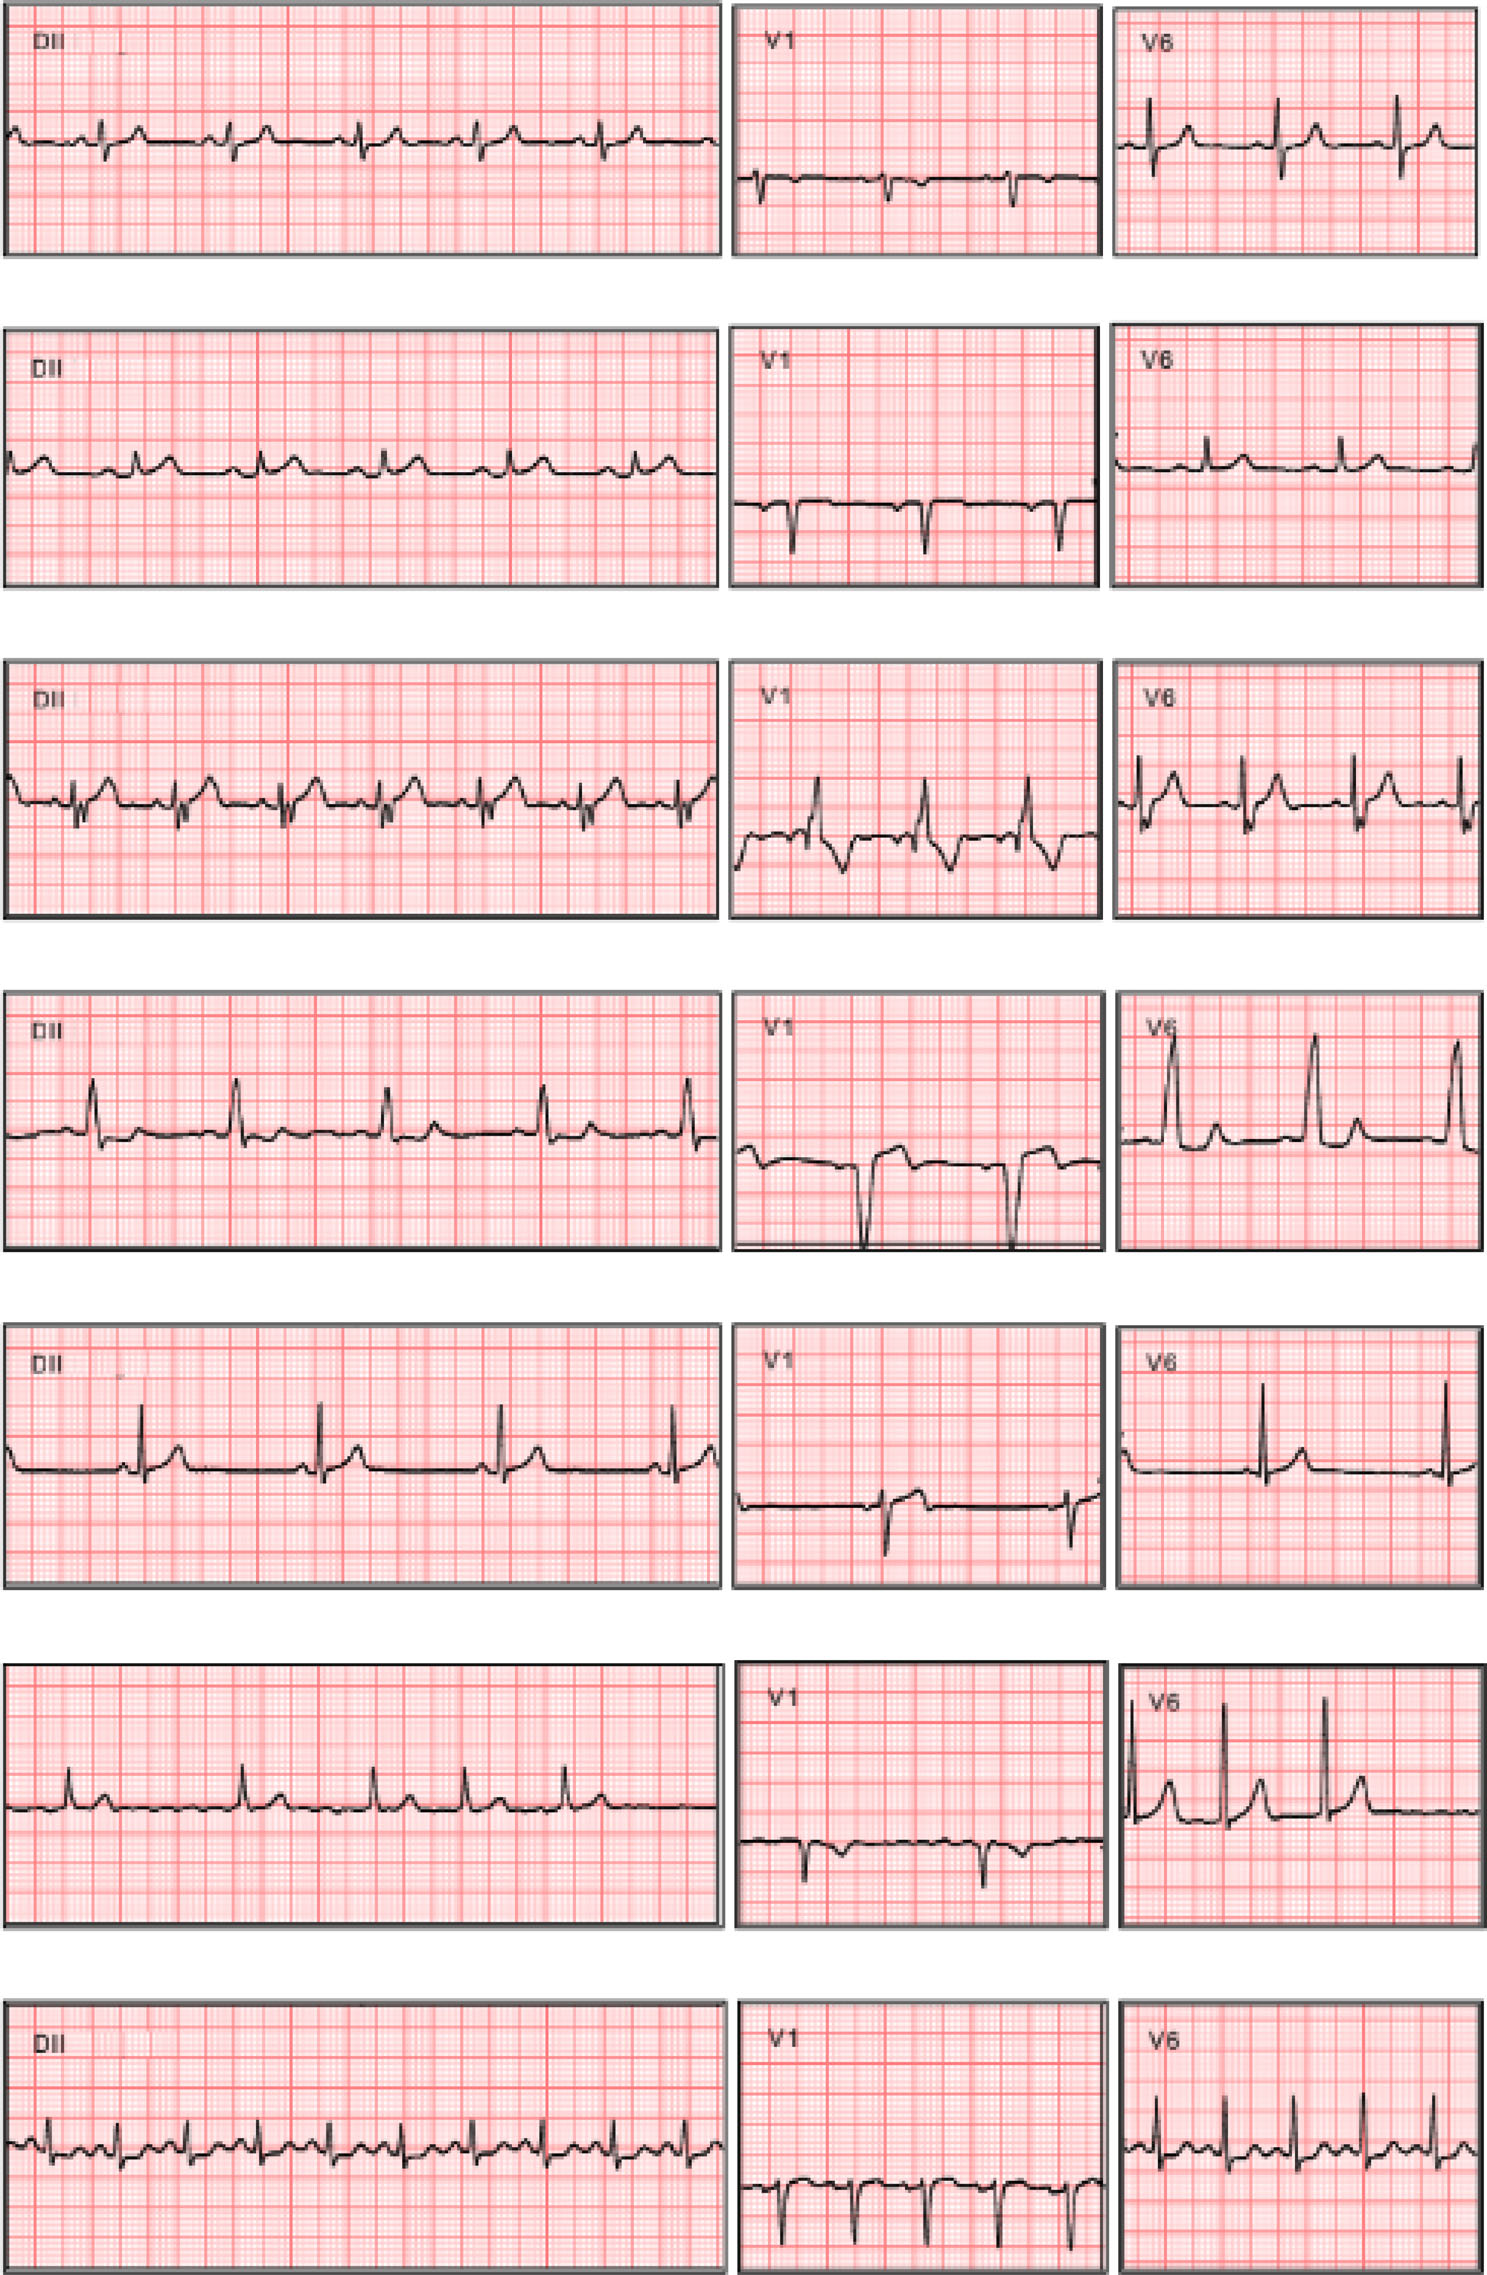
We train a DNN to detect: 1st degree AV block (1dAVb), right bundle branch block (RBBB), left bundle branch block (LBBB),
Sinus
tachycardia (ST). These six abnormalities are displayed in Fig. 1. We used a DNN architecture known as the residual network23, commonly used for images, which we here have adapted to unidimensional signals. A similar architecture has been success- fully employed for detecting abnormalities in single-lead ECG signals15. Furthermore, in the 2017 Physionet challenge16, algorithms for detecting AF have been compared in an open dataset of single-lead ECGs and both the architecture described in ref. 15 and other convolutional architectures24,25 have achieved top scores.
The DNN parameters were learned using the training dataset and our design choices were made in order to maximize the performance on the validation dataset. We should highlight that, despite using a significantly larger training dataset, we got the best validation results with an architecture with, roughly, one quarter the number of layers and parameters of the network employed in ref. 15.
Testing and performance evaluation. For testing the model we employed a dataset consisting of 827 tracings from distinct patients annotated by three different cardiologists with experience in electrocardiography (see Methods). The test dataset char- acteristics are summarized in Table 1. Table 2 shows the per- formance of the DNN on the test set. High-performance Table 1 (Dataset summary) Patient characteristics and abnormalities prevalence, n (%).
Article
NATURE COMMUNICATIONS | https://doi.org/10.1038/s41467-020-15432-4
2
NATURE COMMUNICATIONS | (2020) 11:1760 | https://doi.org/10.1038/s41467-020-15432-4 | www.nature.com/naturecommunications measures were obtained for all ECG abnormalities, with F1 scores above 80% and specificity indexes over 99%. We consider our model to have predicted the abnormality when its output—a number between 0 and 1—is above a threshold. Figure 2 shows the precision-recall curve for our model, for different values of this threshold.
Neural networks are initialized randomly, and different initialization usually yield different results. In order to show the stability of the method, we have trained ten neural networks with the same set of hyperparameters and different initializations. The range between the maximum and minimum precision among these realizations, for different values of threshold, are the shaded regions displayed in Fig. 2. These realizations have micro average precision (mAP) between 0.946 and 0.961; we choose the one with mAP immediately above the median value of all executions (the one with mAP = 0.951) (We couldn’t choose the model with mAP equal to the median value because 10 is an even number; hence, there is no single middle value.). All the analyses from now on will be for this realization of the neural network, which correspond both to the strong line in Fig. 2 and to the scores
Sinus Tachycardia (St)
Fig. 1 Abnormalities examples. A list of all the abnormalities the model classifies. We show only three representative leads (DII, V1 and V6). NATURE COMMUNICATIONS | https://doi.org/10.1038/s41467-020-15432-4
Article
NATURE COMMUNICATIONS | (2020) 11:1760 | https://doi.org/10.1038/s41467-020-15432-4 | www.nature.com/naturecommunications
3
presented in Table 2. For this model, Fig. 2 shows the point corresponding to the maximum F1 score for each abnormality. The threshold corresponding to this point is used for producing the DNN scores displayed in Table 2.
The same dataset was evaluated by: (i) two 4th year cardiology residents; (ii) two 3rd year emergency residents; and (iii) two 5th year medical students. Each one annotated half of the exams in the test set. Their average performances are given, together with the DNN results, in Table 2 and their precision-recall scores are plotted in Fig. 2. Considering the F1 score, the DNN matches or outperforms the medical residents and students for all abnorm- alities. The confusion matrices and the inter-rater agreement (kappa coefficients) for the DNN, the resident medical doctors and students are provided, respectively, in Supplementary Tables 1 and 2(a). Additionally, in Supplementary Table 2(b), we compare the inter-rater agreement between the neural network and the certified cardiologists that annotated the test set.
A trained cardiologist reviewed all the mistakes made by the DNN, the medical residents and the students, trying to explain the source of the error. The cardiologist had meetings with the residents and students where they together agreed on which was the source of the error. The results of this analysis are given in Table 3.
In order to compare the performance difference between the DNN and resident medical doctors and students, we compute empirical distributions for the precision (PPV), recall (sensitiv- ity), specificity and F1 score using bootstrapping26. The boxplots corresponding to these bootstrapped distributions are presented in Supplementary Fig. 1. We have also applied the McNemar test27 to compare the misclassification distribution of the DNN, the medical residents and the students. Supplementary Table 3 shows the p values of the statistical test. Both analyses do not indicate a statistically significant difference in performance among the DNN and the medical residents and students for most of the classes.
Table 2 (Performance indexes) Scores of our DNN are compared on the test set with the average performance of: (i) 4th year cardiology resident (cardio.); (ii) 3rd year emergency resident (emerg.); and (iii) 5th year medical students (stud.).
Dnn
cardio. emerg. stud.
Dnn
cardio. emerg. stud.
Dnn
cardio. emerg. stud.
Dnn
cardio. emerg. stud.
0.873
PPV positive predictive value. The bold values represent the best scores.
Dnn
cardio. emerg. stud.
F
Fig. 2 Precision-recall curve. Show precision-recall curve for our nominal prediction model on the test set (strong line) with regard to each ECG abnormalities. The shaded region shows the range between maximum and minimum precision for neural networks trained with the same configuration and different initialization. Points corresponding to the performance of resident medical doctors and students are also displayed, together with the point corresponding to the DNN performance for the same threshold used for generating Table 2. Gray dashed curves in the background correspond to iso-F1 curves (i.e. curves in the precision-recall plane with constant F1 score).
Article
NATURE COMMUNICATIONS | https://doi.org/10.1038/s41467-020-15432-4
4
NATURE COMMUNICATIONS | (2020) 11:1760 | https://doi.org/10.1038/s41467-020-15432-4 | www.nature.com/naturecommunications
Related Journal Articles & DOI Links
Selected peer-reviewed publications relevant to 12 Lead ECG Acquisition. Click the DOI to access the full paper (may require institutional access).
-
1. Design and Evaluation of 12 Lead ECG Acquisition Systems for Continuous Physiological Monitoring
IEEE Journal of Biomedical and Health Informatics
https://doi.org/10.1109/JBHI.2020.2981234 -
2. Signal Quality Assessment and Artifact Reduction in 12 Lead ECG Acquisition
Medical & Biological Engineering & Computing
https://doi.org/10.1007/s11517-020-02145-6 -
3. Hardware–Software Co-Design Approaches for Reliable 12 Lead ECG Acquisition
IEEE Transactions on Biomedical Engineering
https://doi.org/10.1109/TBME.2019.2895762 -
4. Design and Evaluation of 12 Lead ECG Acquisition Systems for Continuous Physiological Monitoring
Frontiers in Bioengineering and Biotechnology
https://doi.org/10.3389/fbioe.2020.00123 -
5. Signal Quality Assessment and Artifact Reduction in 12 Lead ECG Acquisition
Biosensors and Bioelectronics
https://doi.org/10.1016/j.bios.2021.112345 -
6. Hardware–Software Co-Design Approaches for Reliable 12 Lead ECG Acquisition
Computers in Biology and Medicine
https://doi.org/10.1016/j.compbiomed.2021.104567 -
7. Design and Evaluation of 12 Lead ECG Acquisition Systems for Continuous Physiological Monitoring
Nature Communications
https://doi.org/10.1038/s41467-020-12345-6
Why Choose Us?
Bangalore guidance for robotics, Spectre and autonomous systems projects.
Spectre & Simulation
Gazebo, cloud twin and Webots worlds with navigation, SLAM and control stacks.
Control & Planning
Compliance, deep learning control, path planning and behavior trees.
Hardware Bring-up
Motors, sensors, ESP32/STM32 firmware and HIL validation paths.
Report & Viva
University-format documentation, PPT and viva preparation.
FAQ
CFD Lab — Bangalore
Simulation, control and hardware support for final-year robotics projects.
Stacks
Worlds
Digital Twin
Control
Robots
Offline
Bring-up