Abstract
The automatic, sensor-based assessment of challenging behavior of persons with dementia is an important task to support the selection of interventions. However, predicting behaviors like apathy and agitation is challenging due to the large inter- and intra-patient variability. Goal of this paper is to improve the recognition performance by making use of the observation that patients tend to show specific behaviors at certain times of the day or week. We propose to identify such segments of similar behavior via clustering the distributions of annotations of the time segments. All time segments within a cluster then consist of similar behaviors and thus indicate a behavioral predisposition (BPD).
We utilize BPDs by training a classifier for each BPD. Empirically, we demonstrate that when the BPD per time segment is known, activity recognition performance can be substantially improved. Keywords Human activity recognition · Wearable sensors · Machine learning · Clustering
Introduction
The recognition of human behavior is important for many domains, like sports, the analysis of manual work processes, or as a component for situation-aware assistants. As another example, sensor-based Human Activity Recognition (HAR) can also be used for the automatic assessment of behavioral symptoms of people with dementia, like apathy or agitation.
In contrast to questionnaires like the Cohen-Mansfield Agitation Inventory , HAR allows the real-time, objective assessment of symptoms, supporting caregivers in selecting appropriate interventions. However, accurate HAR is challenging due to the high inter- and intra-subject variability of movement. Specifically, the automatic recognition of challenging behavior from wearable sensor data has been of limited success so far .
Multiple approaches have been proposed to improve HAR accuracy, by making use of additional external knowledge [3, 4, 5, 6, 7, 8]. In this paper, we investigate how HAR performance can be improved by making use of the fact that there is a tendency of specific subjects to show specific behaviors at certain times of the day or week. For example, sundowning is the increase in restlessness of some people with dementia in the evening . The knowledge of such behavioral predispositions (BPDs) could serve as a useful prior to increase HAR accuracy.
Previous work relied on external knowledge to define BPDs. For example, Lüdtke et al. partitioned warehouse order picking into distinct process steps, the knowledge of which can inform HAR. However, in the context of dementia care, there are no established BPDs that are externally given. The contribution of this paper is to identify such BPDs in a data-driven way: We calculate the distribution of annotations in time segments of a day, and then cluster these histograms. This results in clusters of time frames in which the subjects behaved similarly. Each cluster forms a BPD.
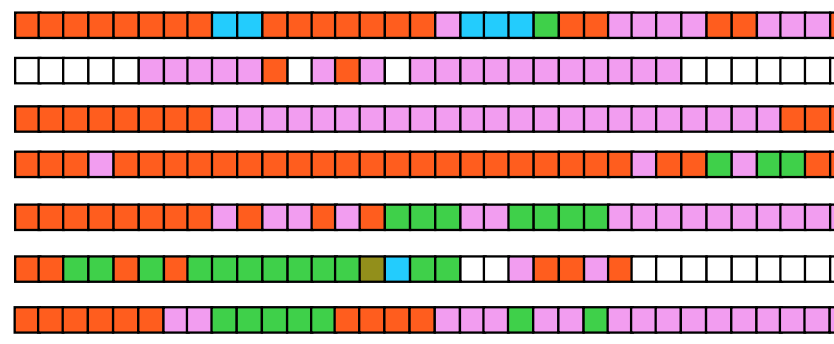
Given the BPD, we then train a classifier specifically for data recorded within the BPD, i.e., there is one classifier for each cluster. This classifier is thus biased towards the more frequent classes in the BPD. An overview of this process can be found in figure 1. In summary, this paper provides the following contributions:
Arxiv:2207.08816V1 [Cs.Lg] 18 Jul 2022
Discovering Behavioral Predispositions in Data to Improve Human Activity Recognition
Predicted Behavior
Figure 1: Overview of the concept. We calculate the distribution of annotations for a given segment of the day (histograms). We then cluster these distributions. Next, we use the cluster label (BPD) to select the classifier (color indicates the corresponding classifier). The classifier predicts the behavior from the features of the motion sensor data.
• A clustering-based method for the data-driven construction of behavioral predispositions (BPDs)
• An Approach For Utilizing These Bpds In Har
• An evaluation of this approach for the sensor-based recognition of behavioral symptom of persons with
Dementia
Empirically, our approach leads to a substantial increase of HAR performance, when assuming that the BPD for each time segment is given.
Data And Observations
This section presents the insideDem framework, as well as the data set. We make observations about the distribution of annotations given time frames, which will then lead to the construction of the BPDs and the utilization of them in the methodology section 3.
Insidedem Project
Part of the insideDem framework was the recording of the behaviours of dementia diagnozed patients . In two nursing homes, real-time observations and sensor data of a total of 17 residents (11 women and 6 men) with moderate to severe dementia were recorded. The behaviour of persons in one nursing home was also recorded on video. The age range was 73 to 94 years. All persons were under psycho-pharmacological treatment. Dementia medication was taken by 8 residents of the nursing homes. The behaviour of the persons was recorded in real time by an expert in the sitting room of the nursing home. This room was accessible to all residents and their visitors as well as the staff of the nursing home. The behaviour was annotated every five minutes following the annotation scheme which was developed for the insideDem project. This scheme is based on the neuropsychiatric inventory and the Cohens-Mansfield agitation inventory . It consists of seven different behaviours: apathy, general restlessness, mannerisms, pacing, aggression, trying to get to a different place, normal behaviour.
During the day, between 8 a.m. and 6 p.m., the subjects wore two wristbands, which were attached to the dominant hand and the ankle. During the night, a band was worn on the ankle. The sensors recorded accelerations and rotations as well as the sound level of the environment, the light conditions and the sound pressure. In this work, we only use the acceleration sensor data.
Observations
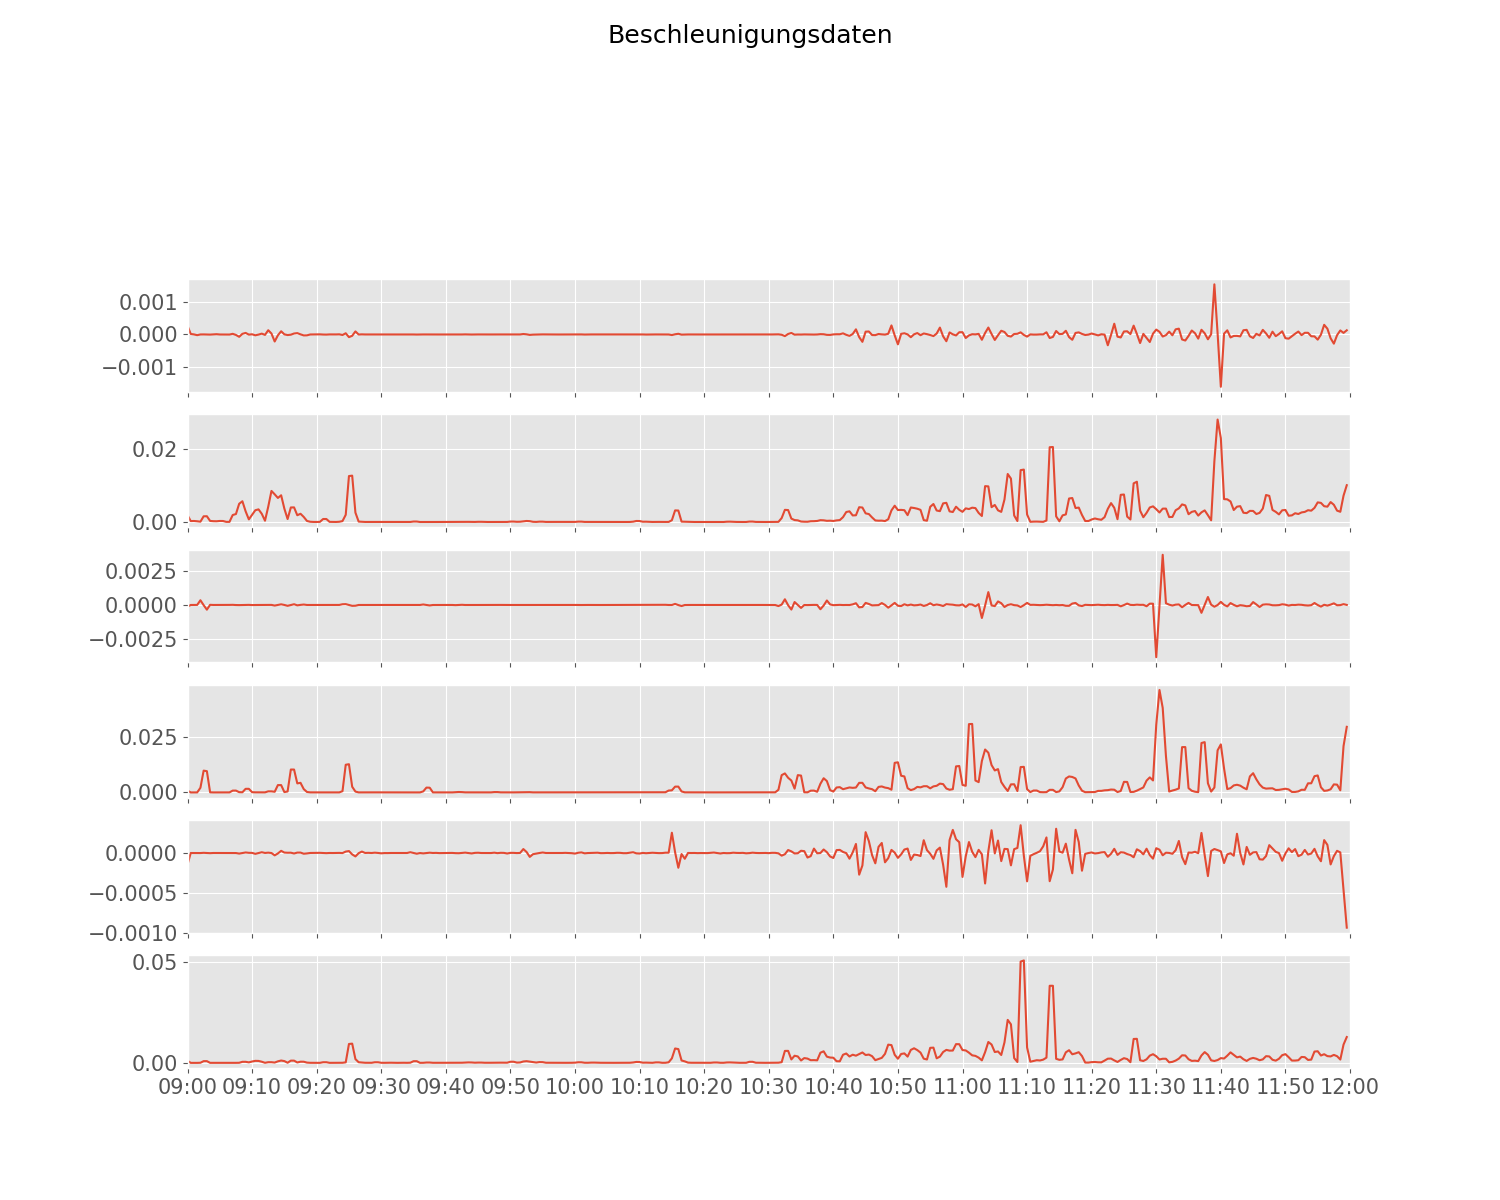
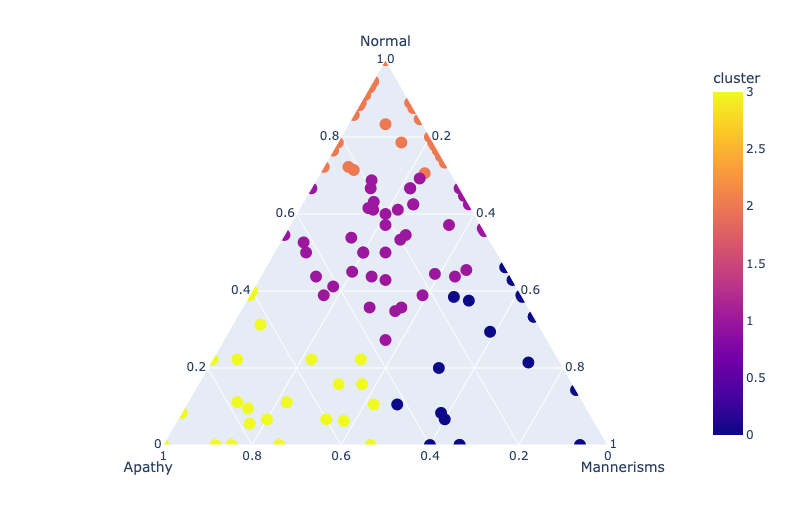
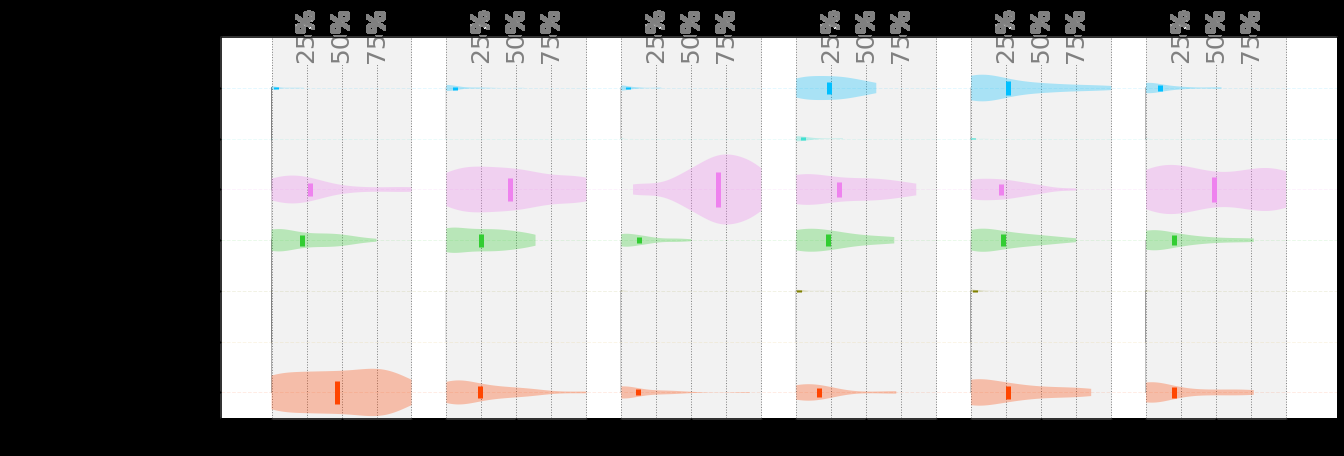
Figure 2 shows the distribution of annotations for each subject. The behaviour of the eight patients were observed over the course of 29 days and accumulate around 17,000 annotated five-minute intervals. For every subject the the behaviours occur in different portions. As example, the patient X111 showed 9% apathy where as X126 showed nearly 50% apathy during the time span of 29 days. However, for X111, pacing was mostly annotated but X126 nearly showed no pacing.
In the literature events for triggering agitated behaviors were observed. The sunset phenomenon as described in may be such a trigger for one BPD. At sunset people with dementia often show more agitated behavior than at other times of
2
Discovering Behavioral Predispositions in Data to Improve Human Activity Recognition
Normal
Figure 2: Distribution of annotations per person over all days of recordings. the day. Also, the fact of boredom can trigger agitated behavior. If there is nothing planned for an afternoon, dementia diagnosed persons might show agitated behavior because of the boredom . As a result, it is reasonable to look into noticeable time frames of the day which show one person behaving agitated more often.
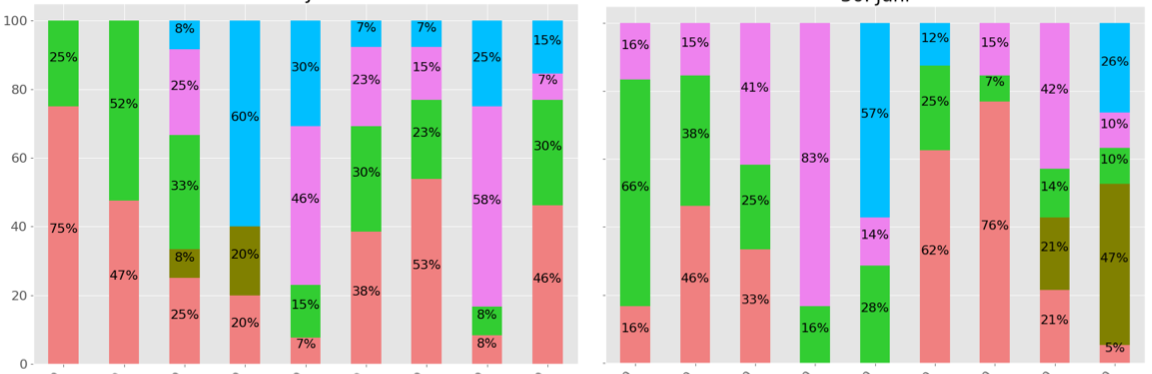
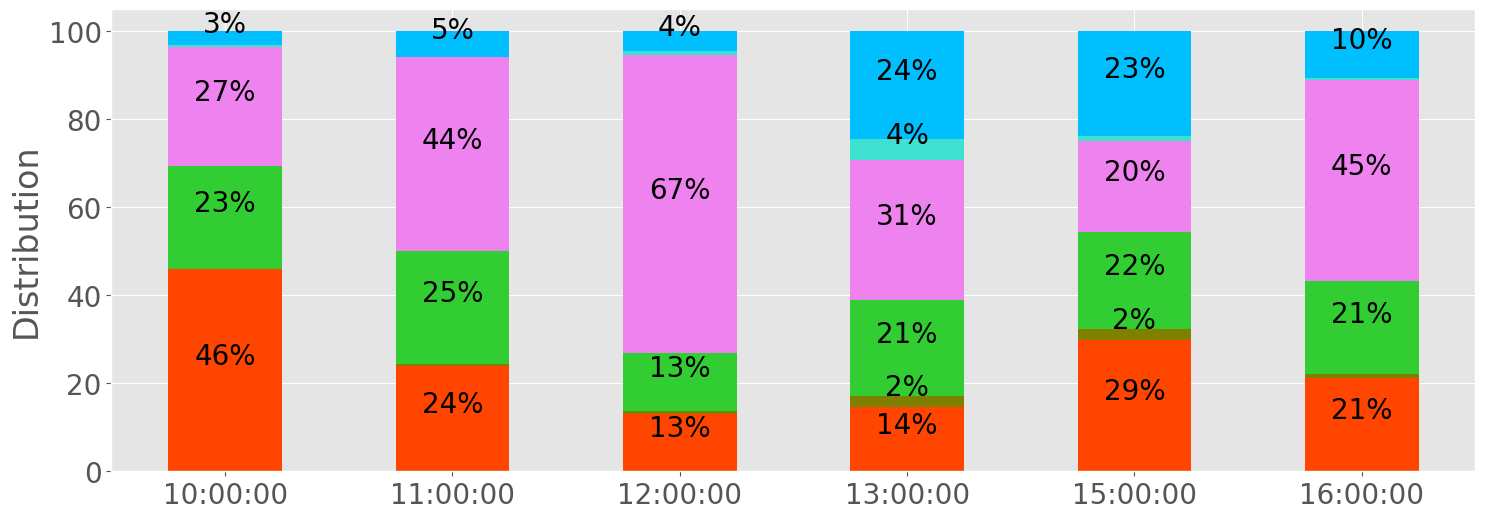
The figure 3 (a) now shows the average occurrences of the annotations for one-hour segments of the day. The represented subject behaves in the morning more apathetic than in the later course of the day. Also at noon, the patient shows more normal behavior. Pacing is mostly happening in the afternoon. Figure 3 (b) shows the variances of the annotations between each day. This plot represents the distribution of the proportion each behavior has on the time segment every day. Between 10 and 11 a.m. we saw the patient behaves apathetically to 46% in plot (a). However, in plot (b) we see that the apathy part can differ from 0% to 100% with equal probability from day to day.
Methods
Behavioural predispositions (BPD) describe the tendency to show specific behaviours. In this section, we propose a method to form such BPDs from the annotations of behaviors. In the following, we present a simple model that can use these newly found BPDs to simplify the classification.
Extracting Behavioural Predispositions
BPD describe the urge to show specific kinds of behaviors. Knowing such would intuitively mean that the prediction of the current actual behavior becomes easier since it provides an informative prior on the behavior of the subject. Unfortunately an expert model describing BPD for patients with dementia does not exist and thus the aim is to derive them from the data of the insideDem project.
Time-Based Bpd
Following the observations of figure 3 (a), one can argue to use a similar approach to or define that every BPD is one segment of the day. This means from 10 to 11 a.m. the subject always behaves similarly and by knowing the current time, we can use this information to improve the classification. However, this approach has the drawback of high variances of the annotations between each day which lead to BPDs that do not carry a lot of information about the actual behavior.
Clustering-Based Bpd
To overcome the problem of high variances, we propose to find similar distributions globally over all days and time segments instead of grouping them by the time of the day. Let p(At) be the probability distribution of the annotation for the day and time segment t. Note that t describes a specific time frame e.g. 06–15 10:00 to 06–15 11:00. This categorical distribution can be obtained by counting the relative frequencies of the annotations in the segment. This
3
Discovering Behavioral Predispositions in Data to Improve Human Activity Recognition
(B) Distribution Of Annotation In Time Segment
Figure 3: Percentual distribution of annotations for one subject and one-hour intervals of the day. (a) shows the average of the annotation and (b) describes the distribution (variance). counted distribution is called a histogram. The BPD represents the tendency to behave in a certain way. Given a set of histograms, the task is to divide this set into groups. These groups should contain similar histograms. With the help of the k-means clustering algorithm, clusters of histograms can be generated which are grouped according to their spatial similarity (Euclidean distance). Each of these clusters describes a behavioral disposition. The histograms of the cluster D = d therefore represent the distribution p(A | D = d).
Classification Of Sensor Data
In the scope of this work, we want to show what impact the complete knowledge of the clustered BPD can have on the classification. Therefore, we assume the BPD, i.e. the cluster, as given. Note that this would not be the case in a real world environment. Given a BPD d, we then have a prior knowledge of the annotation p(A | d). To make use of this knowledge, we train a different classifier for each BPD. Thus, each classifier is trained with biased data and is therefore biased to more likely predict the classes that are most presently in this BPD. The classifier can be seen as expert for its BPD. The model m maps sensor data s and the BPD d to an annotation a by choosing the classifier cd that was specifically trained for d. The classifier then maps s to a: m(s, d) = cd(s) = a .
Experimental Evaluation
The overall goal of the experiments are the evaluation of the impact of the BPD on the HAR performance. In the following, we describe the experimental design in more detail.
Experimental Design
To evaluate the impact of the knowledge of the BPDs on HAR performance, we use a factorial design. The factors and levels are presented in table 1. For each subject, a model with a different clustering method, number of clusters (i.e. BPDs), segment length, and classifier is trained. We randomly select 70% of the data for training and 30% for testing
4
Discovering Behavioral Predispositions in Data to Improve Human Activity Recognition Table 1: Factors and levels of the experimental design
One Model For Each Subject
the model. Every combination of the levels is evaluated 10 times. Different clusters and segment lengths are used to test the expressiveness of the BPD. The segment length plays an important role for the k-means clustering strategy as the length is used to define the size over which the histogram is calculated and then clustered. At a segment length of 30 minutes, we obtain around 400 histograms per subject. We then cluster the histograms of a single subject, resulting in BPDs specifically for this subject. High number of clusters and small segment lengths yield finer BPDs. Note that one cluster means we have no further information about the BPD and thus gives us a baseline of performance. The time-based clustering method describes that a BPD only depends on the time. E.g., having 10 clusters and time-based clustering this method would split the day into 10 parts and for every part, one classifier is trained. We use three different methods for classifying the sensor data. The majority method functions as a baseline by always outputting the most frequent annotation of the BPD. The naive Bayes (NB) method shows the performance of a simplistic classifier.
The NB uses for every BPD a different prior and observation model. Thirdly, a support vector machine (SVM) is trained. For preprocessing the accelerator data, features were calculated following the work of . The original data is sampled in 50 Hz. Feature were calculated over a window size of one minute and an overlap of 50%. Statistical features, spatial relations between the three axis and frequency features were used. As measure of accuracy, we use F1 score.
Results And Discussion
Figure 4 shows the average F1 scores for each classifier and the strategies used for generating the BPDs. Firstly, we want to investigate only the k-means approach. The SVM shows an increase of F1 score up to a number of about 10 clusters. From this point on, only smaller segment sizes benefit. For the majority classifier, the F1 score no longer increases significantly above a number of 6 clusters. The naive Bayes classifier shows a nearly linear increase. Thus, for all classifiers, the F1 measure increases with a larger number of clusters, as well as a decreasing segment length. The fact that the majority classifier benefits from this approach comes as no surprise. With an increasing number of clusters and finer segment lengths, the most frequent annotation occupies a higher portion of data within the cluster. Predicting only the most frequent annotation yields an F1 score of around 0.1 whereas dividing the data by the BPD yields a score of around 0.5 at 20 BPDs and a segment length of 30 minutes. Note that some BPDs only describe one annotation and thus predicting can achieve 100% accuracy by always outputting that one same class. According to this observation, the classification task should become simpler. Given such BPD with only one class, all classifiers used here can benefit and improve with knowledge of the BPD. However, the F1 score of the majority classifier proposes that the knowledge of the most frequent annotation in the training data does not give us further advantages when we have more than 6 clusters.
Yet the F1 score of the naive Bayes classifier increases nearly linearly. Also, the SVM has a still increasing F1 score at 20 BPDs, which underlines the fact that knowing the BPD simplifies the classification task by reducing the complexity of possible behaviors or even ruling them out. Note that the knowledge presented by the BPD converges with the BPD describing the exact underlying histogram, i.e. we have the same number of BPDs (clusters) as histograms.
We now investigate the time-based approach. The time-based approach shows an increase of F1 score as the number of clusters rises. This can be observed for every classifier evaluated. Although the increase is not high, the knowledge of the clock time can help the classification. Thus dividing the day into segments and training a classifier for every segment each, increases the F1 score. Comparing this approach with the k-means approach can be done by comparing the points where the number of BPDs and the segment length are approximately equal for both. E.g. splitting the day, where the subjects were recorded, into 20 segments yields a segment length of around 30 minutes and 20 BPDs. These points are denoted with rectangles in figure 4. The plot yields a better performance of the k-means approach for all 4 points. The inferiority of the time-based approach can be explained through the high variances of annotations among the days (shown in figure 3). The k-means approach, on the other hand, describes the histograms by their similarity and thus achieving less variance within the cluster. Having less variance means that the classifier has an easier task to solve.
Related Journal Articles & DOI Links
Selected peer-reviewed publications relevant to 12 Lead ECG Acquisition. Click the DOI to access the full paper (may require institutional access).
-
1. Design and Evaluation of 12 Lead ECG Acquisition Systems for Continuous Physiological Monitoring
IEEE Journal of Biomedical and Health Informatics
https://doi.org/10.1109/JBHI.2020.2981234 -
2. Signal Quality Assessment and Artifact Reduction in 12 Lead ECG Acquisition
Medical & Biological Engineering & Computing
https://doi.org/10.1007/s11517-020-02145-6 -
3. Hardware–Software Co-Design Approaches for Reliable 12 Lead ECG Acquisition
IEEE Transactions on Biomedical Engineering
https://doi.org/10.1109/TBME.2019.2895762 -
4. Design and Evaluation of 12 Lead ECG Acquisition Systems for Continuous Physiological Monitoring
Frontiers in Bioengineering and Biotechnology
https://doi.org/10.3389/fbioe.2020.00123 -
5. Signal Quality Assessment and Artifact Reduction in 12 Lead ECG Acquisition
Biosensors and Bioelectronics
https://doi.org/10.1016/j.bios.2021.112345 -
6. Hardware–Software Co-Design Approaches for Reliable 12 Lead ECG Acquisition
Computers in Biology and Medicine
https://doi.org/10.1016/j.compbiomed.2021.104567 -
7. Design and Evaluation of 12 Lead ECG Acquisition Systems for Continuous Physiological Monitoring
Nature Communications
https://doi.org/10.1038/s41467-020-12345-6
Why Choose Us?
Bangalore guidance for robotics, Spectre and autonomous systems projects.
Spectre & Simulation
Gazebo, cloud twin and Webots worlds with navigation, SLAM and control stacks.
Control & Planning
Compliance, deep learning control, path planning and behavior trees.
Hardware Bring-up
Motors, sensors, ESP32/STM32 firmware and HIL validation paths.
Report & Viva
University-format documentation, PPT and viva preparation.
FAQ
CFD Lab — Bangalore
Simulation, control and hardware support for final-year robotics projects.
Stacks
Worlds
Digital Twin
Control
Robots
Offline
Bring-up