In-Ear SpO2 for Classification of Cognitive Workload Harry J. Davies, Ian Williams, Ghena Hammour, Metin Yarici, Barry M. Seemungal and Danilo P. Mandic Abstract—Classification of cognitive workload promises im- mense benefit in diverse areas ranging from driver safety to augmenting human capability through closed loop brain com- puter interface. The brain is the most metabolically active organ in the body and increases its metabolic activity and thus oxygen consumption with increasing cognitive demand. In this study, we explore the feasibility of in-ear SpO2 cognitive workload tracking. To this end, we preform cognitive workload assessment in 8 subjects, based on an N-back task, whereby the subjects are asked to count and remember the number of odd numbers displayed on a screen in 5 second windows. The 2 and 3-back tasks lead to either the lowest median absolute SpO2 or largest median decrease in SpO2 in all of the subjects, indicating a robust and measurable decrease in blood oxygen in response to increased cognitive workload. Using features derived from in-ear pulse oximetry, including SpO2, pulse rate and respiration rate, we were able to classify the 4 N-back task categories, over 5 second epochs, with a mean accuracy of 94.2%. Moreover, out of 21 total features, the 9 most important features for classification accuracy were all SpO2 related features. The findings suggest that in-ear SpO2 measurements provide valuable information for classification of cognitive workload over short time windows, which together with the small form factor promises a new avenue for real time cognitive workload tracking.
C
OGNITIVE workload is defined as a the level of mental effort undertaken by an individual in response to a task. The mental effort is usually related to working memory, and thus corresponds to the utilisation of brain resources .
Cognitive workload affects almost every task-related aspect of our daily lives, from general learning to driving to in- ternet browsing. The ability to accurately measure cognitive load would lead to manifold benefits, as too little cognitive workload leaves us vulnerable to distraction, whereas too much cognitive workload makes us prone to making mistakes.
Depending on the task a person is engaged in, these mistakes can be more benign, such as less efficient studying, through to life threatening ones as is the case with driving and the possibility of fatal accidents. The ability to accurately measure and predict cognitive workload would therefore make possi- ble personalised task adaptation together with the associated benefits on an individual and a societal level, from increasing productivity to decreasing the likelihood of mistakes.
A. Cognitive Workload Tracking
It is natural to attempt to track cognitive workload based on scalp electroencephalography (EEG), with examples including the classification of skilled vs bad driver performance and the prediction of performance in working memory tasks .
However, while scalp EEG has proven effective at discerning the relevant brain activity changes that arise from changes in cognitive workload, it is obtrusive and thus impractical for daily life applications, while discrete and non-stigmatising wearable solutions are still being developed, such as Hearables and ear-EEG .
In recent years, eye gaze tracking has become a useful tool for tracking cognitive workload, with the ability to classify cognitive workload in real time in driving simulators , as well as predicting correctness in an N-back task whilst in a driving simulator . The ways to measure gaze and pupil dilation inevitably involve cameras; these are generally fixed and positioned to track the face and eyes. Such a gaze tracking apparatus is not wearable either, and is thus only applicable in scenarios such as driving or flying, where the camera can be mounted within the cockpit.
Other sensing modalities relevant for the estimation of cognitive load include electrocardiography (ECG) and pho- toplethsmography (PPG) and the use of the corresponding heart rate metrics to classify cognitive workload in a range of scenarios, including driving whilst performing an N-back memory task , taking maths tests of varying difficulty and when engaging in a partially automated task with a machine based component . Whilst ECG and PPG are less obtrusive than EEG or gaze tracking in daily life and do offer a wearable solution to cognitive workload tracking, it remains unclear whether the documented increases in heart rate are associated with the stress of performing well during
Higher Cognitive Workload Tasks , Or Indeed The
increased cognitive workload itself. Namely, heart rate is known to correlate strongly with stress level whilst driving, as well as skin conductivity (sweat level) . For the purpose of exclusively measuring cognitive workload, it is therefore important to consider tasks whereby the aspect of stress that a maths test or driving may cause is negligible, whilst still maintaining the ability to vary cognitive workload.
B. The Brain, Oxygen And Cognitive Workload
The brain is the most metabolically active organ in the human body. At rest, the brain consumes 20% of the body’s oxygen and this percentage increases with increased cognitive demand. Oxygen restriction has significant effects on cognitive function; for example, less oxygen delivery to the brain has been observed in those with memory impair- ments . Moreover, oxygen administration, through the breathing of supplemental oxygen and the associated increase in blood oxygen, has been shown to result in significantly
Better Memory Performance And Reaction Times
. Functional near infrared spectroscopy (fNIRS), a tool for measuring oxygenation of tissue and thus oxygen consump- tion, has shown increases in oxygen consumption of the brain with an increase in cognitive workload in drivers . Fur- thermore, fNIRS has helped to detect increased oxygenation
Arxiv:2101.00647V1 [Eess.Sp] 3 Jan 2021
of specific brain regions (such as the left inferior frontal gyrus, involved in language processing) with an increase in the difficulty of a letter based N-back memory task in pilots . This motivates us to investigate whether these changes in oxygen consumption are also observable in spectral analysis of blood, or manifest themselves through increases in breathing rate or breathing magnitude.
C. In-Ear Spo2
The notion of blood oxygen saturation refers to the pro- portion of haemoglobin binding sites (four for each molecule) that are occupied with oxygen, out of the total number of haemoglobin binding sites available in the blood, and is
(1)
where the symbol Hb refers to haemoglobin not bound with oxygen and HbO2 to haemoglobin bound to oxygen. Arterial blood oxygen saturation is typically estimated using pulse oximetry to yield a percentage value (SpO2), with sub- jects that have a healthy respiratory system typically exhibiting SpO2 values of 96-98% at sea level . Photoplethysmogra- phy (PPG) is the non-invasive measurement of light absorption through the blood. PPG effectively measures the pulse, as with more blood present, less light is reflected, which yields a pulsatile increase in blood volume with each heart beat.
Pulse oximetry uses PPG simultaneously at different wave- lengths of light (red and infrared) to estimate blood oxygen levels. The level of blood oxygen saturation is mirrored in a change in the ratio of light absorbance between the red and infrared light. The extinction coefficient of oxygenated haemoglobin with red light (≈660nm) is lower than that of deoxygenated haemoglobin, and the reverse holds for infrared light (≈880 −940nm) . The simultaneous measurement of the absorbance/reflectance of both infrared and red light therefore allows for an estimation of blood oxygen saturation.
Pulse oximetry can be measured at most skin sites, but for convenience it is usually measured from the finger. On the other hand, enthusiasm for wearable eHealth technology and Hearables has promoted the ear canal as a preferred site for the measurement of vital signs, given its proximity to the brain (ear-EEG ) and the comparatively stable position of the head with respect to vital signs during daily life, in stark contrast with currently used sites such as the wrist.
In-ear pulse oximetry offers significant benefits over con- ventional finger pulse oximetry. Firstly, the in-ear location is robust to changes in blood volume which occur during vasoconstriction and hypothermia, giving a stable and accurate photoplethysmogram during cold exposure . Next, it has been documented that in-ear PPG exhibits larger amplitude variations due to inspiration and expiration, allowing for a improved measurement of respiration rate . Also, a sig- nificant delay has been evidenced between ear pulse oximetry and pulse oximetry on the right index finger and on the hand/foot for detection of hypoxemia (low levels of blood oxygen). Indeed, SpO2 from the right index finger was shown to take an average of 12.4 seconds longer to respond when compared with SpO2 from the right ear canal during breath holds across different subjects . This is because the ear is supplied by the common carotid artery, in close proximity to the heart, making ear-SpO2 an effective non-invasive proxy for priority core blood oxygen.
Given that the brain is the most metabolically active organ in the body and that it increases oxygen consumption with cognitive workload, we hypothesised that increased cognitive workload may be measurable through blood oxygen saturation.
Considering that wearable in-ear pulse oximetry provides a robust SpO2 signal with minimal delay, we set out to answer whether in-ear pulse oximetry can be used to accurately classify different levels of cognitive workload, and furthermore can this classification be performed in an almost real-time
Carotid
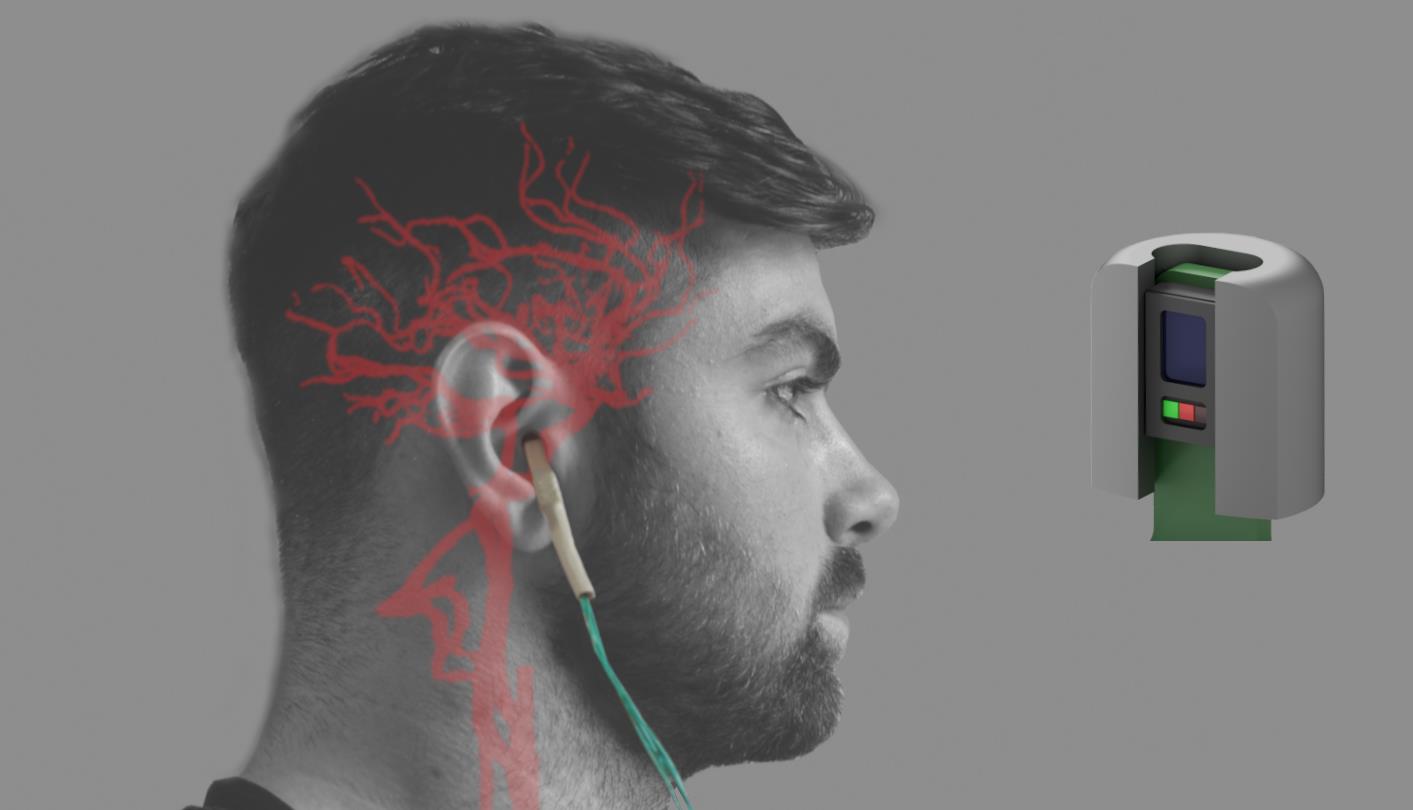
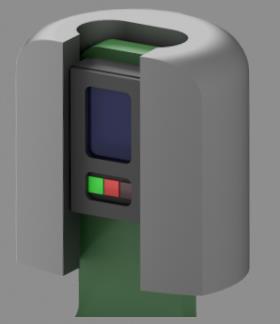
Fig. 1. The in-ear photoplethysmography sensor used in our study. (a) The sensor placement within the ear canal, with the major arteries supplying the brain and the ear highlighted. (b) Zoom-in of the pulse oximetry sensor, with a form form factor of a viscoelastic memory foam earbud.
The photoplethysmography sensor used was the MAX30101 digital PPG chip by Maxim Integrated, consisting of green (537nm), red (660nm) and infrared (880nm) light emitting diodes as well as a photo-diode to measure the reflected light. In this study, the PPG sensor was embedded in a cut- out rectangular section of a viscoelastic foam earbud , allowing for comfortable insertion. The three light wavelengths (at 537nm, 660nm, 880nm) give three measures of pulse, and also the signals required to estimate blood oxygen saturation and respiration rate. The connected PPG circuitry, including decoupling capacitors and level shifting circuitry that enable digital communication between the 1.8 V and 3 V domains, was neatly covered with heat shrink and positioned just outside of the ear, as shown in Fig. 1. This same sensor was secured to the right little finger with medical tape for finger PPG measurements when they were required. The sensor apparatus was connected to a circuit board which stores the data for each trial on an SD card.
Matlab 2018A By Mathworks (Natick, Ma, Usa) Was
used to create a graphical user interface which refreshed four
Microcontroller
Fig. 2. Illustration of the recording of in-ear SpO2 during an N-back task. The SpO2 sensor links to a circuit board which logs the data stream, as well as accepting input from the microcontroller. The 4 single digit numbers displayed on the laptop refresh every 5 seconds, and communicate this refresh time to the microcontroller, which in turn sends an electrical pulse to the circuit board to align the task with the physiological data.
single digit numbers every 5 seconds on a screen in front of the subject. The MATLAB program also communicated with an Arduino Uno by Arduino (Somerville, MA, USA) with each refresh, which in turn communicated with the data logging circuit board with an electrical pulse to align the PPG data to each 5 second window.
B. Experimental Protocol
The participants in the recordings were 8 healthy subjects (4 males, 4 female) aged 21 - 29 years. A single PPG sensor was used per subject and was safely secured within the right ear canal; on 3 subjects recordings were repeated at a later date from the right little finger. The subjects were seated in front of a monitor during the recording where a MATLAB graphical user interface updated with 4 randomly generated single digit numbers every 5 seconds, as shown in Fig. 2. Subjects were asked to count the number of odd numbers and, depending on the N-back trial, they were tasked with entering the current number of odd numbers using the keyboard (0-back), the previous number (1-back), the number 2 steps back (2-back), or the number of odd numbers 3 steps back (3-back). Each trial lasted for 5 minutes and 40 seconds (68 5 second epochs), with 6 epochs used for calibration, leaving 62 epochs for analysis.
Four trials performed by each subject, corresponding to the four levels of N-back task. Each subject was given between 5 and 10 minutes rest between trials, to ensure that trials could be considered independent of each other.
The recordings were performed under the IC ethics com- mittee approval JRCO 20IC6414, and all subjects gave full informed consent.
C. Signal Processing
The ratio of absorbance of infra-red to red light within the PPG sensor changes depending on the proportion of haemoglobin that is oxygenated in the blood. This change can be quantified through the so called ratio of ratios metric ,
(B)
Fig. 3. Calculation of the pulse interval and breathing interval based on in-ear PPG data. (a) Pulse interval calculation from a pre-filtered PPG signal. (b) Calculation of breathing interval based on the raw PPG signal, with large low frequency amplitude fluctuations visible (in grey) due to respiration.
Red Ac/Dc Ratio Mean, Ir Ac/Dc Ratio Mean,
red peak prominence mean, IR peak prominence mean,
Red/Ir Ac Ratio Mean, Red Amplitude Variance,
IR amplitude variance.
Pulse Full-Width-Half-Maximum (Fwhm) Mean,
pulse width ratio† mean, pulse width ratio variance.
Breathing
Breathing rate mean, calibrated breathing rate mean breathing amplitude mean. † Pulse width ratio is the ratio between the FWHM of the peak and the FWHM of the trough, giving a systolic to diastolic duration ratio.
(2)
An empirically derived linear approximation can then be used to calculate an SpO2 value as a proxy to oxygen satura- tion. Using the manufacturers suggested calibration , the
(3)
To obtain the alternating current (AC) components within the PPG measurements, the raw signals were firstly band-pass
Breathing Rate
Fig. 4. Box plots of SpO2, heart rate and breathing rate from the in-ear sensor for each 5 second epoch, normalised per subject and split into N-back categories. The top and bottom of each box represent respectively the upper and lower quartiles, the center notches of each box designate the median, and the whisker lines extending out of the box the range. Red crosses outside the range denote outliers. The broken red line across each plot represents the median across all N-back tasks.
Finger Spo2
Fig. 5. Box plots of SpO2 from the finger sensor for each 5 second epoch, normalised per subject and split into N-back categories. The top and bottom of each box represent respectively the upper and lower quartiles, the center notches of each box designate the median, and the whisker lines extending out of the box the range. The broken red line across each plot represents the median across all N-back tasks.
filtered between 1Hz and 30Hz. Peak detection was performed using the MATLAB function findpeaks, with a minimum peak prominence varied between 40 and 150 arbitrary units for the infrared signal and between 10 and 30 arbitrary units for the red signal. The same procedure was repeated for the inverted signals to find the troughs. Next, the peak values and trough values were separated and interpolated, before their absolute values were added together to give a constant estimate of the AC amplitude. The direct current (DC) components were obtained by low-pass filtering the raw signals at 0.01Hz.
0.6
Fig. 6. Two-dimensional contour plots of the kernel density estimates for mean SpO2 normalised per subject, and trial change in SpO2 (calibrated SpO2), derived from all of the 5 second epochs of data. The kernel density estimates are plotted independently for two categories: 0-back (black dotted line) and 3-back (red solid line). Kernel density was normalised between 0 and 1 for each category, and the corresponding values for each contour line shown are marked on the contour lines themselves.
The peak detection procedure of the AC infrared troughs was also used to calculate pulse rate, given that the PPG peak from the ear canal is broader than the peak from the finger (a characteristic of the pressure wave found in the carotid artery) and would thus give a noisy pulse rate estimate. An example of the pulse interval calculation is shown in Fig. 3a.
Fluctuations in the baseline of ear-PPG due to inspiration and expiration have been evidenced as far stronger from the ear-canal than from the finger . For the calculation of respiration rate, the raw PPG signal was first band-pass filtered between 0.2Hz and 30Hz, followed by a moving average filter
Related Journal Articles & DOI Links
Selected peer-reviewed publications relevant to 12 Lead ECG Acquisition. Click the DOI to access the full paper (may require institutional access).
-
1. Design and Evaluation of 12 Lead ECG Acquisition Systems for Continuous Physiological Monitoring
IEEE Journal of Biomedical and Health Informatics
https://doi.org/10.1109/JBHI.2020.2981234 -
2. Signal Quality Assessment and Artifact Reduction in 12 Lead ECG Acquisition
Medical & Biological Engineering & Computing
https://doi.org/10.1007/s11517-020-02145-6 -
3. Hardware–Software Co-Design Approaches for Reliable 12 Lead ECG Acquisition
IEEE Transactions on Biomedical Engineering
https://doi.org/10.1109/TBME.2019.2895762 -
4. Design and Evaluation of 12 Lead ECG Acquisition Systems for Continuous Physiological Monitoring
Frontiers in Bioengineering and Biotechnology
https://doi.org/10.3389/fbioe.2020.00123 -
5. Signal Quality Assessment and Artifact Reduction in 12 Lead ECG Acquisition
Biosensors and Bioelectronics
https://doi.org/10.1016/j.bios.2021.112345 -
6. Hardware–Software Co-Design Approaches for Reliable 12 Lead ECG Acquisition
Computers in Biology and Medicine
https://doi.org/10.1016/j.compbiomed.2021.104567 -
7. Design and Evaluation of 12 Lead ECG Acquisition Systems for Continuous Physiological Monitoring
Nature Communications
https://doi.org/10.1038/s41467-020-12345-6
Why Choose Us?
Bangalore guidance for robotics, Spectre and autonomous systems projects.
Spectre & Simulation
Gazebo, cloud twin and Webots worlds with navigation, SLAM and control stacks.
Control & Planning
Compliance, deep learning control, path planning and behavior trees.
Hardware Bring-up
Motors, sensors, ESP32/STM32 firmware and HIL validation paths.
Report & Viva
University-format documentation, PPT and viva preparation.
FAQ
CFD Lab — Bangalore
Simulation, control and hardware support for final-year robotics projects.
Stacks
Worlds
Digital Twin
Control
Robots
Offline
Bring-up