A pulse oximeter based on Time-of-Flight histograms Yuanyuan Hua*a, Konstantinos Bantounos a, Aravind Venugopalan Nair Jalajakumari a, Alex
Abstract
A pulse oximeter is an optical device that monitors tissue oxygenation levels. Traditionally, these devices estimate the oxygenation level by measuring the intensity of the transmitted light through the tissue and are embedded into everyday devices such as smartphones and smartwatches. However, these sensors require prior information and are susceptible to unwanted changes in the intensity, including ambient light, skin tone, and motion artefacts. Previous experiments have shown the potential of Time-of-Flight (ToF) techniques in measurements of tissue hemodynamics. Our proposed technology uses histograms of photon flight paths within the tissue to obtain tissue oxygenation, regardless of the changes in the intensity of the source. Our device is based on a 45ps time-to-digital converter (TDC) which is implemented in a Xilinx Zynq UltraScale+ field programmable gate array (FPGA), a CMOS Single Photon Avalanche Diode (SPAD) detector, and a low-cost compact laser source. All these components including the SPAD detector are manufactured using the latest commercially available technology, which leads to increased linearity, accuracy, and stability for ToF measurements. This proof-of-concept system is approximately 10cm×8cm×5cm in size, with a high potential for shrinkage through further system development and component integration. We demonstrate preliminary results of ToF pulse measurements and report the engineering details, trade-offs, and challenges of this design. We discuss the potential for mass adoption of ToF based pulse oximeters in everyday devices such as smartphones and wearables.

Keywords: pulse oximeter, time-of-flight (Tof), histogram, time to digital converter (TDC)
1. Introduction
A pulse oximeter is a vital device which monitors the oxygen saturation level of hemoglobin in arterial blood. It is based on the wavelength dependence photon absorption of oxyhemoglobin (O2Hb) and deoxyhemoglobin (HHb). Typically, the absorption of the two wavelengths is used to calculate the ratio which determines oxygen levels. These wavelengths which are generally 660 nm (red) and 940 nm (near infrared) are used to illuminate the skin and photodiodes are applied to collect the reflected or transmitted photons . However, these sensors measure only the intensity of the transmitted light and are susceptible to unwanted changes in the intensity, including motion artefacts . Additionally, Research shows that skin tone may affect the accuracy of hemodynamic measurements in intensity-based pulse oximeters, which means prior information is needed to correct the measured data . Compared to a conventional photodiode, which is traditionally used in the pulse oximeters to measure only intensity information, a Single Photon Avalanche Diode (SPAD) enables Time-of- Flight (ToF) measurements which provides both intensity and temporal information of photon flight time. Previous experiments have shown the potential of ToF techniques in measurement of tissue hemodynamics .

In this paper, the ToF technology we propose uses real-time histograms of photon flight paths within the tissue to obtain the preliminary information about arterial oxygenation. We demonstrate that the ToF data is independent of the intensity of the laser source, and hence demonstrate the potential of obtaining the hemodynamic oxygenation directly from temporal information which leads to minimizing the effect of intensity variations such as different skin tones which has a large variation among the population. Our prototype instrument includes three main parts: a laser source, a detector, and a Time- to-Digital Converter (TDC). We use both a commercially available pulsed laser source and a low-cost compact custom- developed laser source in order to compare the effect of optical power and temporal resolution in our measurements. The detector is a SPAD which is a reverse biased PN junction sensitive to individual photons. With its picosecond temporal resolution, SPADs are an ideal photodetector for ToF measurements. The Time-to-Digital Converter (TDC) measures the time intervals between two events. In this prototype, the TDC is based on a Field Programmable Gate Array (FPGA) which enables greater flexibility and integration during the prototyping phase. To evaluate our result, we use the Vascular Occlusion Test (VOT) which induces a measurable change to the tissue oxygenation and total hemoglobin . During the occlusion stage, the oxygenation levels fall slowly, and de-oxygenation levels rise. In this study, cuff occlusion is applied on the upper arm for the observation of changes in hemodynamic absorption, both in intensity and ToF data.
2. Proposed Methodology
We have developed a compact prototype instrument for the pulse oximetry experiments. Figure 1 shows a block diagram of this prototype which consist of the sensor unit for photodetection, the processing unit and the laser source. The sensor consists of a SPAD and the power management for biasing and buffering the SPAD output which is connected to the data processing unit. The processing unit includes the TDC, histogram generator and the required computational logic to transfer the collected data to the PC via a standard gigabit network. Additionally, the data processing unit provides a synchronization signal to the laser source.
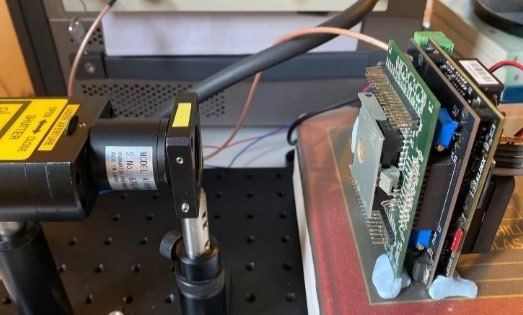
Figure 1. Block diagram of the prototype instrument
2.1 Spad Sensor
The SPAD detector in this protype oximeter is an integrated passively quenched SPAD pixel with a photo-sensitive area of 8µm diameter, a dark count rate of 1kcount/s, and a recovery time of approximately 20ns. The photon detection probability of this SPAD for the 773nm and 650nm laser used in this experiment is respectively 10% and 25%. We only use a single pixel to eliminate the effect of cross talk, signal and power integrity which may increase jitter of the detector.
2.2 Laser Sources
In this study we use two laser source configurations. In the first configuration we use a Hamamatsu C10196 driver coupled with a Hamamatsu M10306 laser head of wavelength 773nm, a pulse duration minimum 56ps including temporal jitter. This configuration is a reference for validation of the prototype instrument. Subsequently, in the second configuration we use a custom developed low-cost and compact pulsed laser source based on the Texas Instruments LMG1025-Q1EVM laser driver evaluation board with a 650 nm Roithner LaserTechnik QL65D6SA laser diode. The evaluation board contains the following modules in-series: an electrical pulse shortener circuit, a LMG1025-Q1 transistor driver, and a EPC2212 GaN FET. Electrical pulses on the FET gate regulate the current through the laser diode.
Low-Jiʃer Laser
The pulse shortener circuit in the evaluation board allows pulses of a longer width as input. It is made of an AND gate with one of its inputs connected directly to the input sync signal and the other connected to the same signal through a RC circuit delay generator. Intuitively, the width of the output pulse is the difference between the time of the input sync signal at logic '1' and the delay caused by the RC circuit. The pulse electrical shortening is caused by the RC circuit delaying the time of both AND gate inputs reaching the logic '1'. The width of the output pulse is then the time between the time instant of the AND gate outputting a logic '1' and the time instant when the input square wave drops to logic '0'. The input we use is a 4 MHz pulse waveform with a 61% duty cycle (153ns high time). The width of the output electrical pulse is approximately 1.3ns. The laser diode is operated at the gain-switched mode which means that the output optical pulse is significantly shorter than the input electrical pulse to the laser diode . The optical pulse duration and total jitter of this low-cost laser source is measured as part of our experiments.
2.3 Time To Digital Converter
The TDC is implemented in a Xilinx Zynq UltraScale+ FPGA using the Tapped Delay Lines (TDLs) architecture with 45ps bins. The TDL consists of carry chain blocks and flip-flops. Propagation states are sampled when a corresponding photon event occurs. The TDL has a total of 448 delay taps and a measurement range of 1.66ns. The linearity of the TDL improves with the increasing bin width. In these experiments, the largest available bin width of 45ps was selected due to a better linearity which is required for accurate ToF measurements. The linearity is estimated by computing Differential Non-Linearity (DNL) and Integral Non-Linearity (INL) values with a code density test :
(2)
Where 𝐼𝐼(𝑖𝑖) is the count number of individual bins which represents the relative bin width, while 𝐼𝐼(𝐴𝐴𝐴𝐴𝐴𝐴) is the average count number of the entire TDL.
(B)
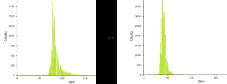
Figure 2. Code density test results of the 45ps TDC with 37 bins. (a) DNL plot and (b) INL plot Figure 2 shows the results from the code density test which demonstrates that DNL and INL are respectively [-0.15, 0.15] Least Significant Bit (LSB) and [-0.55, 0.15] LSB without missing codes and without bubbles . A FPGA-based histogram generator is implemented with 37 bins of a 16-bit depth each. Frame rate control is within the histogram generator which indicates the start and stop of each histogram. A 600Mhz clock is used as the start signal of the TDC, and a single clock cycle is used as the maximum measurement range which is 1667ps. The 37 delay steps are arranged in one measurement cycle which means the average bin width is 1667ps/37=45ps.
2.4 Data Calculation
We use equation (3) and (4) to calculate the mean time
The
(4)
where 𝐼𝐼(𝑖𝑖) is the individual bin counts and 𝑊𝑊(𝑖𝑖) is the sum of counts over all bins. 𝑛𝑛 is the total number of bins while < 𝑡𝑡> is the mean flight time of the photons.
2.5 Vascular Occlusion Test Protocol
In order to evaluate the performance of our prototype in terms of measuring oxygenation levels in the blood, we use the Vascular Occlusion Test , which uses a manually pressurized cuff on the upper arm to reduce the blood flow to the lower arm and fingers. In these experiments we monitor the transmission of the laser light through the volunteer’s index finger. A baseline is provided prior to the start of cuff pressurization. Once started, the cuff is pressurized to 160 mmHg and maintained for a few seconds. Then the cuff’s pressure is released rapidly, so that the hemodynamics can return to the baseline value prior to the cuff pressurization.
Depending on the position of the arm and finger relative to the rest of the body, the hemodynamic may increase or decrease, as the total hemoglobin volume changes. In return, the absorption levels in the blood hemodynamics changes which leads to intensity fluctuations. These fluctuations are large enough to be observable for prototyping pulse oximetry instruments.
In the ToF measurement, the change in the absorption is measured by the change in shape of the TPSF, and it is quantified by changes in the mean-time
In these experiments we used a single wavelength as it provides sufficient information for proof-of-concept ToF measurements. Further wavelengths are required in order to determine the oxygenation concentrations. However, the demonstrated measurement method remains identical for various wavelengths.
3. Experiments And Results
We designed two separate setups for the measurement of photon intensity and mean-time
(B)
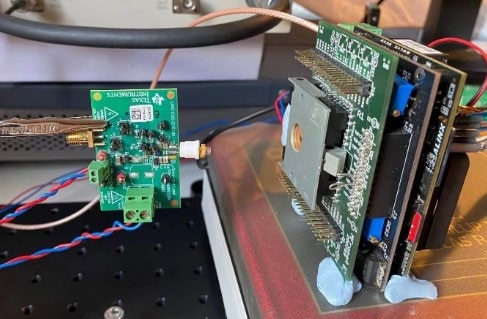
Figure 3. Experiment’s setup for the measurement for the protype instrument showing the electronic board with (a) Hamamatsu laser (b) low-cost laser.
Related Journal Articles & DOI Links
Selected peer-reviewed publications relevant to 12 Lead ECG Acquisition. Click the DOI to access the full paper (may require institutional access).
-
1. Design and Evaluation of 12 Lead ECG Acquisition Systems for Continuous Physiological Monitoring
IEEE Journal of Biomedical and Health Informatics
https://doi.org/10.1109/JBHI.2020.2981234 -
2. Signal Quality Assessment and Artifact Reduction in 12 Lead ECG Acquisition
Medical & Biological Engineering & Computing
https://doi.org/10.1007/s11517-020-02145-6 -
3. Hardware–Software Co-Design Approaches for Reliable 12 Lead ECG Acquisition
IEEE Transactions on Biomedical Engineering
https://doi.org/10.1109/TBME.2019.2895762 -
4. Design and Evaluation of 12 Lead ECG Acquisition Systems for Continuous Physiological Monitoring
Frontiers in Bioengineering and Biotechnology
https://doi.org/10.3389/fbioe.2020.00123 -
5. Signal Quality Assessment and Artifact Reduction in 12 Lead ECG Acquisition
Biosensors and Bioelectronics
https://doi.org/10.1016/j.bios.2021.112345 -
6. Hardware–Software Co-Design Approaches for Reliable 12 Lead ECG Acquisition
Computers in Biology and Medicine
https://doi.org/10.1016/j.compbiomed.2021.104567 -
7. Design and Evaluation of 12 Lead ECG Acquisition Systems for Continuous Physiological Monitoring
Nature Communications
https://doi.org/10.1038/s41467-020-12345-6
Why Choose Us?
Bangalore guidance for robotics, Spectre and autonomous systems projects.
Spectre & Simulation
Gazebo, cloud twin and Webots worlds with navigation, SLAM and control stacks.
Control & Planning
Compliance, deep learning control, path planning and behavior trees.
Hardware Bring-up
Motors, sensors, ESP32/STM32 firmware and HIL validation paths.
Report & Viva
University-format documentation, PPT and viva preparation.
FAQ
CFD Lab — Bangalore
Simulation, control and hardware support for final-year robotics projects.
Stacks
Worlds
Digital Twin
Control
Robots
Offline
Bring-up