Abstract
Fluid-structure interaction in the developing heart is an active area of research in developmental biology. How- ever, investigation of heart dynamics is mostly limited to computational fluid dynamics simulations using heart wall structure information only, or single plane blood flow information - so there is a need for 3D + time resolved data to fully understand cardiac function. We present an imaging platform combining selective plane illumination microscopy (SPIM) with micro particle image velocimetry (µPIV) to enable 3D-resolved flow mapping in a micro- scopic environment, free from many of the sources of error and bias present in traditional epifluorescence-based µPIV systems. By using our new system in conjunction with optical heart beat synchronisation, we demonstrte the ability obtain non-invasive 3D + time resolved blood flow measurements in the heart of a living zebrafish embryo.
Keywords: Selective Plane Illumination Microscopy, Micro Particle Image Velocimetry, Correlation Averaging, Depth of Correlation, Blood Flow Imaging, Zebrafish, Optical Gating
1. Introduction
Micro Particle Image Velocimetry (µPIV) is a non-invasive flow measurement technique, which uses image cross- correlation to quantify the motion of groups of particles in a fluid.1,2 µPIV has been utilized increasingly in recent years to quantify micro-scale flows in a range of different applications,3,4 including flow related to biological systems such as the swimming zooplankton,5 root growth,6 blood sucking mosquito7 and, most relevant for this work, measurement of blood flow in small animal models such as the rat,8 chicken,9,10 and zebrafish.11–15 Previous quantification of red blood cell (RBC) dynamics in such animals using µPIV measurements has mostly been limited to two-dimensional two-component (2D-2C) flow information obtained from epifluorescence or brightfield (BF) microscopy.
However, not only does this fail to capture the full 3C-3D flow field, these volume illumination imaging modalities also suffer from velocity underestimation when investigating fluids with a depth-varying velocity profile,16 such as the blood flow in the heart. Conceptually the reason for this is the presence of an extended depth over which particles outside of the depth of focus (DoF) still strongly influence and bias the measured flow values. This can be interpreted as a weighted averaging of the true flow velocity value throughout the thickness of the sample. This depth depends on the imaging system and the particles in the fluid,17 and even on the dynamics of the imaged flow itself,18 and is referred to as the Depth-of-Correlation (DoC).
Due to these limitations of DOC and lack of optical sectioning to resolve in depth, standard µPIV using epi- fluorescence microscopy only provides a ballpark estimate of the true underlying flow. To overcome these issues, and also to extend to direct 3D-3C measurements, several techniques have been proposed (reviewed in detail by Cierpka & Kehler19). All of these systems have their own limitations, including, but not limited to, the need for multiple imaging arms, high photo-toxicity to living samples, only applicable for certain densities of flowing particles, lowering of SNR, and/or the need for non-trivial algorithms for flow measurement reconstruction.
In this manuscript, we will describe how we have used a selective plane illumination microscopy (SPIM) system to overcome these limitations and acquire 3D-2C flow fields using a method that is highly compatible with living samples. We demonstrate phantom experiment results, which illustrate the robustness of the system and ability to obtain 3D-2C data directly. We experimentally compare flow measurements in a circular tube
Arxiv:1802.05646V1 [Q-Bio.Qm] 15 Feb 2018
with BF and SPIM, where DoC effects are clearly manifest in the recovered flow profiles in the BF case, but are absent for SPIM. We also quantify the effect of out-of-plane motion (OOPM) effects, and discuss how correlation averaging can help minimize them by improving the statistical accuracy of the measurements. Finally, we will demonstrate how the gentle imaging of SPIM can be combined with our previously-reported optical gating techniques20 to obtain high quality time- and depth-resolved blood flow measurements in the heart of a zebrafish embryo. Our 3D-2C measurements are robust against noise, low blood cell density, and depth-varying flow.
2. Method
The volume illumination effects in µPIV measurements mentioned in Sec. 1 are an issue for the epifluorescence and BF microscopy modalities that have been used in the past to image blood flow in the zebrafish heart. The SPIM system used in this work, Fig. 1, has optical similarities with conventional macroscopic PIV systems, in that both use a cylindrical lens to create thin sheet of light to illuminate the sample. Because the illumination is confined to the thickness of the light sheet, these DoC effects do not occur, and true depth sectioning is achieved.
Mirror
Figure 1: A simplified diagram of the SPIM system used in this work, a more detailed diagram can be found
In.20
Like in macroscopic PIV systems, the light sheet is formed using a cylindrical lens, which allows for instantaneous large FOV illumination. Simultaneous imaging of the zebrafish heart with brightfield (BF) and fluorescence (FLR) channels allows for the use of optical gating techniques.21,22 The 780 nm LED serves as the BF illumination source, and the BF channel uses a motorized tube lens to keep the image in focus, as the sample is moved through the light sheet. A galvo mirror is used to minimize shadow artefacts.23 The 4f relay optics are omitted from the diagram for clarity.
2
All PIV analysis was performed using the OpenPIV software.24 Frame pairs were acquired from the fluo- rescence imaging channel, closely-spaced in time, and processed using a standard PIV analysis. This involves dividing up the images into small “interrogation windows”, within which the two images in a pair are cross- correlated to infer a local motion vector. We used sum of absolute difference (SAD) of pixel intensity values as our correlation function (as opposed to conventional sum of pixel intensity product) as we found empirically that it performs better for RBC imaging. We note that there is a vast array of pre- and post processing methods in PIV literature but, unless otherwise stated, we have not used any such techniques in order to illustrate the fact that the quality of the raw images alone is sufficient to obtain smooth flow field information.
2.1 Brightfield Vs Spim-Μpiv
For a flow in a tube imaged with volume illumination-µPIV systems, DoC effects lead to underestimation of the peak velocity and flow profile broadening.16 This is often modelled as having the effect of averaging the velocity over some slab of volume through the sample. To verify the minimal DoC effects in our SPIM-µPIV system, we compare it to BF-µPIV for imaging flow of 1.04µm diameter fluorescent polystyrene beads in a 48µm diameter Fluorinated Ethylene Propylene (FEP) tube (refractive index ≈1.344).
2.2 Out-Of-Plane Motion Effects
For planar PIV systems, OOPM is one of the potential sources of measurement errors. The effect of particles entering and leaving the thickness of the light sheet reduces the signal peak height and increases background noise in the cross-correlation matrix [2, p.176], and if steps are not taken to remedy this then the true signal peak eventually becomes indistinguishable from noise.
Experimentally, the simplest solution is contract the time difference between laser pulses illuminating the sample between frames, but if this is too short then the frame-to-frame motion (in pixels) becomes unacceptably small.
Other methods discussed in [2, p.176] include orienting the sample such that the flow is as much in-plane as possible – but this is not always feasible in biological samples. Alternatively, for steady flows the statistics of the correlation matrix can be improved by using a technique called correlation averaging to combine information
(B)
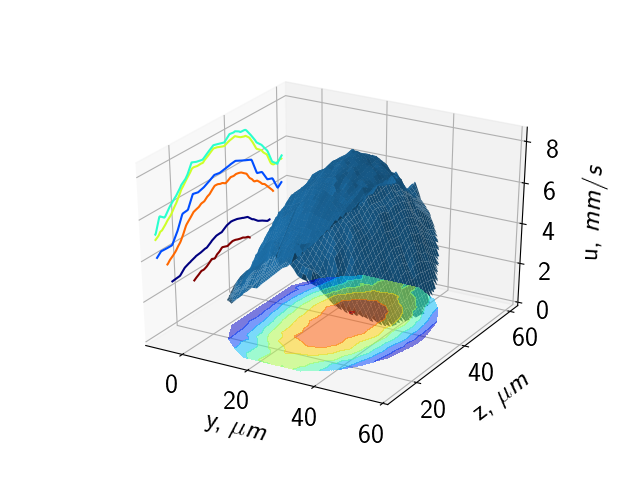
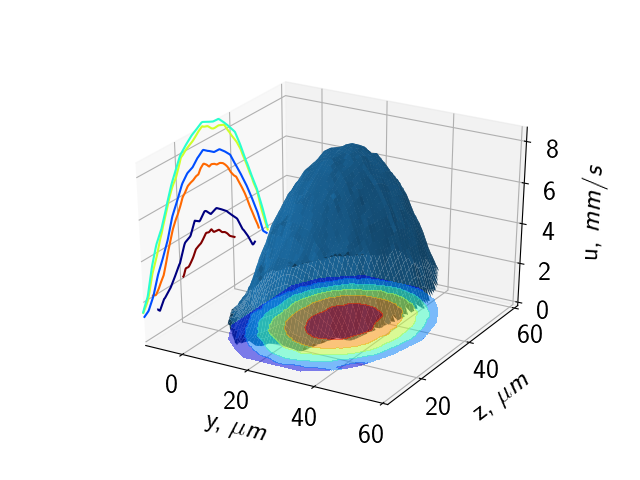
Figure 2: 3D plot of velocity profile across a tube cross-section acquired using (a) BF and (b) SPIM-µPIV. Selected flow cross-sections plotted on the left of each graph; heatmap of velocities shown in the yz plane of the graph. The analysis was performed using same PIV settings for both datasets, as well as the same optics.
The BF results, 2a, show flattening of the expected parabolic flow profile in the depth direction, due to depth of correlation effects in the presence of a parabolic flow gradient. In contrast, the SPIM dataset recovers the expected parabolic flow profile as a function of depth, demonstrating the absence of any significant error in the velocity values as a function of depth.
Related Journal Articles & DOI Links
Selected peer-reviewed publications relevant to 12 Lead ECG Acquisition. Click the DOI to access the full paper (may require institutional access).
-
1. Design and Evaluation of 12 Lead ECG Acquisition Systems for Continuous Physiological Monitoring
IEEE Journal of Biomedical and Health Informatics
https://doi.org/10.1109/JBHI.2020.2981234 -
2. Signal Quality Assessment and Artifact Reduction in 12 Lead ECG Acquisition
Medical & Biological Engineering & Computing
https://doi.org/10.1007/s11517-020-02145-6 -
3. Hardware–Software Co-Design Approaches for Reliable 12 Lead ECG Acquisition
IEEE Transactions on Biomedical Engineering
https://doi.org/10.1109/TBME.2019.2895762 -
4. Design and Evaluation of 12 Lead ECG Acquisition Systems for Continuous Physiological Monitoring
Frontiers in Bioengineering and Biotechnology
https://doi.org/10.3389/fbioe.2020.00123 -
5. Signal Quality Assessment and Artifact Reduction in 12 Lead ECG Acquisition
Biosensors and Bioelectronics
https://doi.org/10.1016/j.bios.2021.112345 -
6. Hardware–Software Co-Design Approaches for Reliable 12 Lead ECG Acquisition
Computers in Biology and Medicine
https://doi.org/10.1016/j.compbiomed.2021.104567 -
7. Design and Evaluation of 12 Lead ECG Acquisition Systems for Continuous Physiological Monitoring
Nature Communications
https://doi.org/10.1038/s41467-020-12345-6
Why Choose Us?
Bangalore guidance for robotics, Spectre and autonomous systems projects.
Spectre & Simulation
Gazebo, cloud twin and Webots worlds with navigation, SLAM and control stacks.
Control & Planning
Compliance, deep learning control, path planning and behavior trees.
Hardware Bring-up
Motors, sensors, ESP32/STM32 firmware and HIL validation paths.
Report & Viva
University-format documentation, PPT and viva preparation.
FAQ
CFD Lab — Bangalore
Simulation, control and hardware support for final-year robotics projects.
Stacks
Worlds
Digital Twin
Control
Robots
Offline
Bring-up