Classification Using Cardiac Cine Mr Images
Jelmer M. Wolterink1(), Tim Leiner2, Max A. Viergever1, Ivana Iˇsgum1 Abstract. Segmentation of the heart in cardiac cine MR is clinically used to quantify cardiac function. We propose a fully automatic method for segmentation and disease classification using cardiac cine MR images.
A convolutional neural network (CNN) was designed to simultaneously segment the left ventricle (LV), right ventricle (RV) and myocardium in end-diastole (ED) and end-systole (ES) images. Features derived from the obtained segmentations were used in a Random Forest classifier to label patients as suffering from dilated cardiomyopathy, hypertrophic cardiomyopathy, heart failure following myocardial infarction, right ven- tricular abnormality, or no cardiac disease.
The method was developed and evaluated using a balanced dataset con- taining images of 100 patients, which was provided in the MICCAI 2017 automated cardiac diagnosis challenge (ACDC). Segmentation and clas- sification pipeline were evaluated in a four-fold stratified cross-validation.
Average Dice scores between reference and automatically obtained seg- mentations were 0.94, 0.88 and 0.87 for the LV, RV and myocardium. The classifier assigned 91% of patients to the correct disease category.
Segmentation and disease classification took 5 s per patient. The results of our study suggest that image-based diagnosis using cine MR cardiac scans can be performed automatically with high accuracy.
Keywords: Deep learning, Random Forest, Convolutional neural net-
Introduction
Quantification of volumetric changes in the heart during the cardiac cycle is es- sential for diagnosis and monitoring of cardiac diseases. To this end, quantitative indices such as the ejection fraction and myocardial mass are typically extracted based on segmentations of the ventricular cavities and myocardium and used to identify patients suffering from cardiac diseases .
However, segmentation of the ventricular cavities and myocardium in cine MR is a challenging problem . Cine MR images are highly anisotropic, contrast in these images may be poor, and cardiac diseases may cause large variations in patient anatomy. The development of accurate cine MR segmentations methods
2
J.M. Wolterink et al. is an ongoing endeavor , which has recently seen contributions from deep learning methods, e.g. .
We propose a method for fully automatic segmentation of the LV cavity, the RV cavity and the myocardium in cardiac cine MR images. We use a deep learning method for cardiac cine MR segmentation and show that this method achieves high overlap with manual reference segmentations. Furthermore, we show how basic quantitative features extracted from the automatically obtained segmentations can be combined with patient information in a forest of random- ized decision trees. This allows fast and accurate disease classification in cardiac patients, and detection of patients with ambiguous indications.
Data
The proposed method was developed and evaluated using data from the MICCAI 2017 automated cardiac diagnosis challenge (ACDC). This challenge provides a dataset consisting of cine MR images of 150 patients who have been clinically diagnosed in five classes: normal, dilated cardiomyopathy (DCM), hypertrophic cardiomyopathy (HCM), heart failure with infarction (MINF), or right ventric- ular abnormality (RVA). Thirty cases are provided in each class. The data set was separated by the challenge organizers into 100 training cases for which a ref- erence standard was provided, and 50 test cases for which no reference standard was provided. Here, we describe experiments and results using the 100 training cases.
For each patient, short axis (SA) cine MR images with 12-35 frames are available, in which the end-diastole (ED) and end-systole (ES) frame have been indicated. The image slices cover the LV from the base to the apex. In-plane voxel spacing varies from 1.37 to 1.68 mm and inter-slice spacing varies from 5 to 10 mm. Manual reference segmentations of the LV cavity, RV cavity and myocardium at ED and ES are provided.
To correct for differences in voxel size, all 2D image slices were resampled to 1.4 × 1.4 mm2 spacing. Furthermore, to correct for image intensity differences between images, each MR volume was normalized between [0.0, 1.0] according to the 5th and 95th percentile of intensities in the image.
Methods
We propose a fully automatic method for segmentation and diagnosis in cardiac cine MR images. The method uses a convolutional neural network (CNN) to segment the LV cavity, the RV cavity, and the myocardium in 2D short-axis cine MR slices. Quantitative indices are extracted from the obtained segmentations and combined with patient information in a Random Forest classifier that assigns patients to one of five classes (normal, DCM, HCM, MINF, RVA).
Automatic Segmentation and Diagnosis Using Cardiac Cine MR Images
3
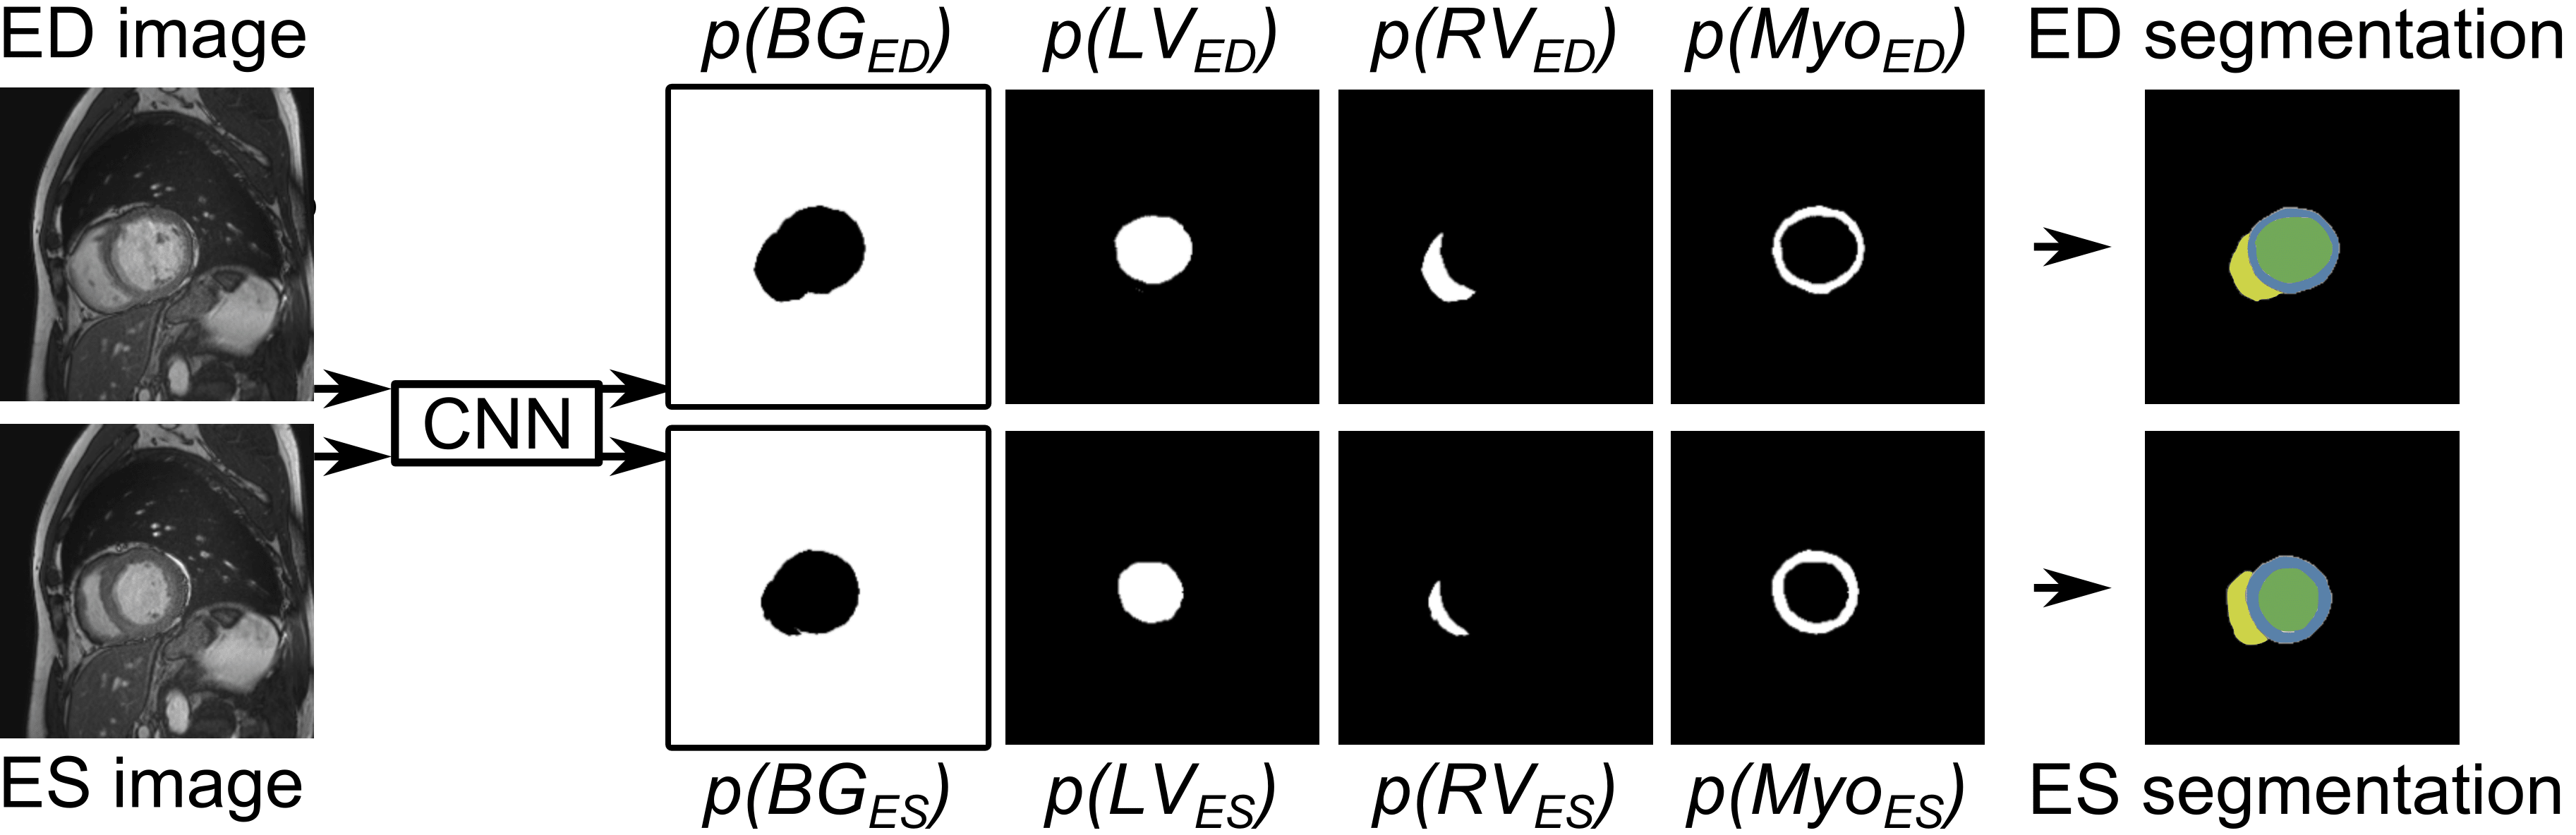
Fig. 1: Convolutional neural network for segmentation. The CNN uses anatom- ically aligned end-diastole (ED) and end-systole (ES) 2D image slices as input and simultaneously predicts probability maps for the background (BG), LV cav- ity (LV), RV cavity (RV) and myocardium (Myo) at ED and ES. These are combined into two multi-class segmentations.
Segmentation
A CNN was trained to segment the LV cavity, the RV cavity, and the myocardium in 2D short-axis cine MR slices. Motivated by , the network was designed to contain a number of convolutional layers with increasing levels of dilation. This ensures a large receptive field with few trainable parameters and high resolution feature maps. The final receptive field for each voxel was 131 × 131 voxels, or 18.3 × 18.3 cm2 in the resampled 2D slices. Potential overfitting of the network was mitigated by the inclusion of Batch Normalization layers .
Cine cardiac MR slices obtained throughout the cardiac cycle are anatomi- cally aligned, but cardiac motion causes differences between images at different time points. These differences are more pronounced in the heart than in other areas . We allowed the CNN to leverage this information for heart localization by simultaneously providing anatomically corresponding ED and ES slices in two input channels (Fig. 1). The CNN had eight output channels; four for ED labels (BGED, LVED, RVED, MyoED), and four for ES labels (BGES, LVES, RVES, MyoES). ED and ES output channels were separately normalized through softmax functions. Hence, for both the ED and the ES image there were four probability maps summing to 1. A segmentation was obtained for both images by assigning the class with the highest probability to each voxel.
The trainable parameters in the CNN were optimized using a loss function based on the Dice similarity coefficient . This partly corrects for class imbal- ance in the voxel labels. A soft Dice loss was used,
(1)
where Rc is the binary reference image for class c, Ac is the probability map for class c, N is the number of voxels, and Dicec is the Dice coefficient for class c. This coefficient was computed for all eight classes (BGED, RVED, MyoED,
4
J.M. Wolterink et al. LVED, BGES, RVES, MyoES, LVES) and averaged to ensure joint optimization for all classes.
The combination of multiple trained CNN models in an ensemble typically results in more accurate predictions, but at the cost of repeated training. To ob- tain multiple models with a single training phase, we used the snapshot ensemble technique proposed in . Hence, the learning rate followed a cyclic scheme ac-
(2)
where αi is the current learning rate, α0 is the initial learning rate and M is the cycle length, i.e. the number of iterations before a reset of the learning rate to the initial value. We set the total number of iterations to 150,000 and reset the learning rate to α0 = 0.2 after every M = 10, 000 iterations. A copy of the model was stored before each learning rate reset. Stochastic gradient descent was used for training, with L2-regularization on the parameters of the CNN. In each iteration, the network was optimized with a mini-batch containing 4 images with 151×151 voxel samples, padded to 281×281 to accommodate the 131×131 voxel receptive field. The training data was augmented by 90 degree rotations of the images and reference segmentations.
During testing, pairs of ED and ES images were processed by the six stored versions of the model between 100,000 and 150,000 iterations. The six predicted probability maps for each class were averaged before the class label with the largest probability was assigned to each voxel. No post-processing was applied other than selection of the largest 3D 6-connected component for each class.
Diagnosis
Each patient was described by patient and image characteristics. Patient char- acteristics were patient weight (in kg) and patient height (in cm). Image charac- teristics were extracted from the automatically obtained segmentations: LV, RV and myocardial volume at ED and ES (in ml), the LV and RV ejection fraction (EF), the ratio between RV and LV volume at ED and ES, and the ratio between myocardial and LV volume at ED and ES. Hence, 14 features were used in total: 2 patient-based and 12 image-based features.
A five-class (normal, HCM, DCM, MINF, RVA) Random Forest classifier was trained, consisting of 1,000 decision trees that were grown to full depth. For each case, a posterior probability distribution was obtained. Patients were assigned to the class with the highest probability, and the entropy in the prob- ability distribution was determined to estimate uncertainty of the classifier.
Experiments And Results
The proposed method was evaluated using the ACDC training set in a stratified four-fold cross-validation experiment. For each fold the system was trained using Automatic Segmentation and Diagnosis Using Cardiac Cine MR Images
5
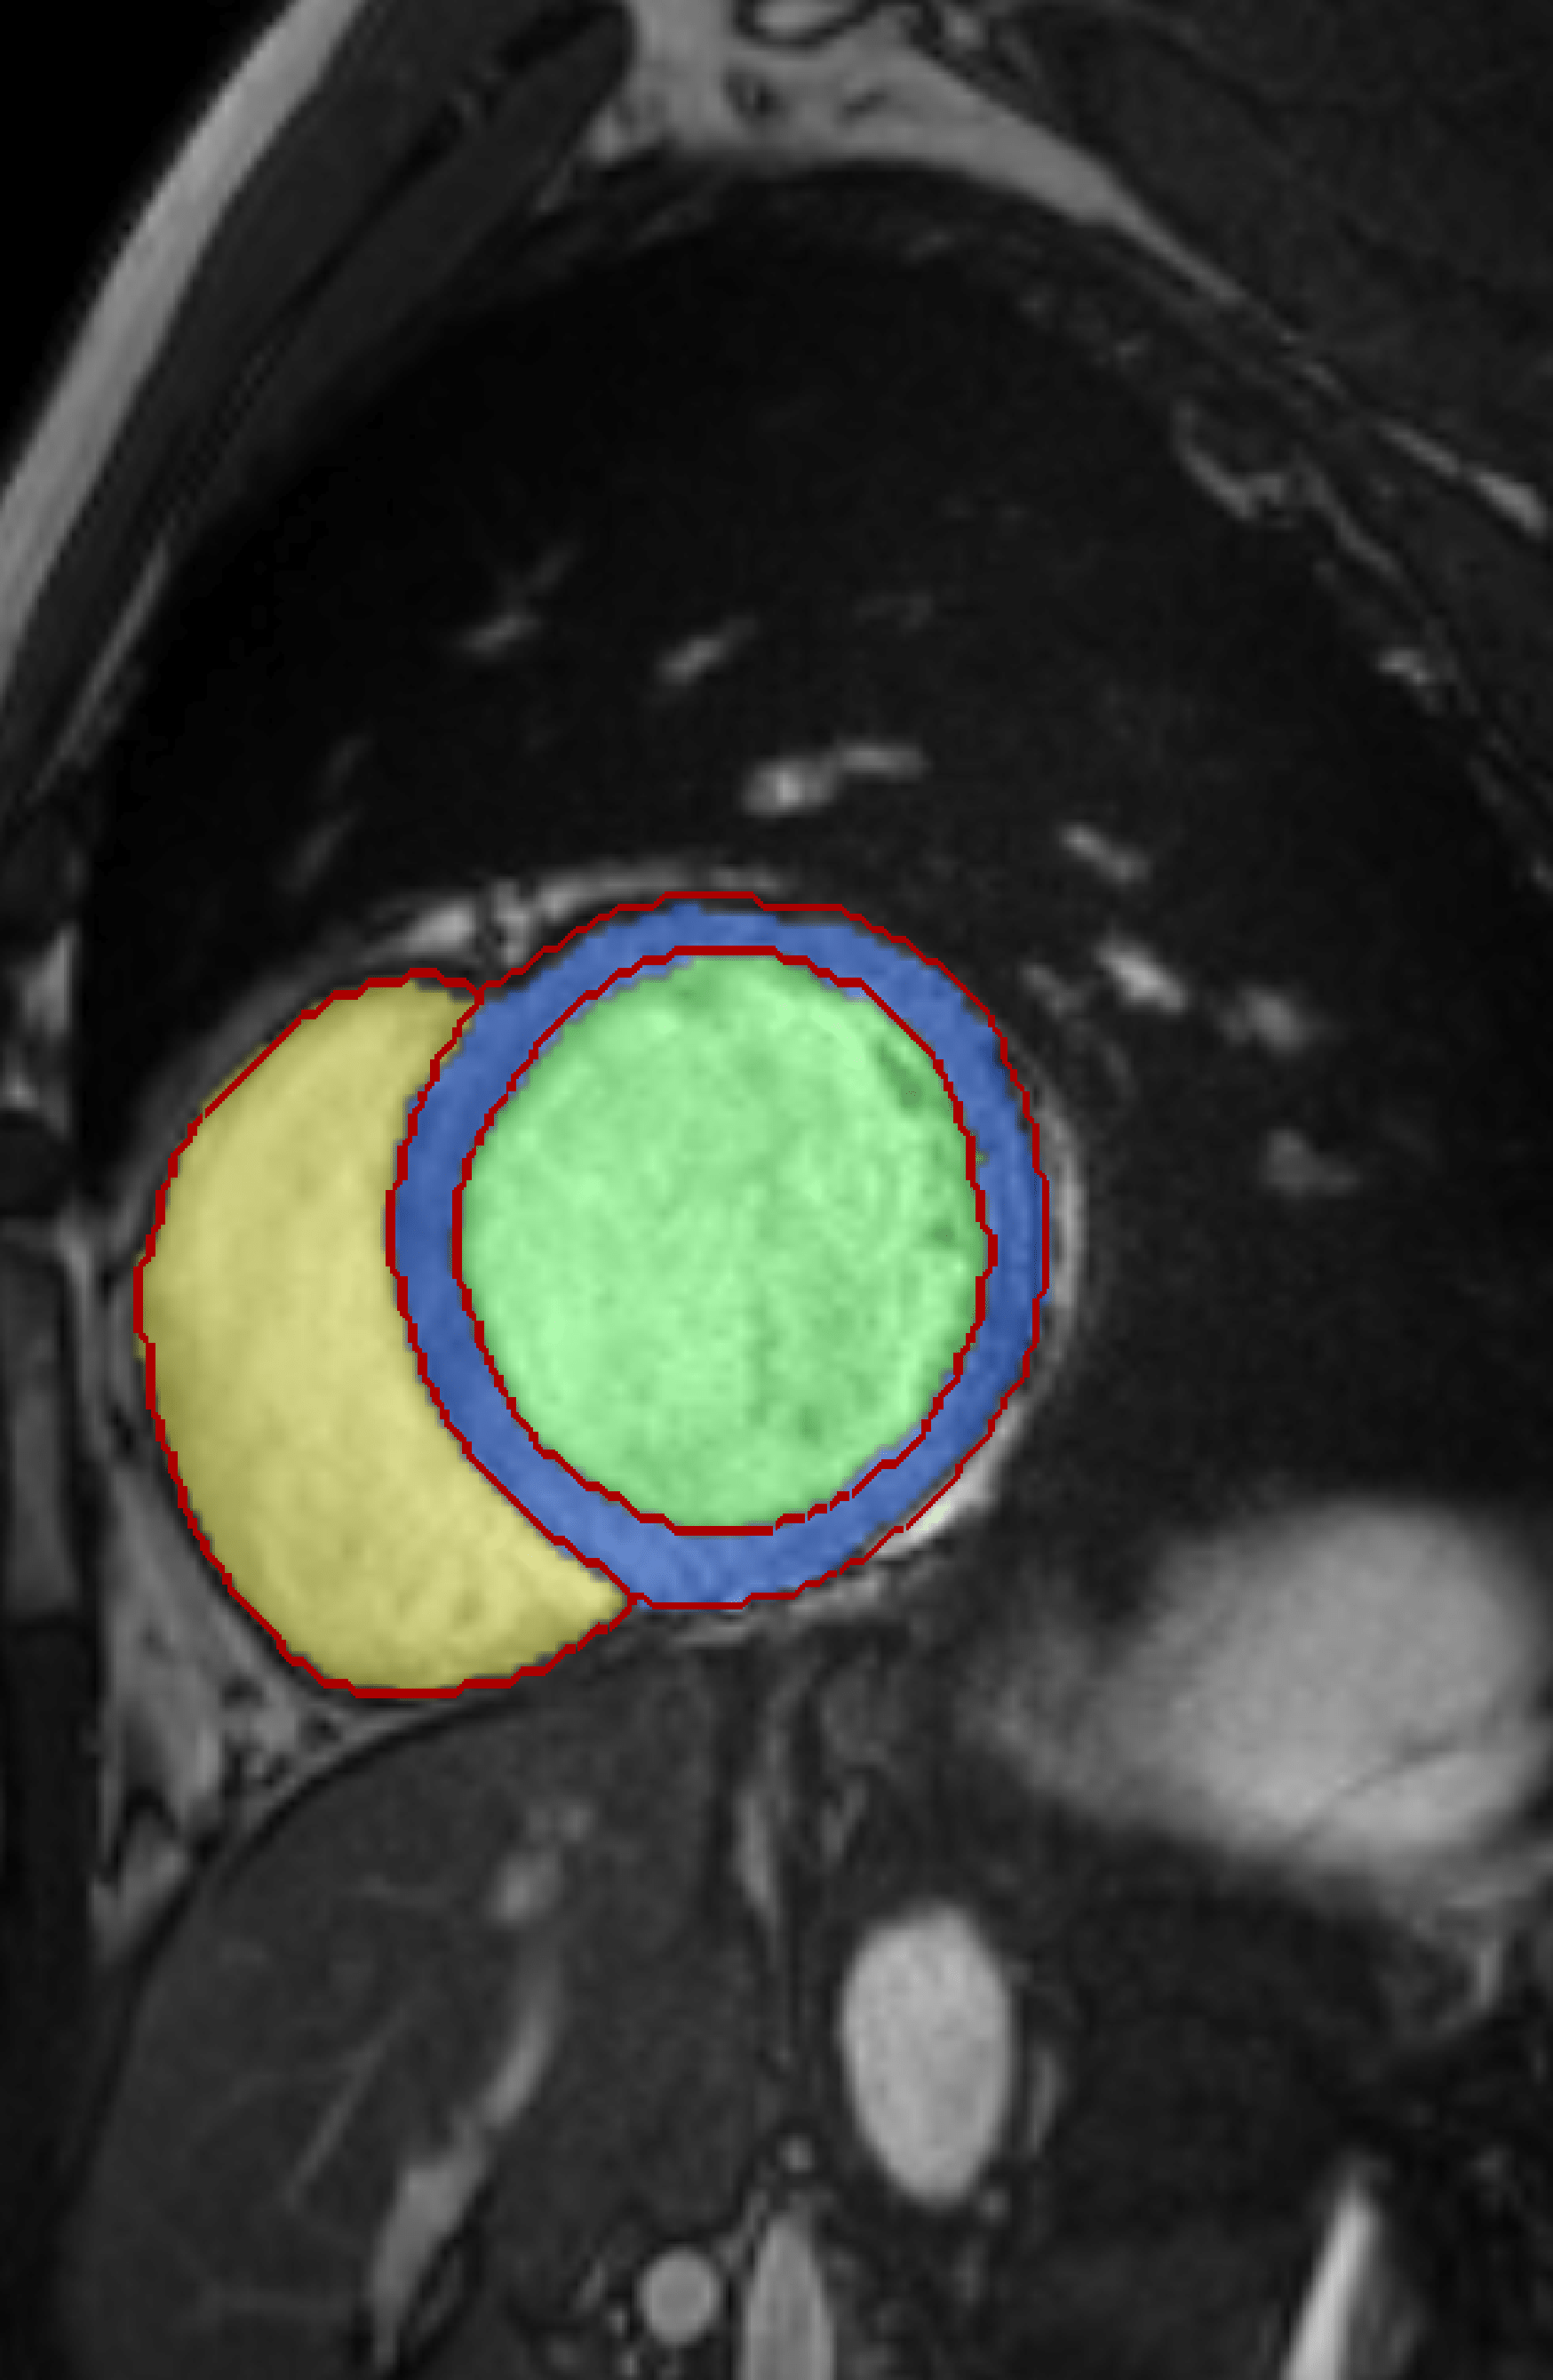
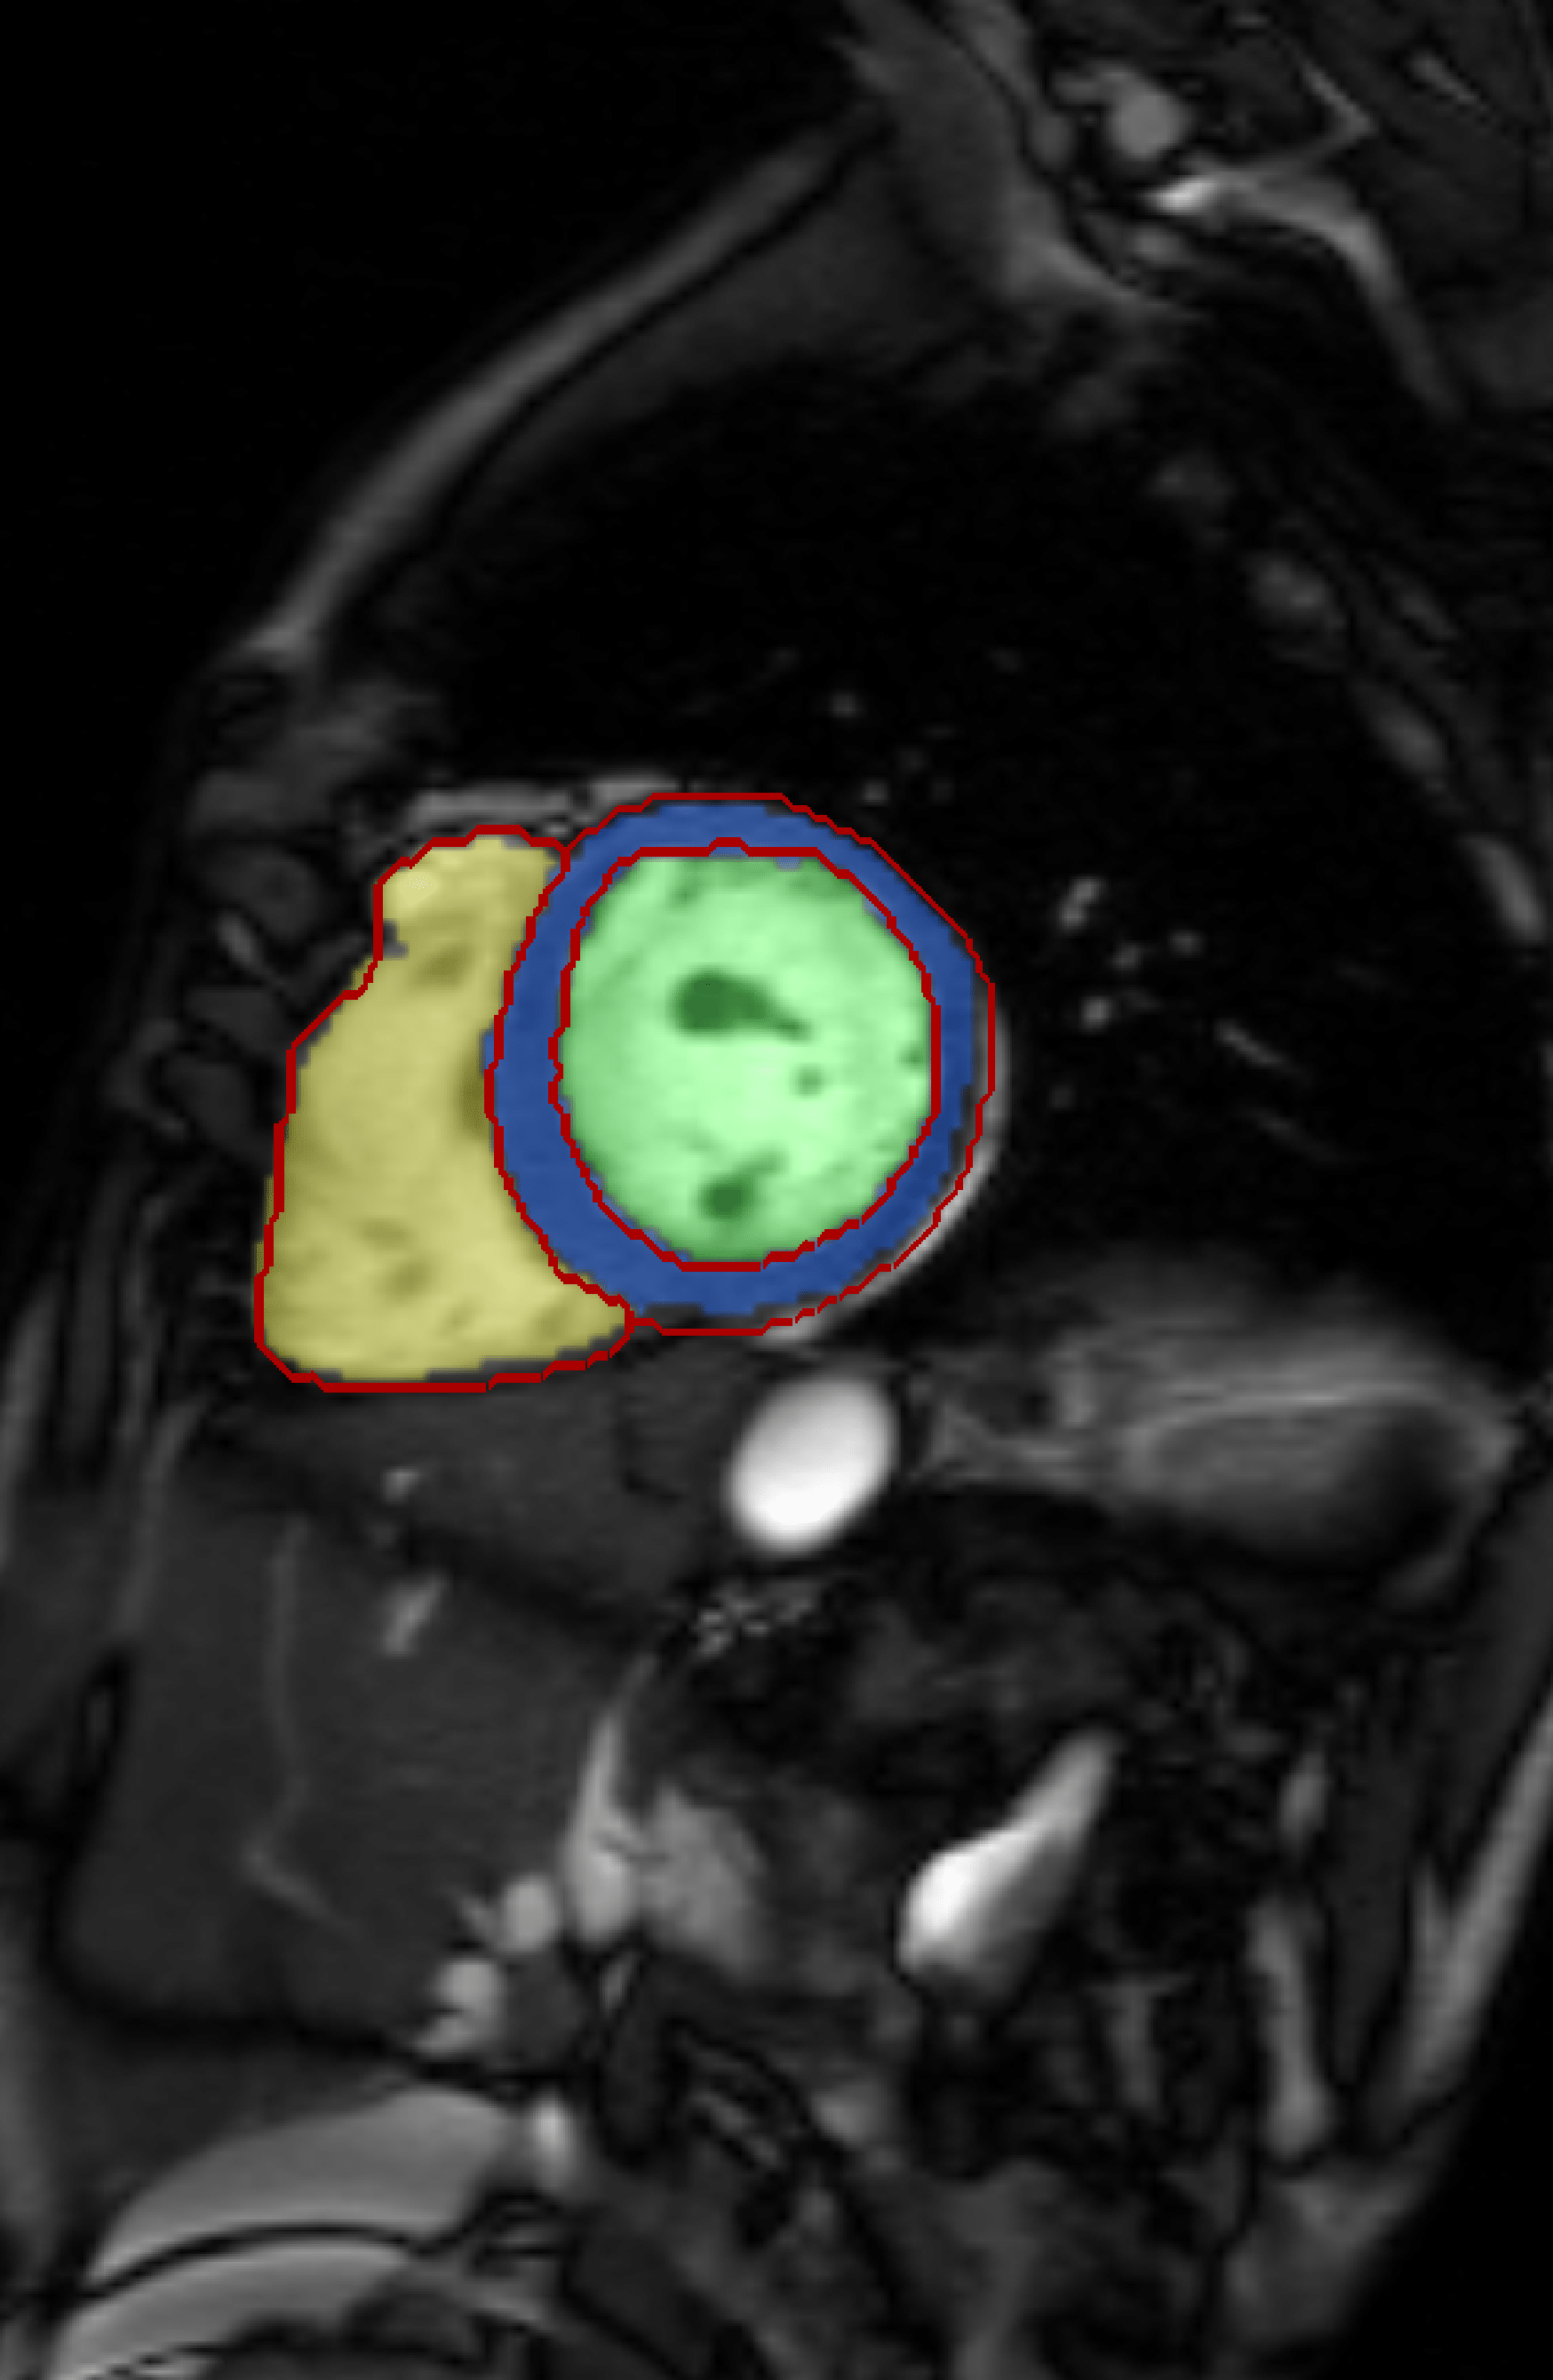
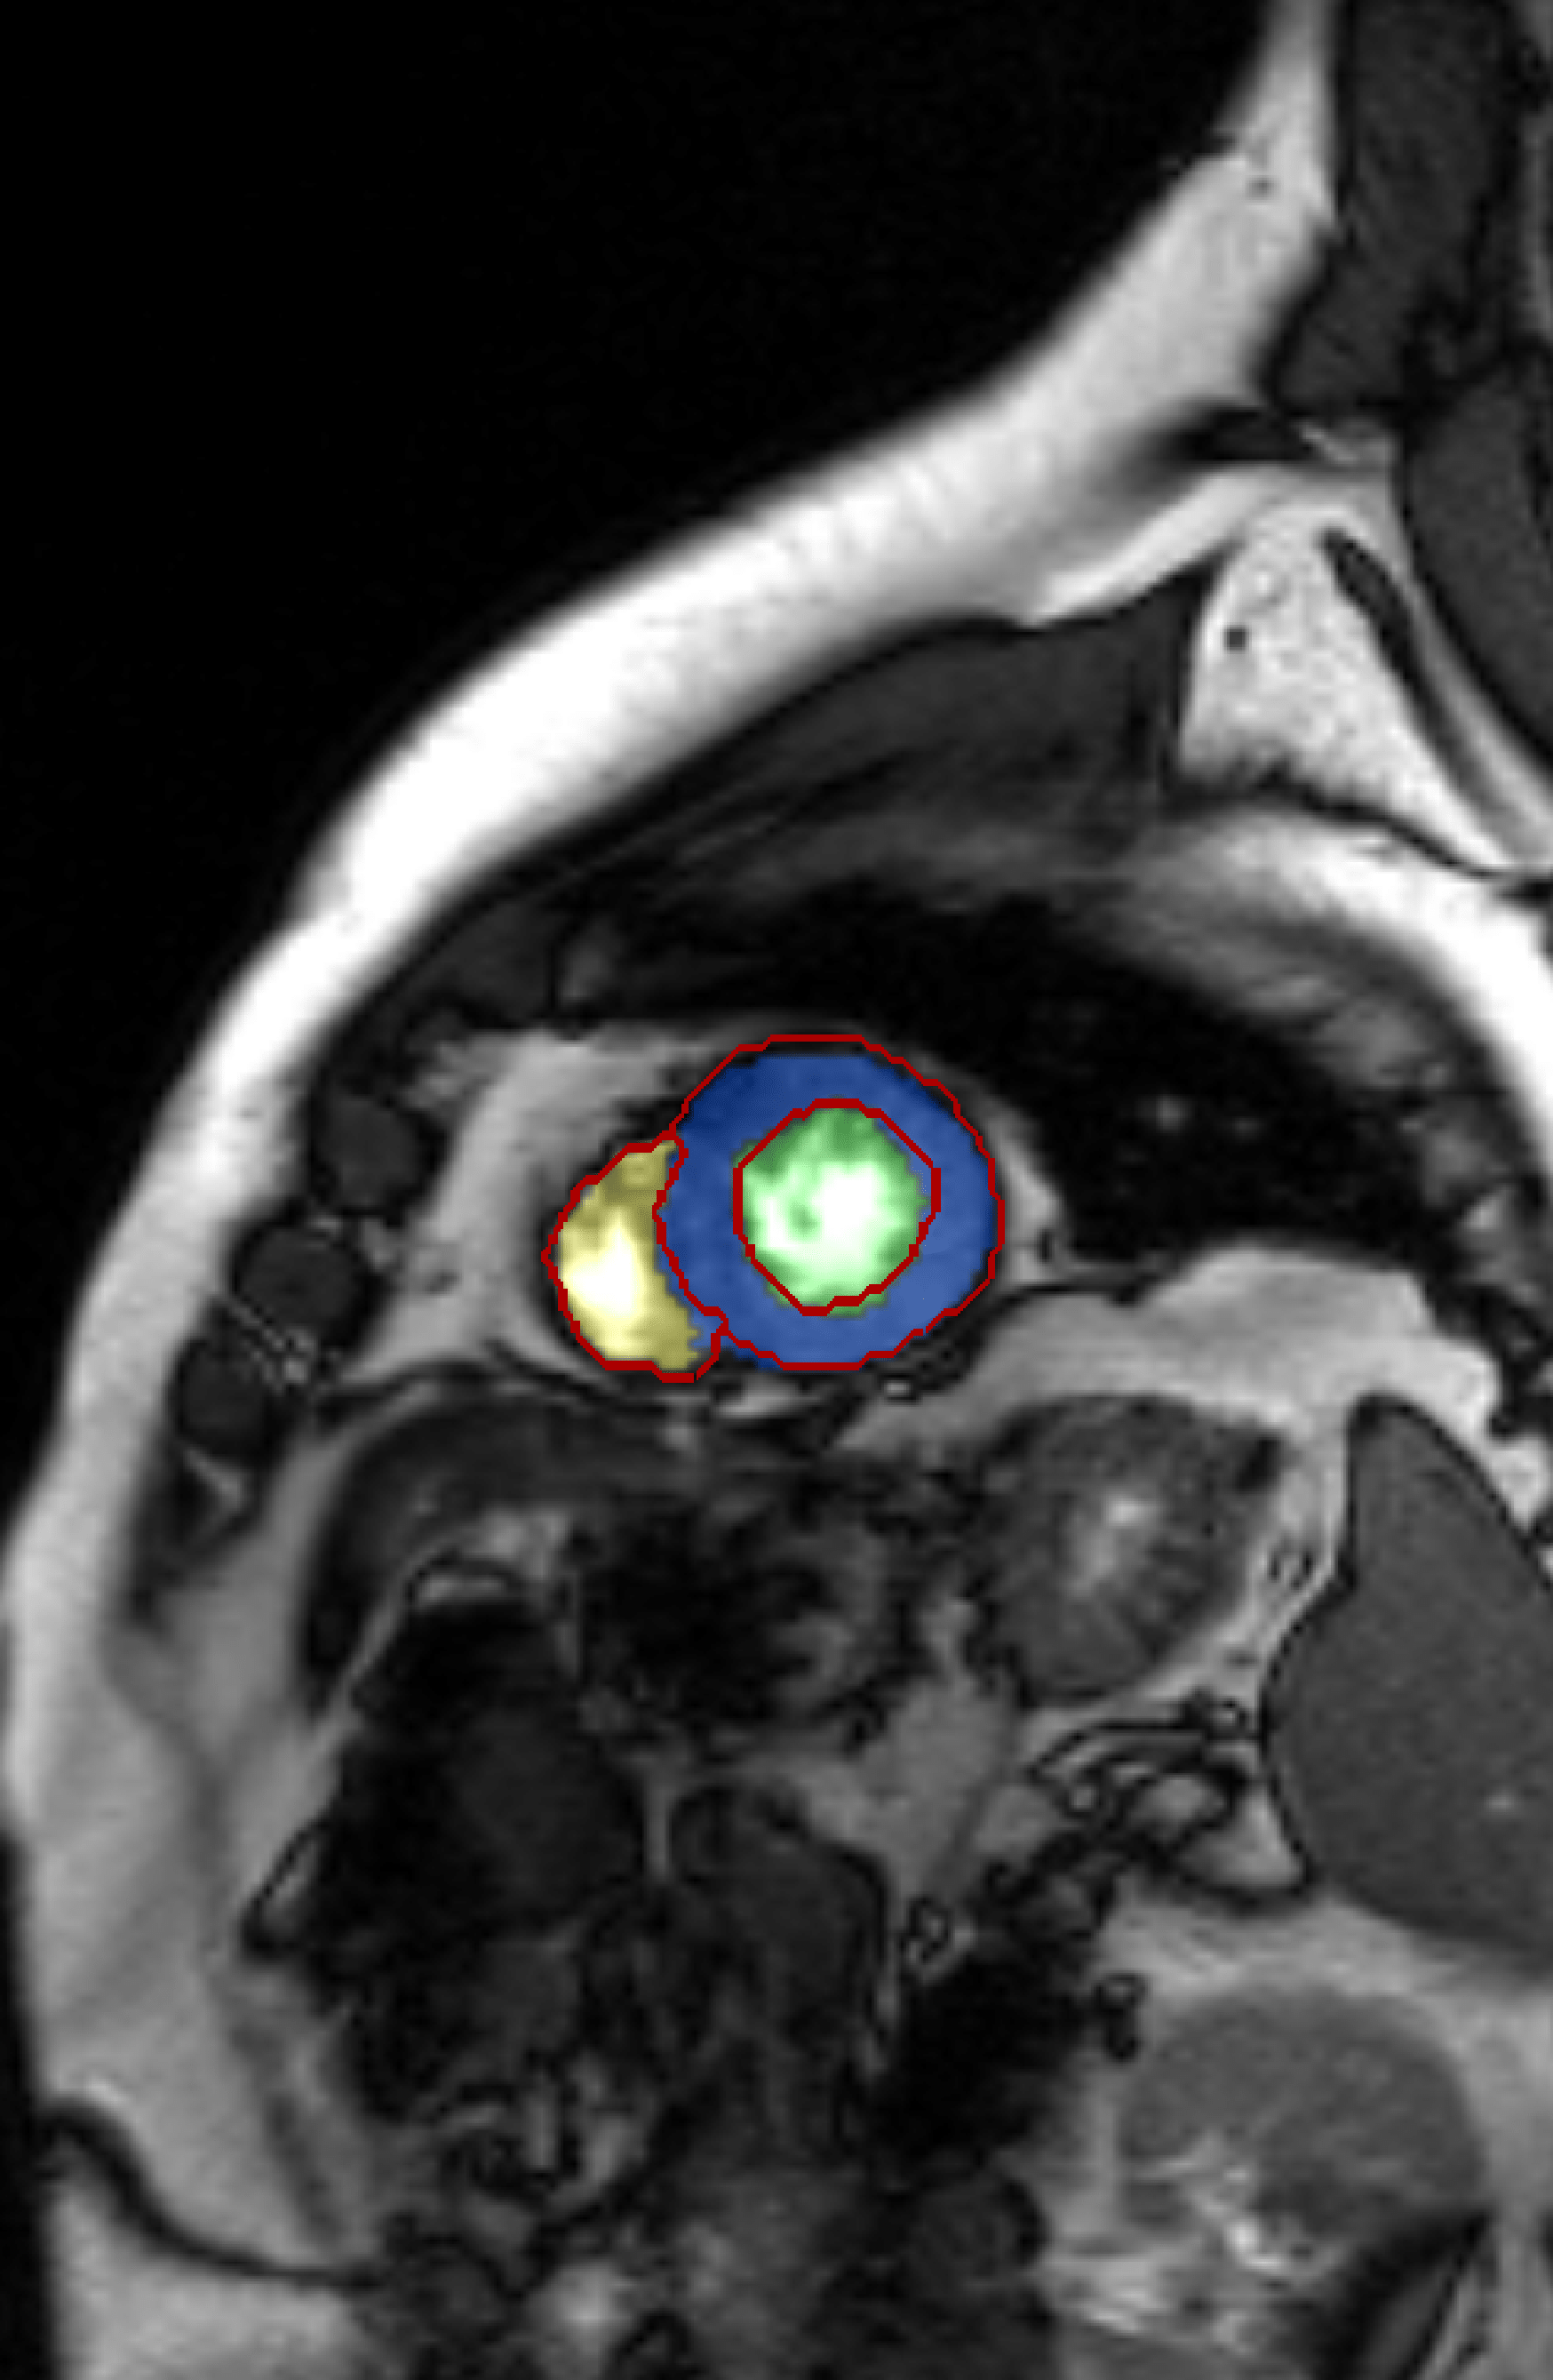
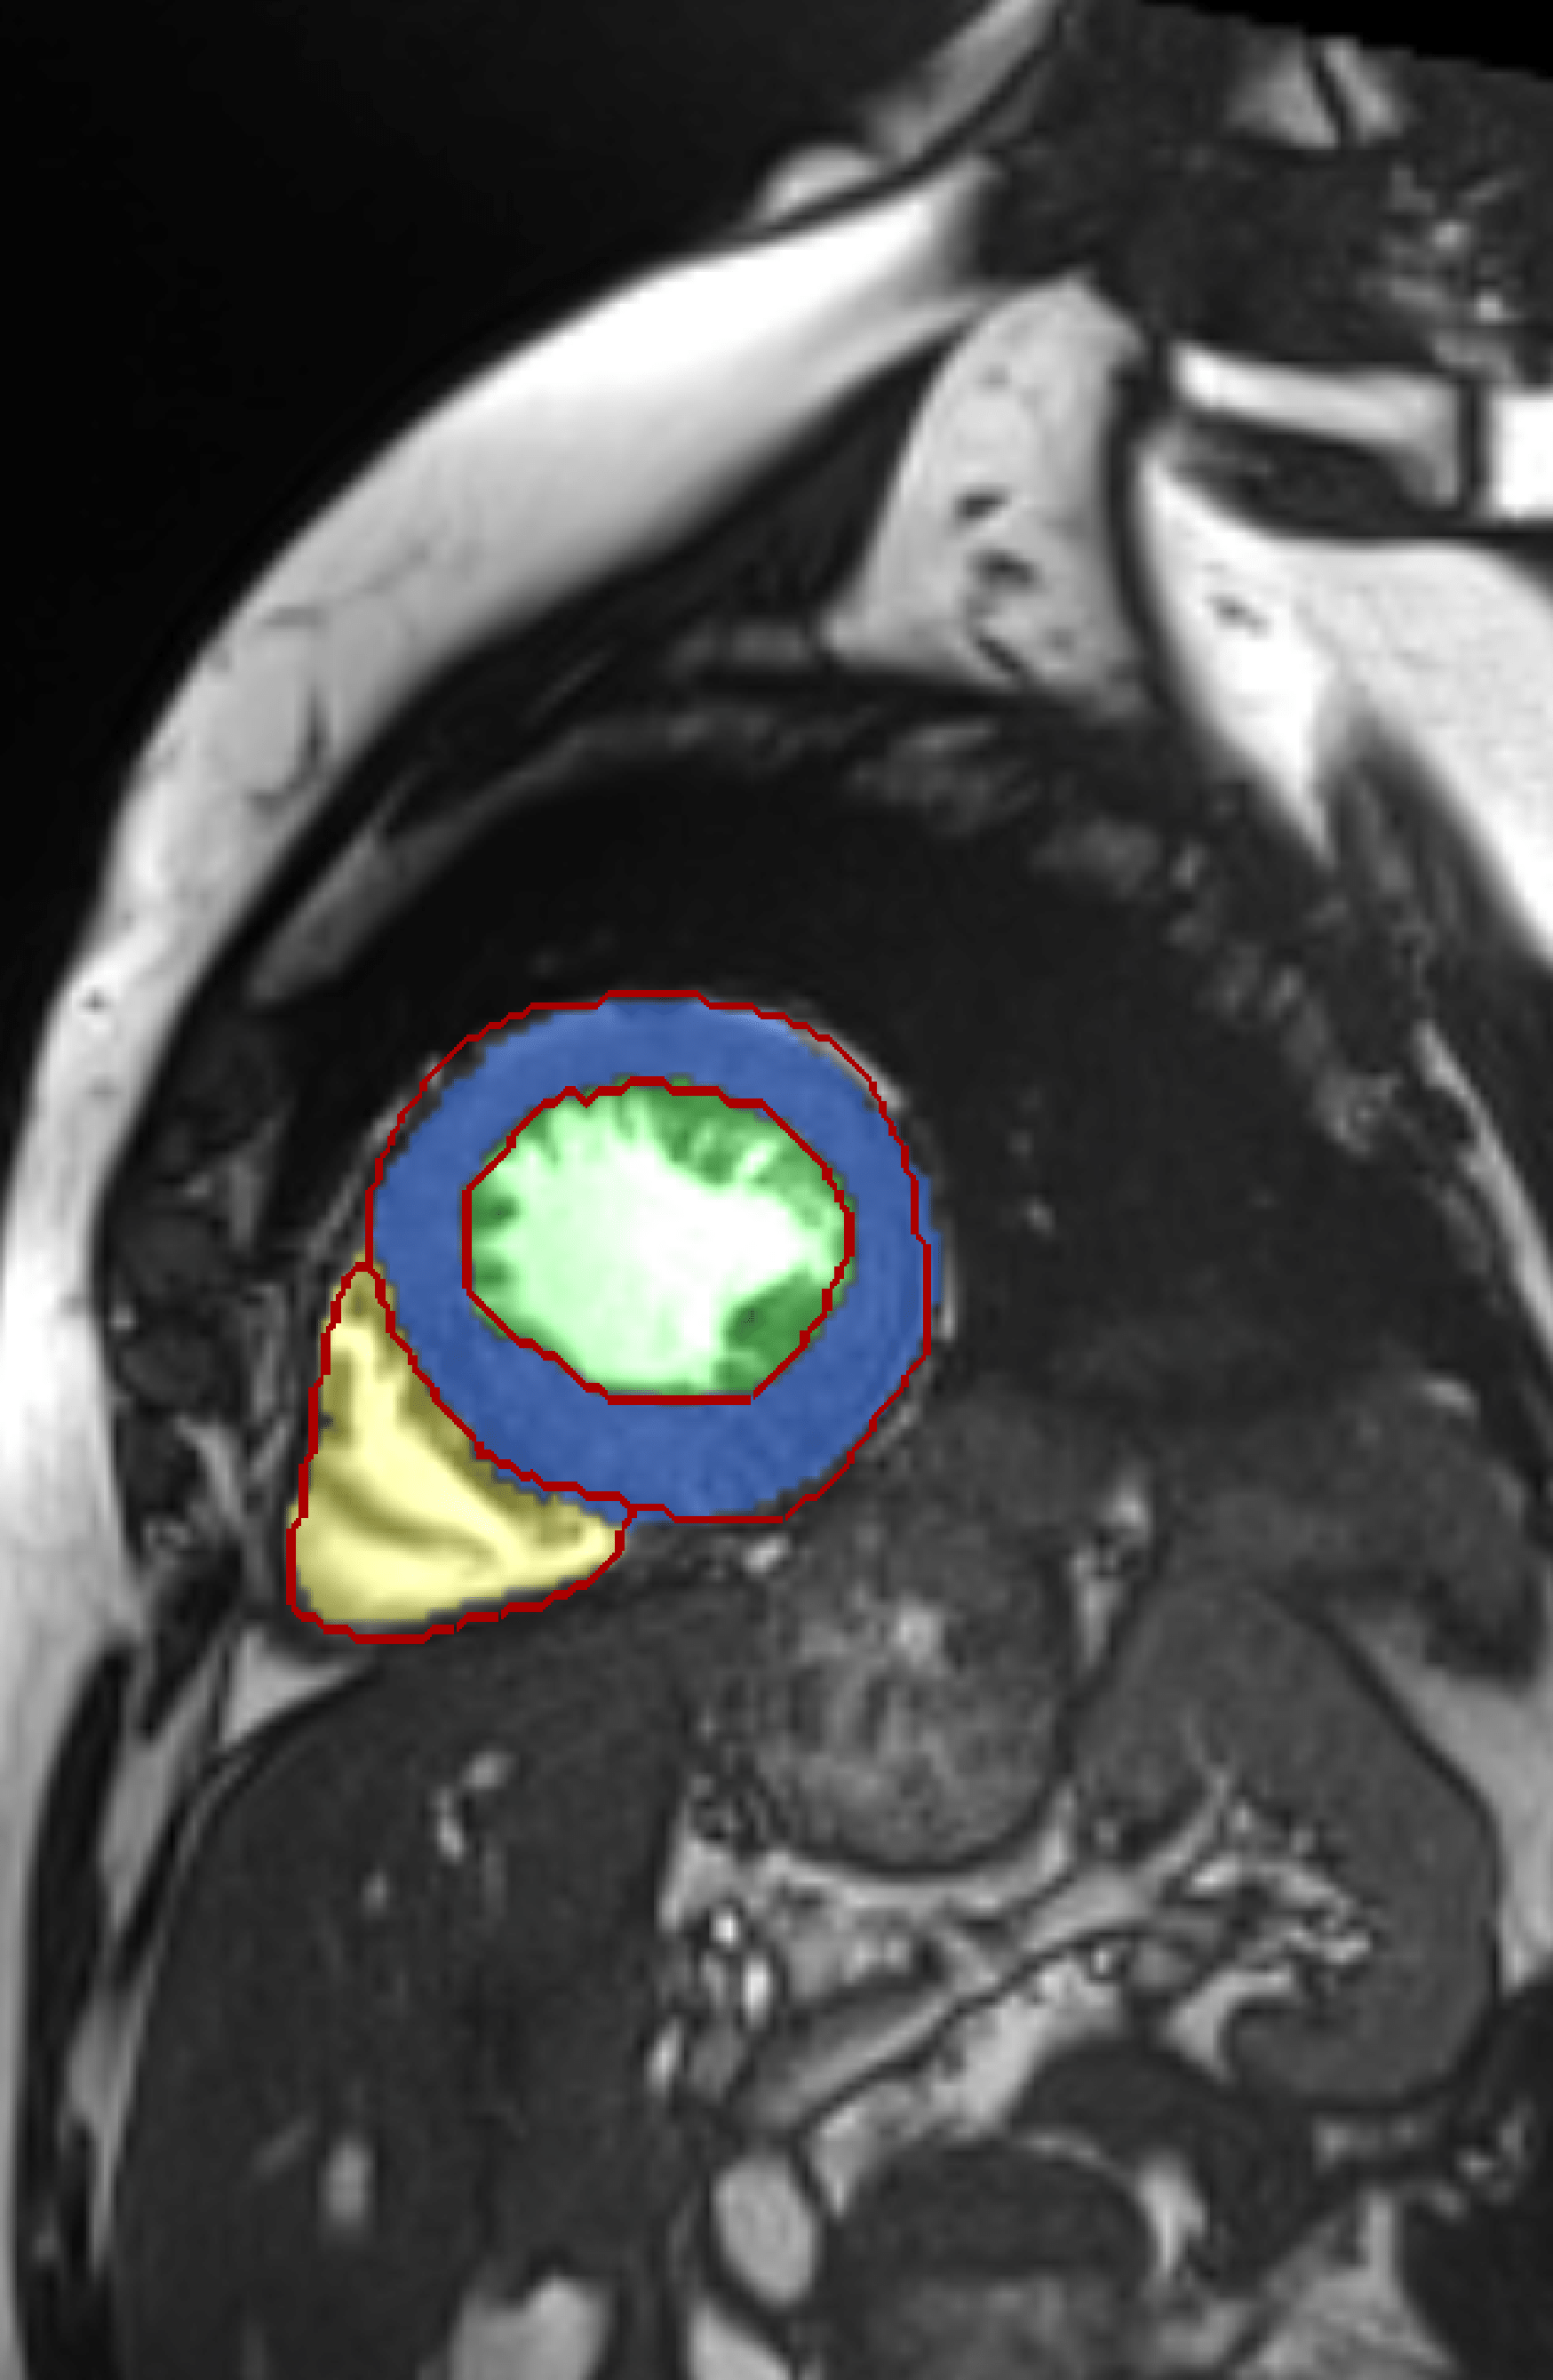
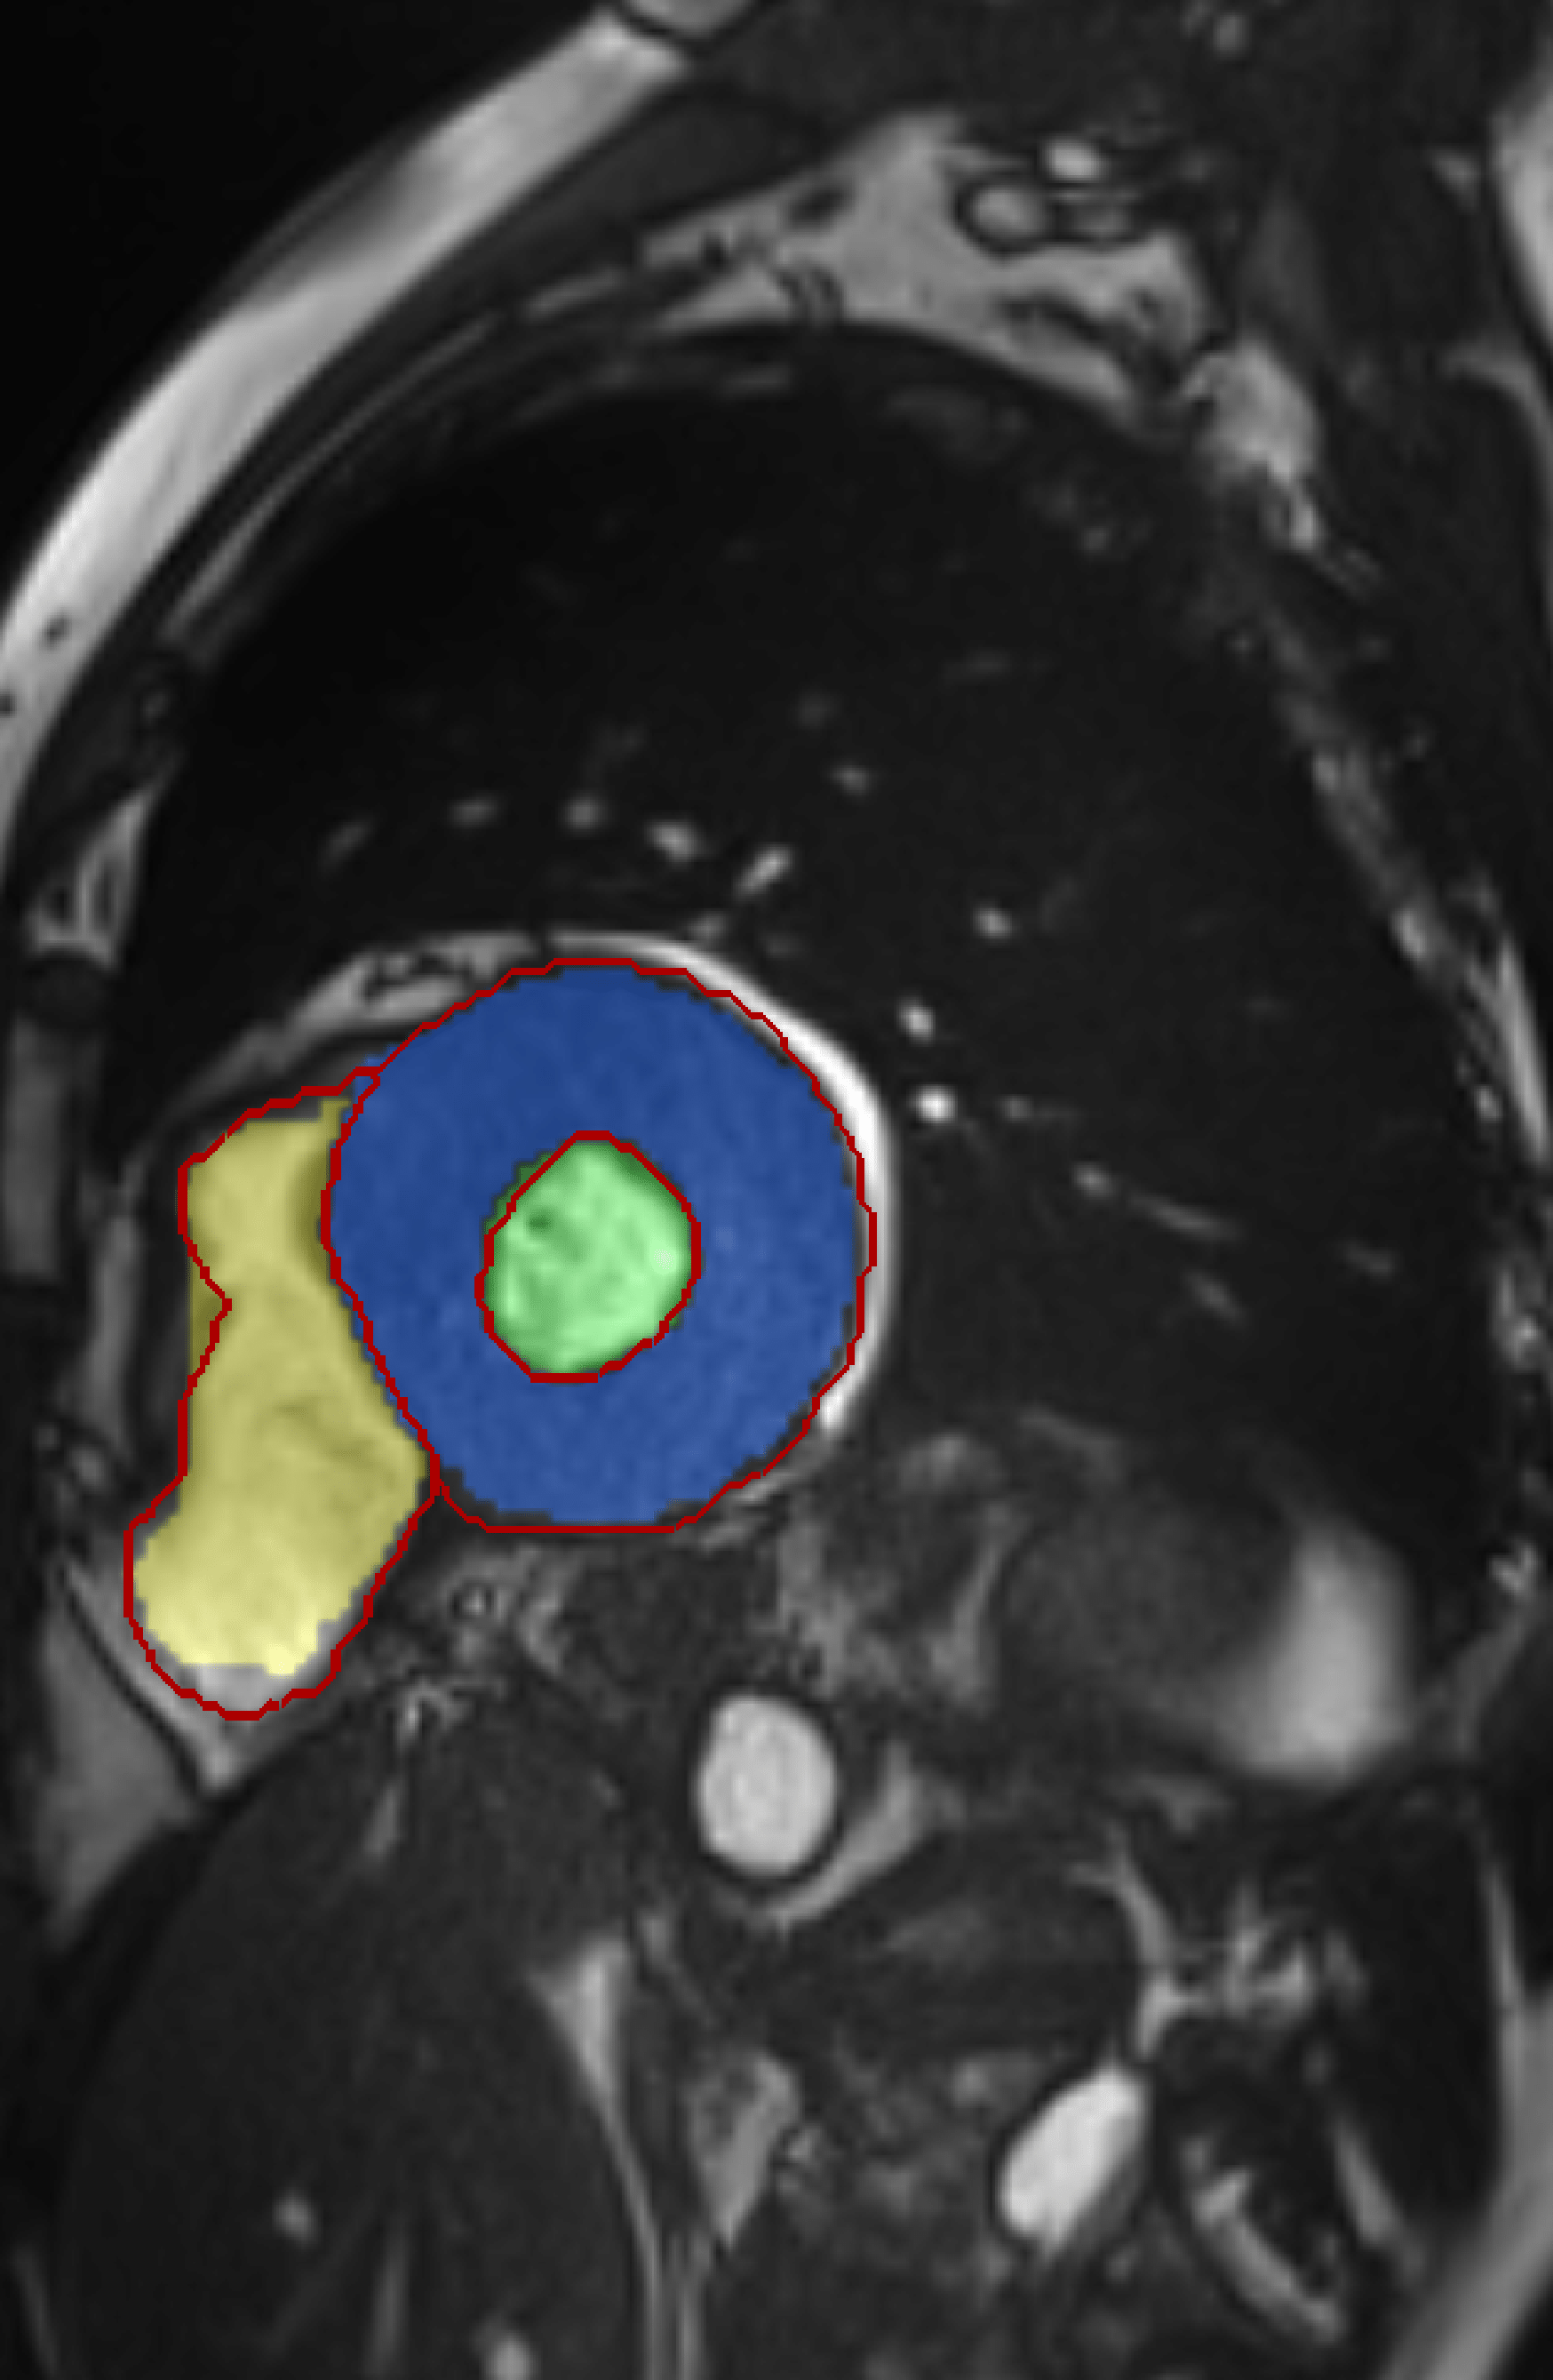
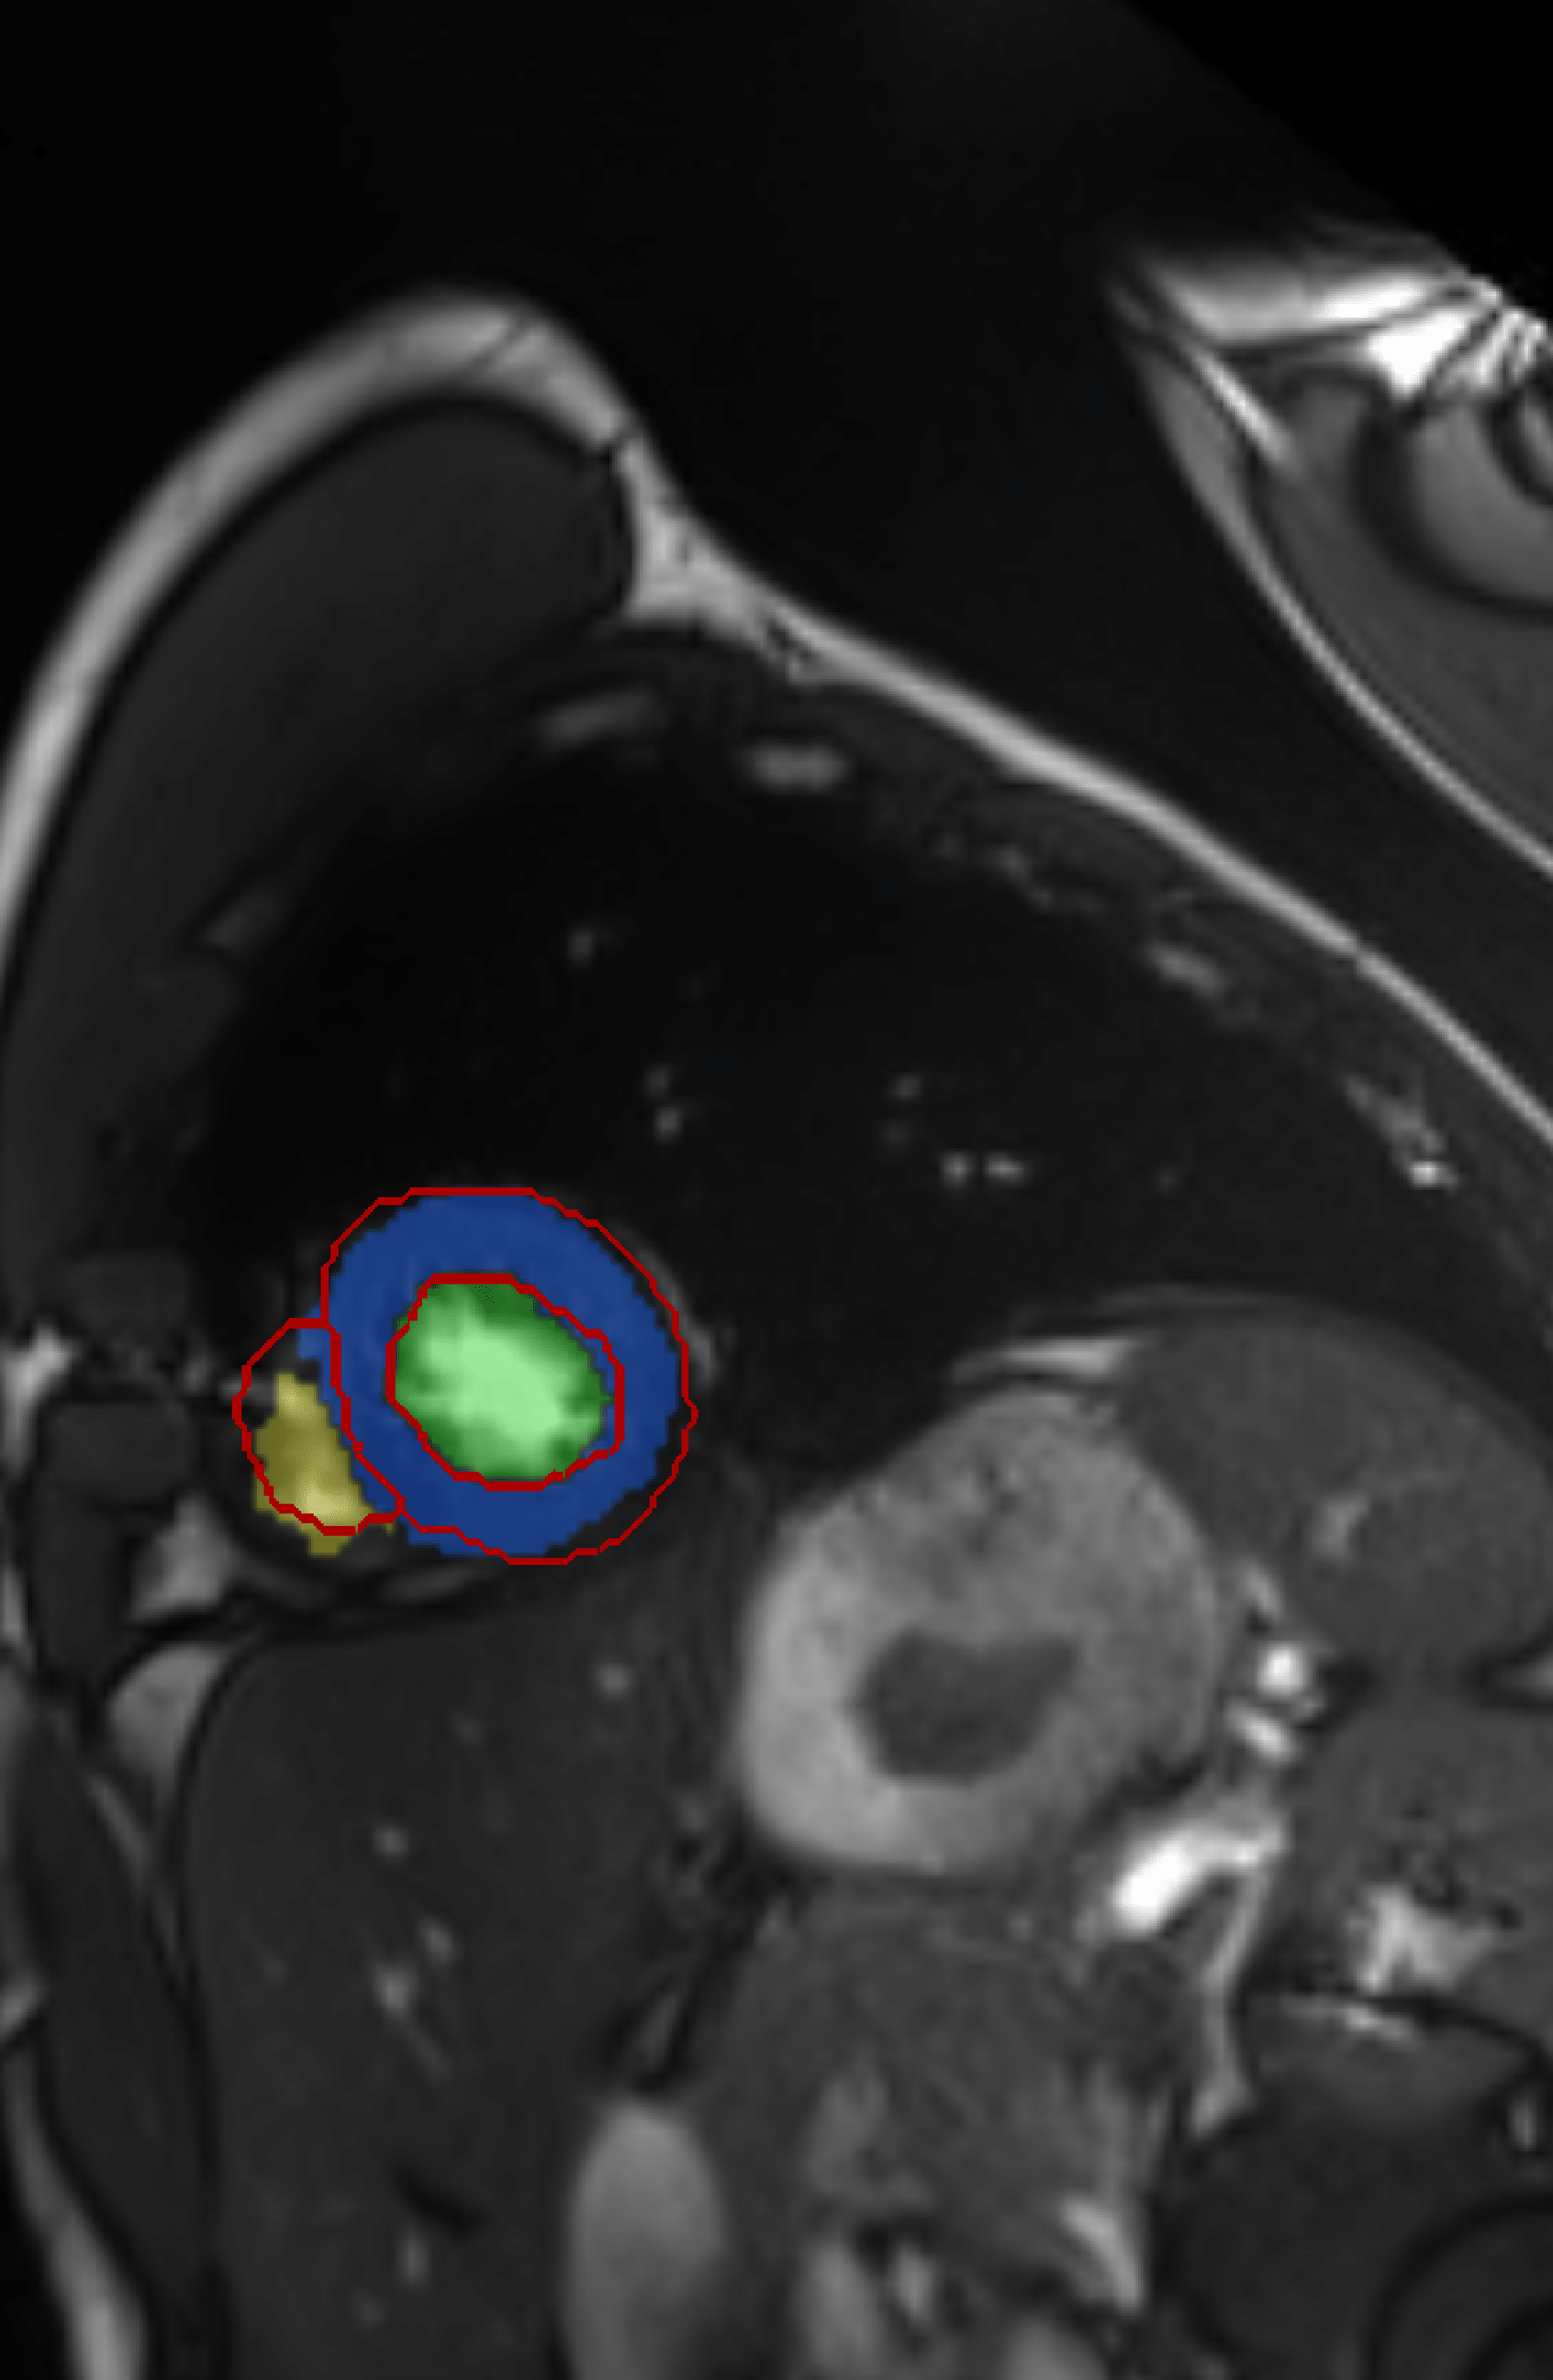
Fig. 2: Example segmentations obtained by the CNN in six different patients, showing the LV cavity in green, the RV cavity in yellow, and the myocardium in blue. Reference delineations are shown in red.
Table 1: Average Dice coefficients (Dice) and Hausdorffdistances (HD, in mm) for LV, RV and myocardium segmentation at ED and ES.
11.31 ± 5.62
15 training patients from each of the five classes and evaluated using five test patients from each of the five classes. Quantitative indices used to train the Random Forest in a fold were obtained with the trained CNN for that fold.
Hence, training and validation set were completely separated throughout both stages. We here present combined results on all 100 training images.
Segmentation Results
Fig. 2 shows example segmentations and the corresponding reference delin- eations. All obtained segmentations were evaluated using the online platform provided by the organizers of the ACDC challenge. Table 1 shows Dice coeffi- cients and Hausdorffdistances for LV, RV and myocardium segmentation at ED and ES. Agreement with the reference standard was highest for the left ventricle at ED, and lowest for the right ventricle at ES. Performance was substantially higher in ED than in ES for the LV and RV, but not for the myocardium. Aver- age Hausdorffdistances were lower for the LV than for the RV and myocardium.
This might be caused by the strong contrast that is typically present between the LV and the surrounding myocardium, and the poorer contrast between the myocardium and its surrounding structures. Furthermore, the shape of the RV is more irregular than that of the LV (Fig. 2).
In addition to the Dice coefficient and Hausdorffdistance, the agreement between reference and automatically derived quantitative indices was determined using the ACDC challenge online platform. Fig. 3 shows Bland-Altman plots with limits of agreement and Pearson correlations for the agreement between LV, RV and myocardium volume or mass quantification at ED and ES, as well as the
Related Journal Articles & DOI Links
Selected peer-reviewed publications relevant to 12 Lead ECG Acquisition. Click the DOI to access the full paper (may require institutional access).
-
1. Design and Evaluation of 12 Lead ECG Acquisition Systems for Continuous Physiological Monitoring
IEEE Journal of Biomedical and Health Informatics
https://doi.org/10.1109/JBHI.2020.2981234 -
2. Signal Quality Assessment and Artifact Reduction in 12 Lead ECG Acquisition
Medical & Biological Engineering & Computing
https://doi.org/10.1007/s11517-020-02145-6 -
3. Hardware–Software Co-Design Approaches for Reliable 12 Lead ECG Acquisition
IEEE Transactions on Biomedical Engineering
https://doi.org/10.1109/TBME.2019.2895762 -
4. Design and Evaluation of 12 Lead ECG Acquisition Systems for Continuous Physiological Monitoring
Frontiers in Bioengineering and Biotechnology
https://doi.org/10.3389/fbioe.2020.00123 -
5. Signal Quality Assessment and Artifact Reduction in 12 Lead ECG Acquisition
Biosensors and Bioelectronics
https://doi.org/10.1016/j.bios.2021.112345 -
6. Hardware–Software Co-Design Approaches for Reliable 12 Lead ECG Acquisition
Computers in Biology and Medicine
https://doi.org/10.1016/j.compbiomed.2021.104567 -
7. Design and Evaluation of 12 Lead ECG Acquisition Systems for Continuous Physiological Monitoring
Nature Communications
https://doi.org/10.1038/s41467-020-12345-6
Why Choose Us?
Bangalore guidance for robotics, Spectre and autonomous systems projects.
Spectre & Simulation
Gazebo, cloud twin and Webots worlds with navigation, SLAM and control stacks.
Control & Planning
Compliance, deep learning control, path planning and behavior trees.
Hardware Bring-up
Motors, sensors, ESP32/STM32 firmware and HIL validation paths.
Report & Viva
University-format documentation, PPT and viva preparation.
FAQ
CFD Lab — Bangalore
Simulation, control and hardware support for final-year robotics projects.
Stacks
Worlds
Digital Twin
Control
Robots
Offline
Bring-up