Atrioventricular Valve Closure
Nicolas R. Mangine1†, Devin W. Laurence1,2†, Patricia M. Sabin1, Wensi Wu1,2, Christian Herz1, Christopher N. Zelonis1,
Justin S. Unger1,2, Csaba Pinter3, Andras Lasso4,
Steve A. Maas5, Jeffrey A. Weiss5, Matthew A. Jolley1,2* Children’s Hospital of Philadelphia, Philadelphia, PA, US. 2Division of Cardiology, Children’s Hospital of Philadelphia, Philadelphia, PA, USA.
3EBATINCA, Las Palmas de Gran Canaria, Las Palmas, Spain. †These authors contributed equally to this work.
Abstract
Purpose: Many approaches have been used to model chordae tendineae geome- tries in finite element simulations of atrioventricular heart valves. Unfortunately, current “functional” chordae tendineae geometries lack fidelity (e.g., branching) that would be helpful when informing clinical decisions. The objectives of this work are (i) to improve synthetic chordae tendineae geometry fidelity to consider branching and (ii) to define how the chordae tendineae geometry affects finite element simulations of valve closure.
Methods: In this work, we develop an open-source method to construct syn- thetic chordae tendineae geometries in the SlicerHeart Extension of 3D Slicer.
Arxiv:2411.09599V1 [Physics.Med-Ph] 14 Nov 2024
The generated geometries are then used in FEBio finite element simulations of atrioventricular valve function to evaluate how variations in chordae tendineae geometry influence valve behavior. Effects are evaluated using functional and mechanical metrics.
Results: Our findings demonstrated that altering the chordae tendineae geom- etry of a stereotypical mitral valve led to changes in clinically relevant valve metrics (regurgitant orifice area, contact area, and billowing volume) and valve mechanics (first principal strains). Specifically, cross sectional area had the most influence over valve closure metrics, followed by chordae tendineae density, length, radius and branches. We then used this information to showcase the flexibility of our new workflow by altering the chordae tendineae geometry of two additional geometries (mitral valve with annular dilation and tricuspid valve) to improve finite element predictions.
Conclusion: This study presents a flexible, open-source method for generat- ing synthetic chordae tendineae with realistic branching structures. Further, we establish relationships between the chordae tendineae geometry and valve functional/mechanical metrics. This research contribution helps enrich our open- source workflow and brings the finite element simulations closer to use in a patient-specific clinical setting.
Keywords: finite element analysis, FEBio, SlicerHeart, chordae tendineae
1 Introduction
Atrioventricular valve (AVV) disease is associated with significant morbidity and mor- tality in both the developing and developed world. Mitral valve (MVR) and tricuspid valve regurgitation (TVR) are thought to affect 5 million and 1.6 million peo- ple in the U.S., respectively. A healthy MV and TV will adequately control the flow of blood between the atria and ventricles on the left and right sides of the heart, respectively. Consequently, failure of these AVVs can result in inefficient blood cir- culation leading to end-organ dysfunction (e.g., liver, lung, kidney), or death. MVR is associated with an increased risk of congestive heart failure and stroke and is the most prevalent form of AVV failure [3, 4]. The TV, while previously described as the “forgotten valve”, has increasingly been the subject of important investigations as part of an effort to better treat TV dysfunction. AVV failure is similarly devastating to both children and adults with congenital heart disease, and in particular to single ventricle patients [6, 7].
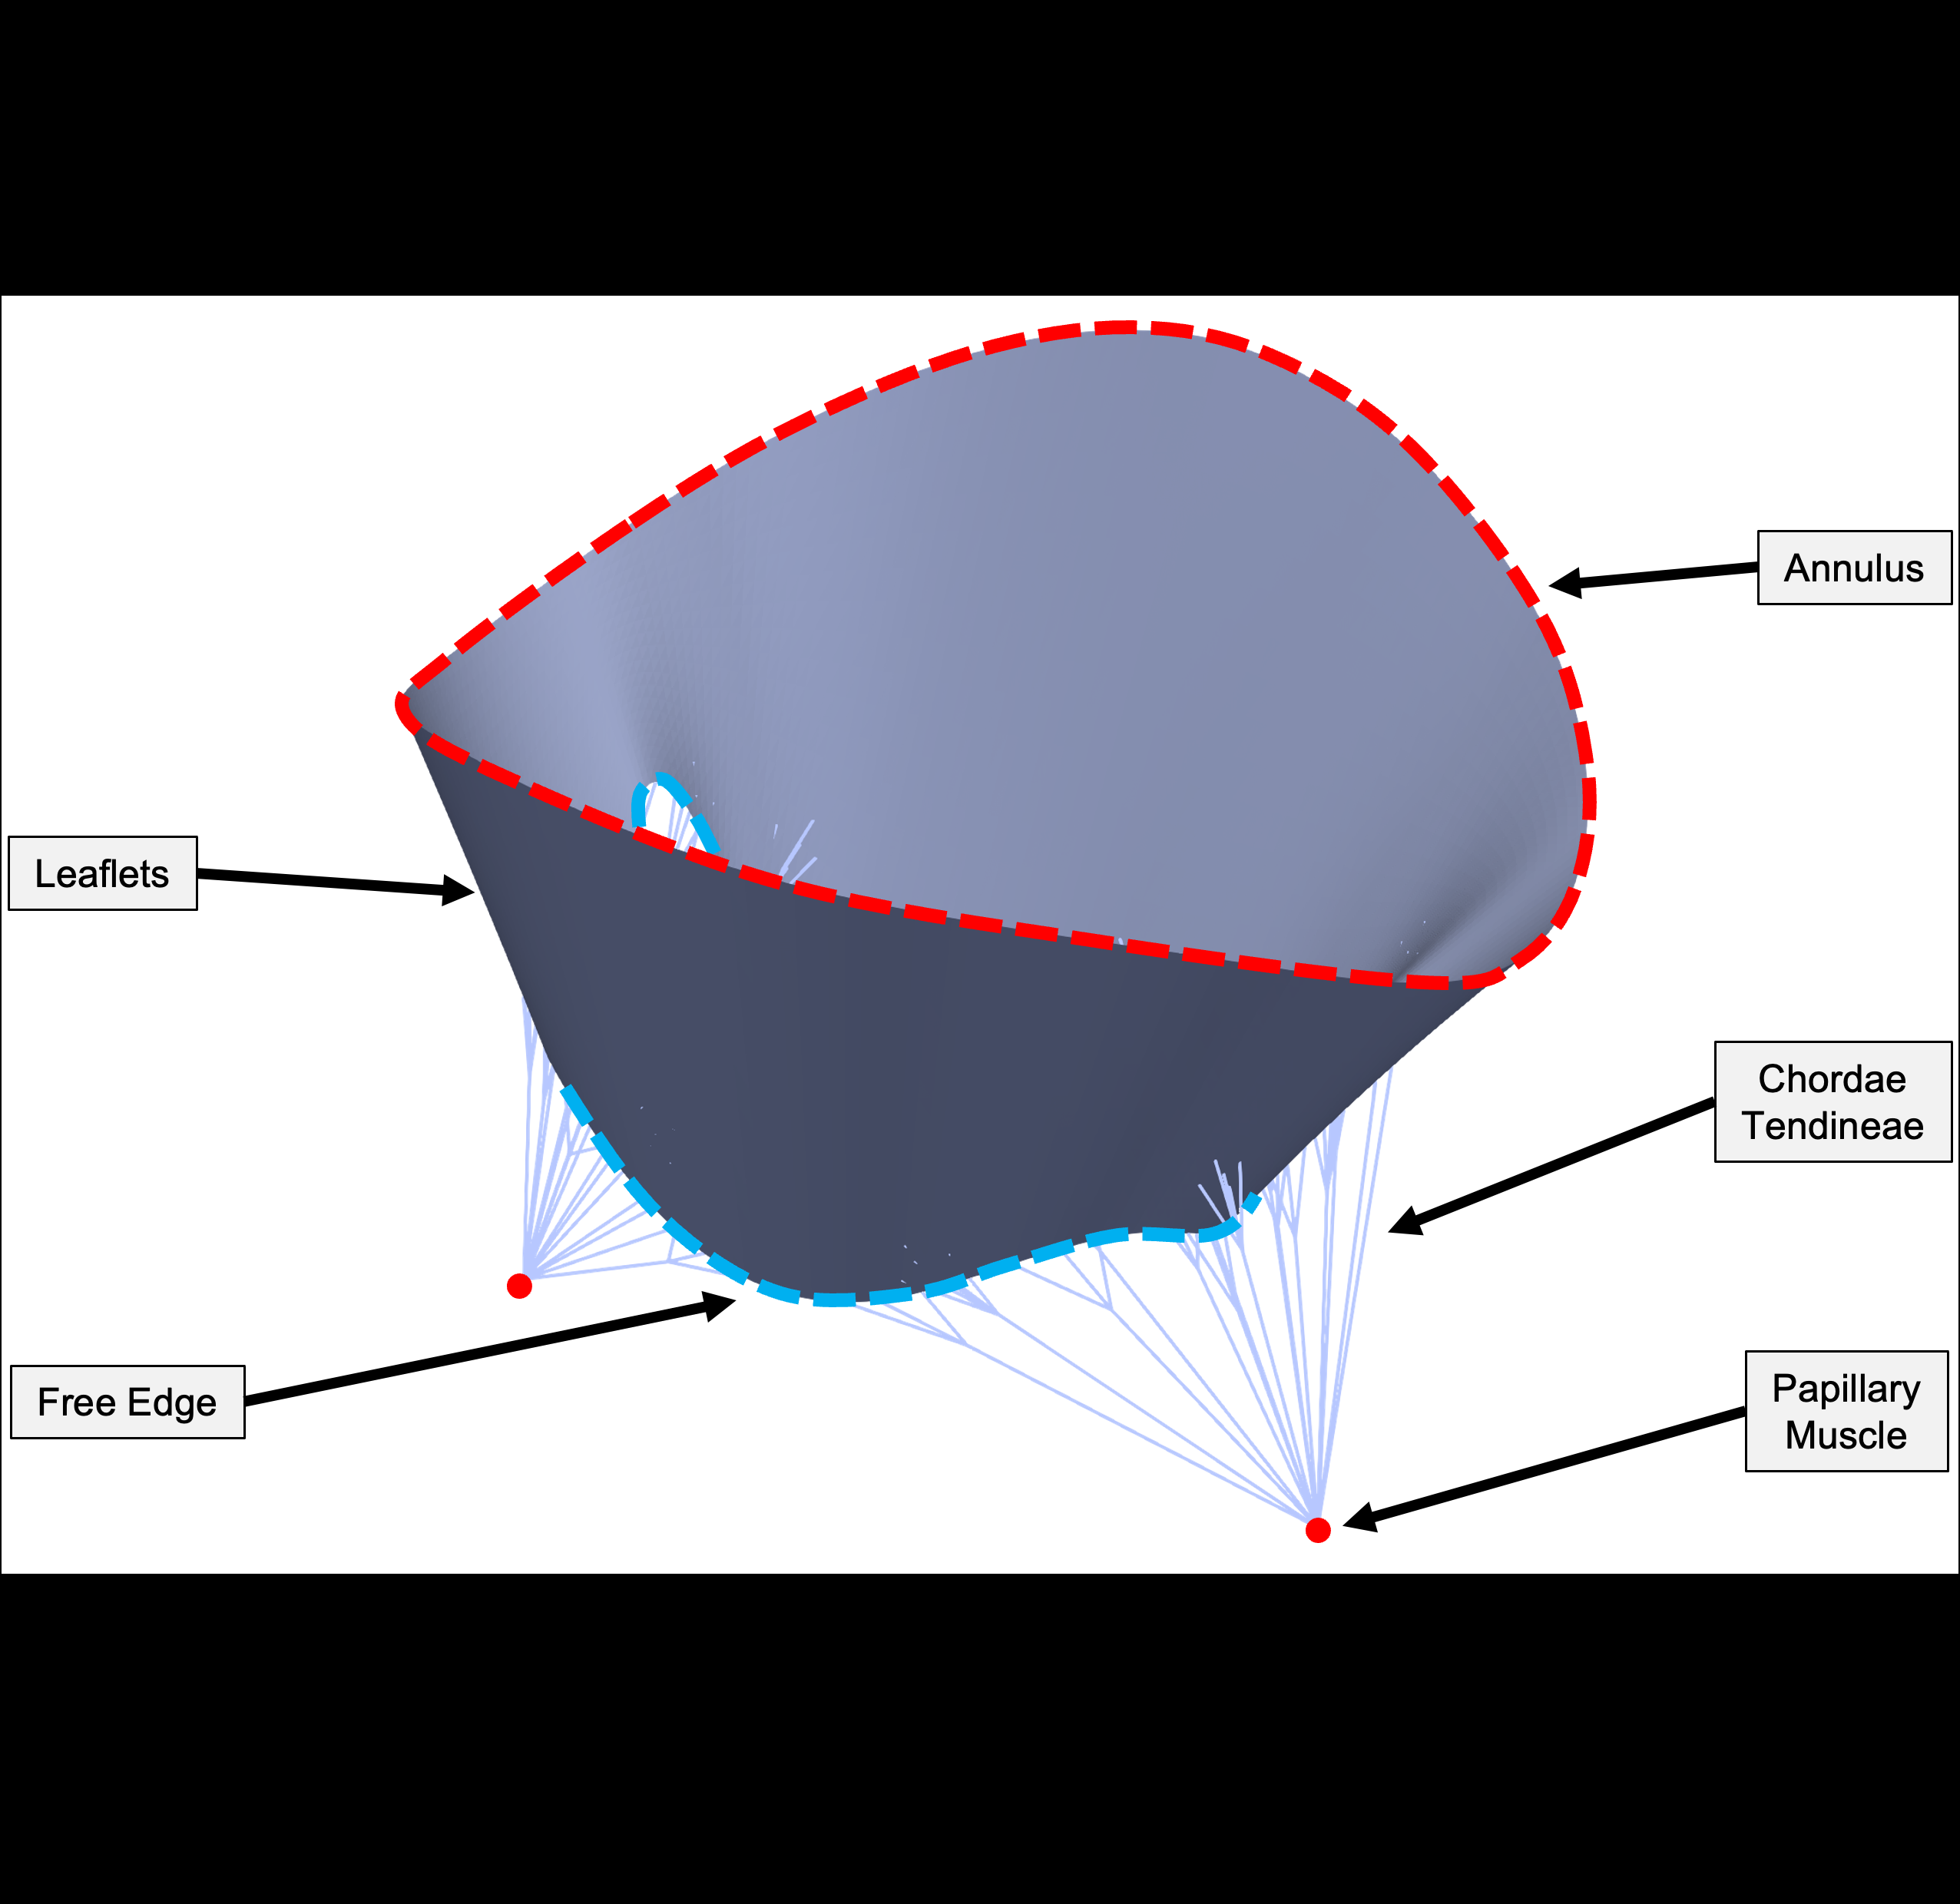
The core anatomy of an AVV consists of leaflets, a ring-shaped annulus attaching the leaflets to the heart wall, and chordae tendineae (CDT) that anchor the leaflets to the papillary muscles (PM) in the ventricle wall (Fig. 1). Morphological changes or failure of any of these components can lead to an incompetent valve that allows blood to flow backward from the ventricle to the atrium during ventricular contrac- tion, leading to atrioventricular valve regurgitation (AVVR) [8, 9]. Based on etiology, the factors of AVVR have been categorized as either primary (e.g., direct) or sec- ondary (e.g., indirect) in terms of its effects on the AVV [3, 4, 10]. Myxomatous valve
2
Fig. 1 Unloaded mitral valve with key anatomical features. degeneration is an example of primary AVVR that is characterized by elongated CDT and prolapsing leaflets stemming from decreased stiffness of both CDT and leaflet tis- sue [11, 12]. In contrast, ischemic cardiomyopathy is an example of secondary AVVR related to left ventricular dilation and remodeling [3, 13, 14].
In both primary and secondary AVVR cases, impaired CDT can contribute to valve dysfunction and failure given the essential role they play in normal AVV function [15, 16]. In primary AVVR, CDT rupture can result in leaflet prolapse. While in secondary cases, elevated chordal tension in the setting of ventricular dilation, or ischemia-related alterations to the ventricle, can lead to CDT restriction of leaflet motion and reduction in leaflet contact (coaptation). Congenitally abnormal CDT structures in children, such as those seen in parachute or arcade AVV [17, 18], play a deleterious role in valve function. Consequently, chordal tension and direction plays a significant part in the successful repair of complex congenital heart disease with valvular abnormalities such as complete atrioventricular canal and hypoplastic left heart syndrome [6, 15, 19–22].
3
Given the essential role of CDT in valve function, significant effort has been made to develop therapies directed at replacing or altering chordal geometry to achieve improved AVV function. These interventions are dependent on CDT mechan- ics, especially as related to their physical classification. Specifically, CDT classified as “primary” are inserted within leaflet free edge and prevent leaflet prolapse dur- ing ventricular contraction. Secondary CDT, embedded in leaflet body, support the mechanical interaction between AVV and ventricle, with additional stability within the leaflet basal area provided by tertiary CDT . Thus, precise assessment of insertion location, and optimal chordal length, is necessary to understand valve func- tion and to achieve desired therapeutic outcomes. This includes surgical interventions such as: neochordae reconstruction where artificial primary CDT are created to restore function to a prolapsing valve ; and PM relocation where CDT-to-leaflet insertion vectors are modified to improve valve function [21, 22, 27–29]).
In this context, realistic representation and fidelity of CDT topology is also critical to emerging computational simulations of AVV function . Notably, finite element (FE) and other multi-physics simulations of AVV function are uniquely positioned to investigate mechanisms of valve dysfunction. In addition, when combined with patient-specific three-dimensional (3D) images (e.g., 3D echocardiography, computed tomography, cardiac magnetic resonance imaging), these computational techniques have the potential to inform iterative preoperative optimization of valve repair “in silico” . However, while advances in 3D imaging provide a reliable and non- invasive means of determining valve leaflet structure [15, 35–39], modern clinical imaging cannot yet reliably resolve CDT geometry at their individual chordal inser- tions with the accuracy and fidelity of “ground truth” geometries achieved from ex vivo and pathological specimens [30, 40].
As a result, significant effort has gone into creating image-informed [27, 41–43] or functionally equivalent CDT topology for the computational simulation of valve function. Most relevant to the present work, Khalighi et al. demonstrated that CDT geometries could be simplified to random insertions of CDT-like structures without branching. These functionally equivalent CDT topologies provided similar predictions as CDT geometries created from high-fidelity ex vivo images of ovine hearts. Although the simplified CDT geometries could predict valve behavior, they do not have realistic features (i.e., branching) necessary to model CDT-related pathology or interventions (e.g., chordal rupture or neochordae). As such, others have created FE models with various implementations of branching CDT geometries [33, 34, 44].
However, the sensitivity of FE simulations of valve function to variations in chordal branching patterns and distributions remains unknown. Furthermore, there is not an existing procedural method for the precise parametric and reproducible creation of specific chordal branching patterns, geometries and density.
The objectives of this work are thus to (i) define how CDT geometry affects FE predictions of AVV closure and (ii) to compare FE simulation results of the more real- istic branched CDT geometries to simpler non-branching CDT geometries previously used by ourselves [32, 45] and others . In order to achieve this analysis we created a novel open-source module in SlicerHeart to procedurally generate chordal branch- ing geometries . We then employed this framework to quantify how variation of
4
five CDT parameters influenced clinically relevant metrics of valve closure metrics in three realistic atrioventricular valve models.
2.1 Geometry Creation
Three synthetic AVV geometries were created to understand how CDT geometry influences valve closure: a stereotypical MV geometry, the stereotypical MV geometry with a dilated annulus, and a stereotypical TV. The Non-Uniform Rational B-Spline (NURBS) surfaces representing the leaflets were used in our new parametric CDT cre- ation tool to procedurally generate CDT geometries with branching structures. Specific details regarding the study scenarios are provided in Section 2.3. This tool was imple- mented as a scripted Python module of 3D Slicer within the SlicerHeart extension.
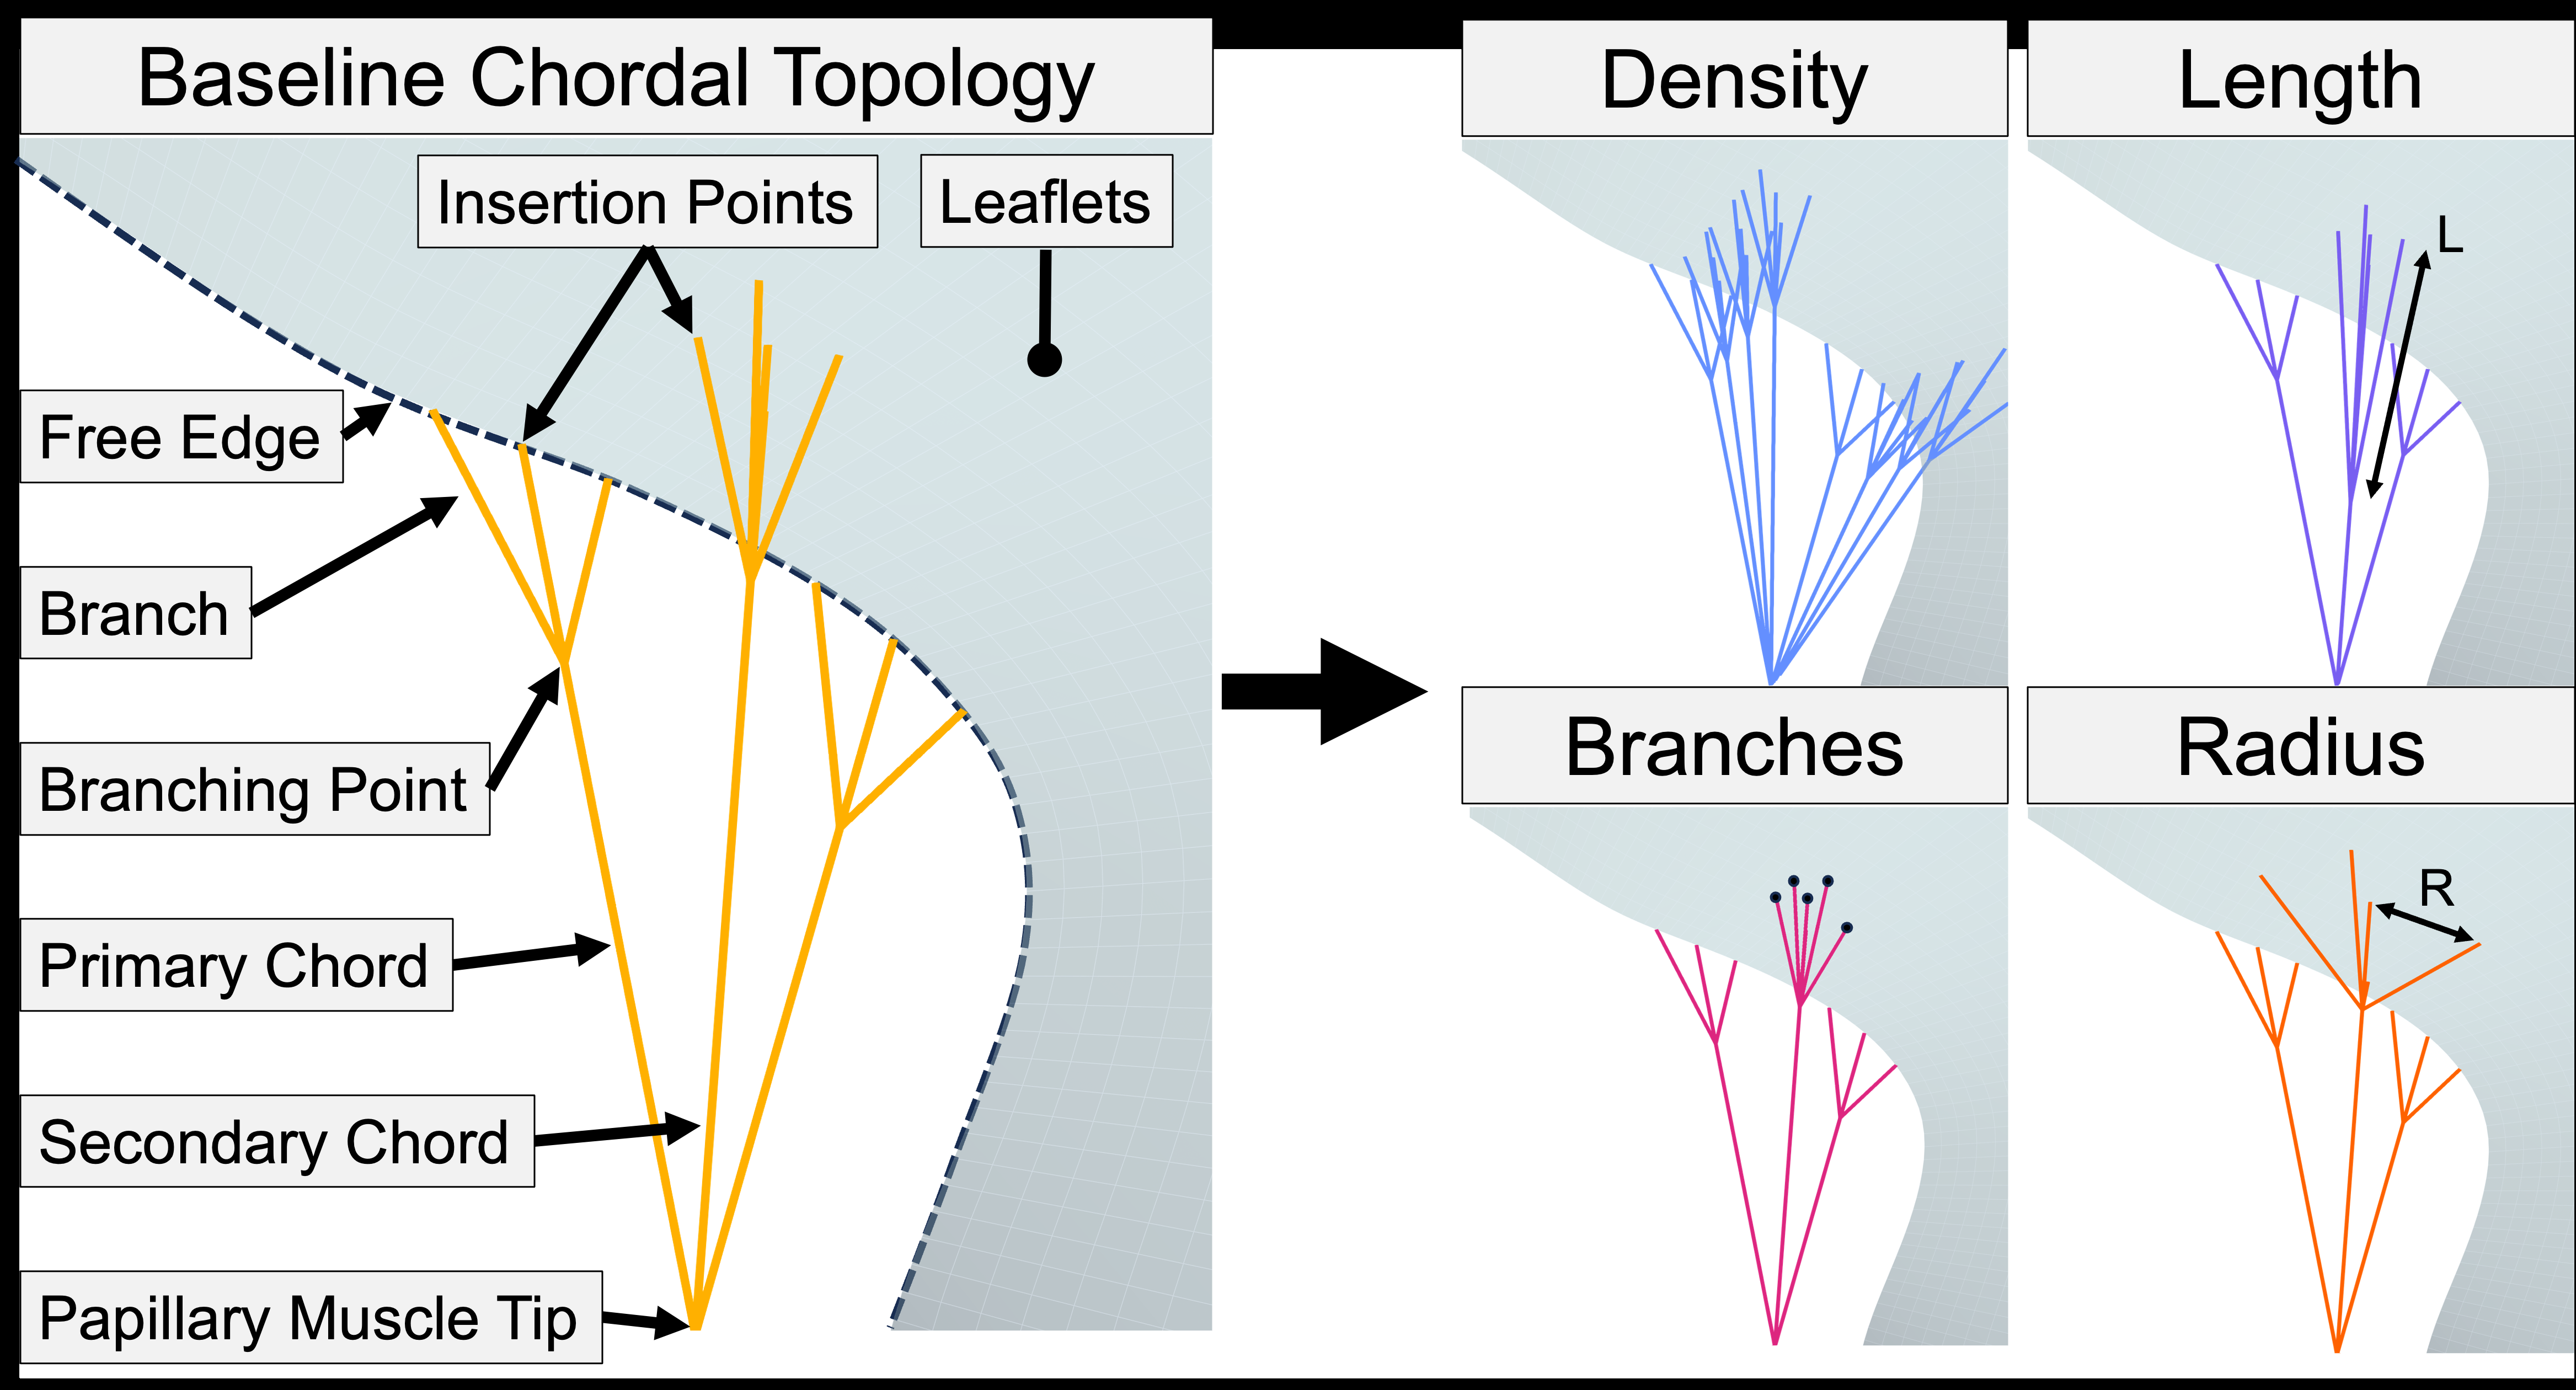
The module offers a comprehensive user interface and the necessary logic functions for CDT generation based on user selection. Step-wise schematics are provided in Figure 2. First, a finely meshed leaflet surface is generated for CDT geometry creation.
Next, the PM tips, valve surface, and CDT insertion regions are selected in the module interface. The user then defines CDT geometry parameters, including: CDT type (pri- mary, secondary, or both), insertion density, number of branches, branching length, and branching radius. Finally, the CDT are generated with chords emanating from the closest PM tip into each insertion region (See Video S1 in the Supplementary Material section for the procedure). This CDT creation tool is implemented in the SlicerHeart extension (www.slicerheart.org) for 3D Slicer as the ValveFEMExport module.
All code is available open source at www.github.com/SlicerHeart. Fig. 2 Method for varying the parameters of the chordae tendineae. Baseline topology can be mod- ified by CDT density, length, number of branches, and branching radius.
2.2 Finite Element Simulation
FE analysis of the valve closure was performed using our established workflow in FEBio [32, 45, 47]. The MV and TV CDT were modeled as newly implemented lin- ear truss elements with a prescribed modulus of 150 MPa and cross sectional area (CSA) of 1.0, and 0.44 mm2 respectively in FEBio . The leaflets were discretized using 4-node linear quadrilateral shell elements (quad4) with assumed thickness of 0.396 mm . The nonlinear material behavior of the leaflets was modeled via the nearly incompressible isotropic Lee-Sacks constitutive model with strain energy
(1)
Here, c0 = 200 kPa, c1 = 2968.4 kPa, c2 = 0.2661 are material coefficients for the MV and c0 = 10 kPa, c1 = 0.209 kPa, c2 = 9.046 are material coefficients for the TV. Near incompressibility was enforced with a bulk modulus of 5000 kPa and 10000 kPa for the MV and TV, respectively. I1 is the first invariant of the right Cauchy deformation tensor C = FT F, and F is the deformation gradient. Zero displace- ment boundary conditions were applied to the annulus and PM tip nodes. A linearly increasing systolic pressure (100 and 23.7 mmHg for the MV and TV respectively) was applied to the ventricular leaflet surface over 0.005 s. Leaflet contact was mod- eled using a potential-based formulation . Dynamic analysis was performed using the generalized-alpha integration rule, mass damping for both the leaflets and CDT (C = 5000 Ns/m), and the FEBio automatic time stepping algorithm (∆tmin = 10−8 s and ∆tmax = 10−4 s). Quasi-static analysis was sought but dynamic analyses were performed to achieve better simulation convergence .
2.3 Study Scenarios
We performed several investigations to understand how CDT geometry influences FE predictions of AVV function. First, we used our existing synthetic MV geometry to compare the refined CDT geometry generated using our new approach to the simplified CDT geometry used in our prior work and that of others. The “baseline” MV CDT geometry was then parametrically varied to understand how changes to the CDT structure influence AVV closure. Finally, the understanding gained via the synthetic MV geometry was extended to generate CDT geometries for two additional AVVs: one MV with a dilated annulus and one TV.
2.3.1 Establishing Baseline CDT Geometry for the Synthetic MV A stereotypical, healthy MV geometry was created to evaluate the effect of CDT geometry on valve closure (see Section 2.1). Our prior CDT generation workflow (based on the work of Khalighi et al. ) generated a simplified CDT geometry with 115 insertions. We successfully used our new parametric workflow (see Section 2.1) to obtain 114 insertion points with the following parameters: primary CDT density of 2 chords/cm, secondary CDT density of 3 chords/cm2, branch length of 3.5 mm, number of branches as 3 and 4 for primary and secondary CDT respectively, and insertion radius of 1 mm. We compared the FE simulation results using these two CDT
6
geometries (fully simplified and branched) as a first step towards understanding how increased CDT fidelity may influence the FE predictions. It should also be noted that CDT density is quantified in our study in terms of leaflet free edge insertion distance (chords/cm) for primary chords, and leaflet surface area of insertion (chords/cm2) for secondary chords.
2.3.2 Mesh Convergence Study
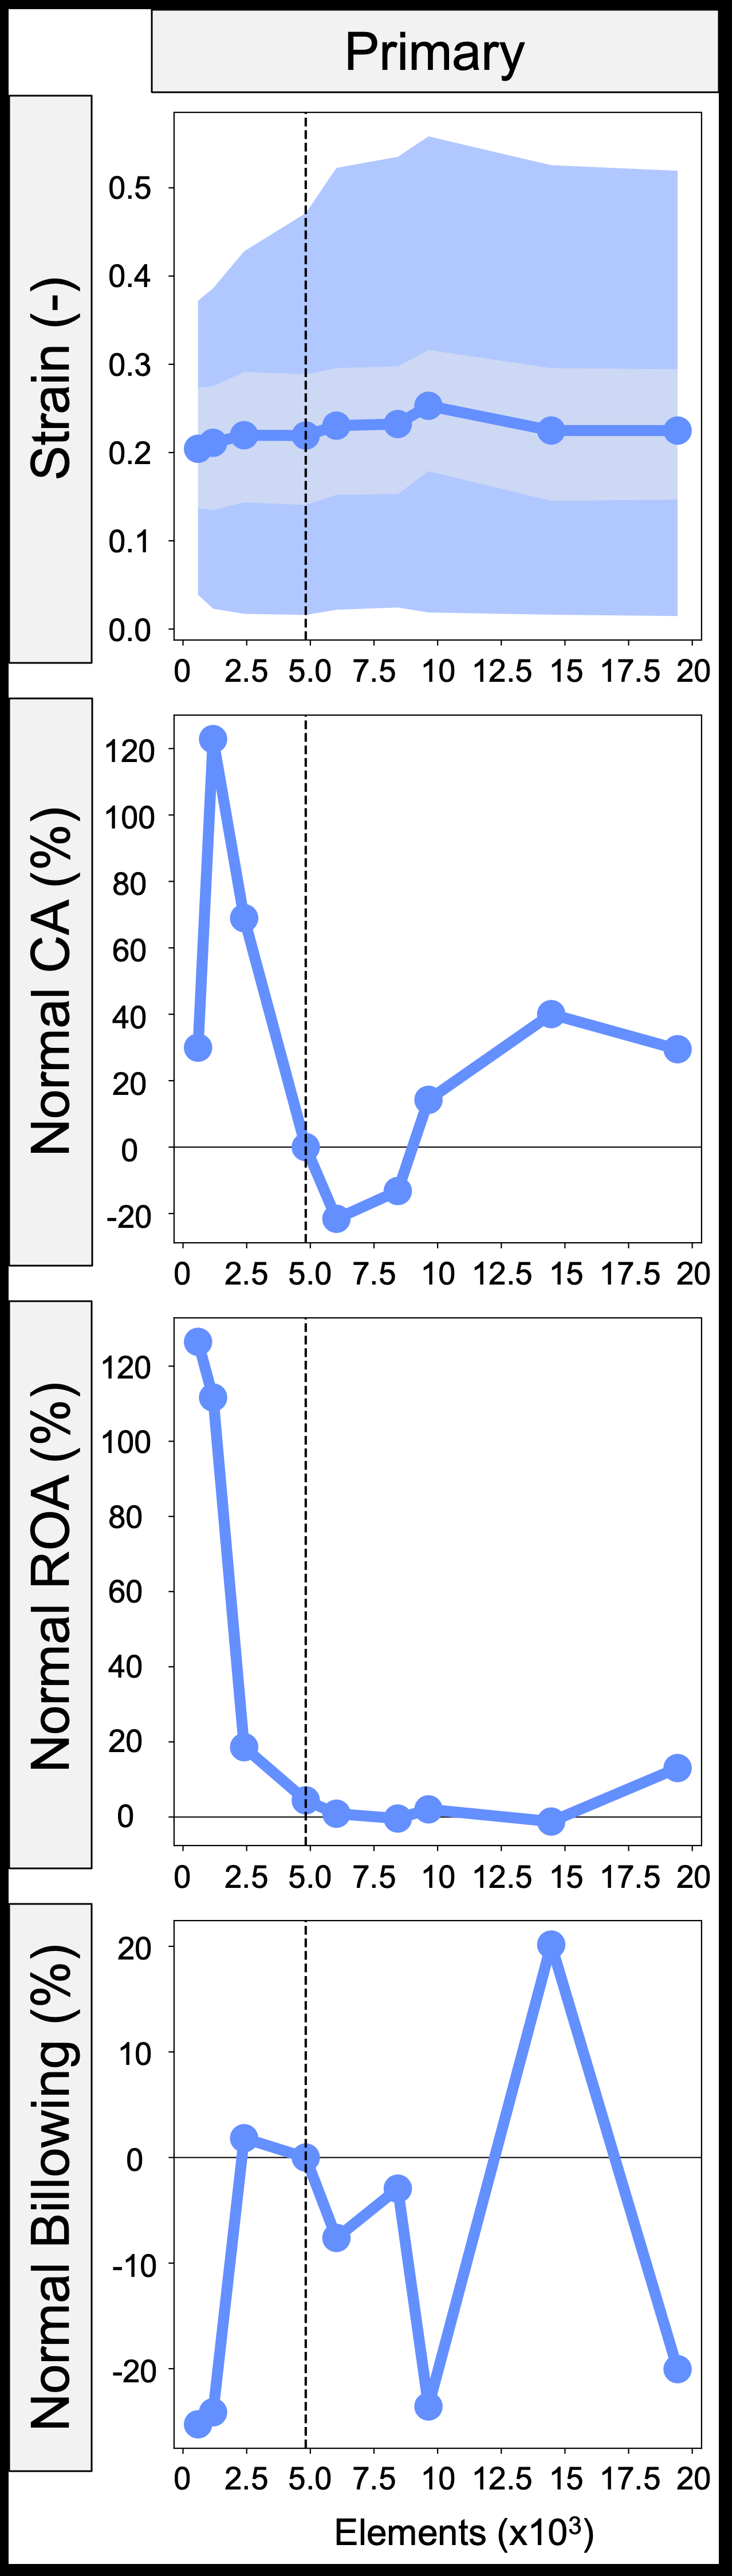
We performed an initial study to understand how mesh density may influence our find- ings. In brief, the FE mesh for the synthetic MV was refined using HyperMesh (Altair, Troy, MI), resulting in a wide range of FE mesh densities (2500-20000 elements). The MV function was simulated using our FE simulation workflow in FEBio (Section 2.2).
The functional and mechanical metrics (see Section 2.4.1) were compared across mesh densities. 2.3.3 Parametric Variations of Primary CDT Geometry The baseline MV was then used to evaluate primary CDT influence on valve closure.
The primary CDT density (1-3 chords/cm), branch length (1-10 mm), branch quantity (2-5), and branching radius (0.4-1.8 mm) values were varied using the ValveFEMExport module (Section 2.1). These ranges were chosen based on the minimum available values in the SlicerHeart module and the point when chordae insertion points began overlapping (except for branch length). Additionally, we varied the primary CDT CSA (0.2-2.0 mm2) in FEBio based on values reported by Ross et al. .
2.3.4 Parametric Variations of Secondary CDT Geometry After establishing the role of primary CDT, we used the baseline MV to evaluate how secondary CDT influence valve closure. Both primary and secondary CDT were included based on preliminary simulations that showed primary CDT were needed to prevent localized leaflet free edge prolapse. We varied the secondary CDT density (1- 10 chords/cm2), branch length (1-10 mm), branch quantity (1-5), and branch radius (0.4-3 mm). Similar to the primary CDT study, the minimum and maximum values were selected based on minimum values available in the SlicerHeart module and when CDT insertions began overlapping, respectively. Finally, the secondary CDT CSA was varied in FEBio from 0.2-2.0 mm2, while keeping the primary CDT constant at 1.0 mm2 based on values reported by Ross et al. .
2.3.5 Extension To Additional Avv Geometries
Two additional valves were created using the procedure outlined in Section 2.1: a MV with annular dilation (ADMV) and a TV. The ADMV was created by uniformly increasing the annulus of the healthy, synthetic MV by 10% while not altering the leaflet and commissure heights. The TV was adapted from Wu et al. and a gener- alized annulus was created from . Neither valve had a reference for CDT topology so the baseline CDT values from the normal MV were used and valve closure metrics were evaluated. Using the trends observed in the normal MV CDT studies, the CDT
7
parameters were then updated to create more realistic valve closure. This qualified as localized free edge leaflet prolapse for the ADMV and unrealistic regurgitant orifice area (ROA) for the TV.
2.4 Analysis
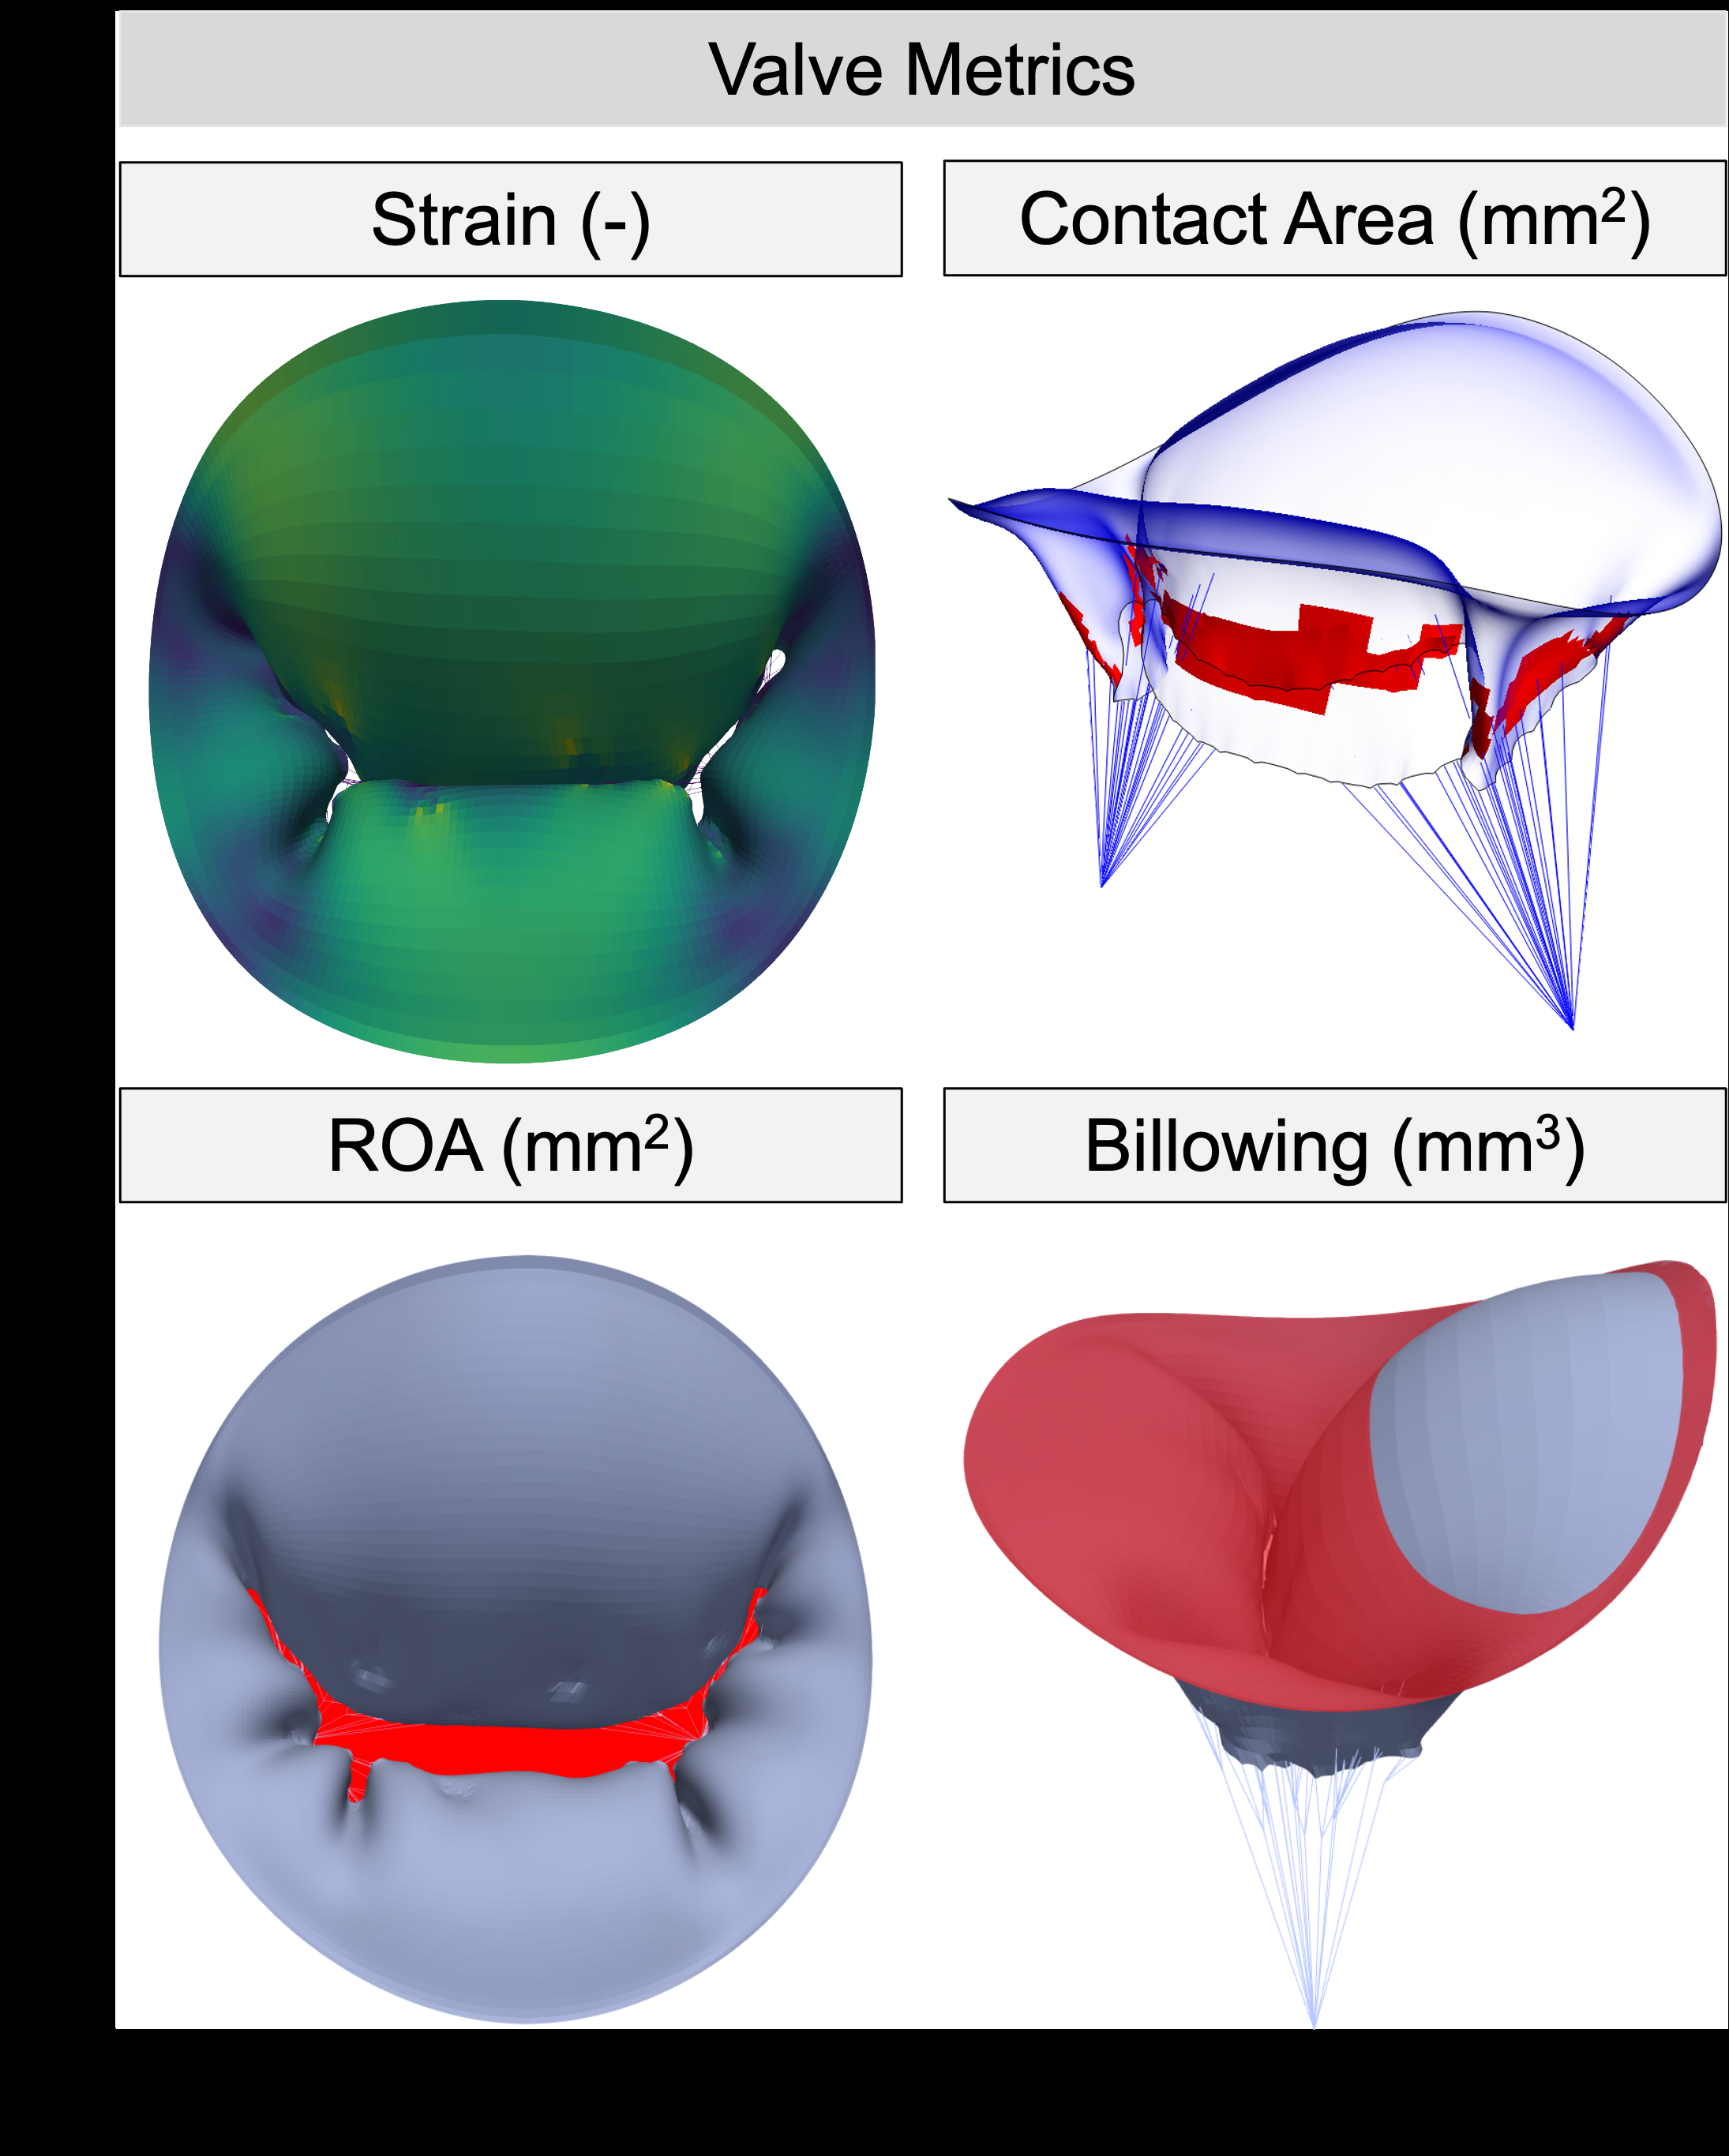
Fig. 3 Four valve metrics were identified to quantify valve closure. The medial surface of the mitral valve in its closed state is used to visualize strain, contact area (CA), and billowing volume, while a dilated geometry is used to show the regurgitant orifice area (ROA). Strain measurements are represented with a color map, CA, and ROA are shown in red, and the billowing volume is shown as the leaflet above the red annulus plane.
2.4.1 Mechanical And Functional Metrics
We evaluated the effect of CDT geometry using both functional and mechanical metrics. The ROA, contact area (CA), and billowing volume are clinically relevant functional metrics related to valve function that can inform valve repair. We used a fully-automated method to accurately quantify the ROA by coupling a shrink- wrapping method with raycasting . The CA was calculated by the surface area of the elements with non-zero traction applied by the contact algorithm . Billowing volume was calculated in Slicer’s Parametric Atrioventricular Valve module as the volume of leaflet above the annulus plane during ventricular contraction (Fig. 3).
Finally, we considered the first principal strain of the leaflets as the mechanical metric owing to its relationship with valve remodeling . Leaflet strain visualiza- tions include the median, 25% and 75% percentiles, and minimum/maximum values, whereas functional metric visualizations report the singular quantified value.
The ordinary least squares functionality of the Python statsmodels module was used to determine the presence of linear, quadratic, or exponential relationships between the valve metrics and CDT parameters. We considered three criteria to eval- uate regression quality: (i) the coefficient of determination (R2), (ii) the p-value of each regression coefficient, and (iii) visual inspection, particularly when considering the quadratic relationship (i.e., is the inflection point used to match the data). These findings were used as a quantitative foundation to interpret our results. Note that the regression coefficients are only relevant to the stereotypical MV geometry, and the trends may not hold when extrapolated due to the nonlinear behavior of the FE simulations.
2.4.2 Cdt Geometry Comparison
We compared FE predictions with varying CDT geometries in three ways to under- stand: (i) how parameters in the SlicerHeart module altered valve closure, (ii) whether CDT insertion density was the central driver of CDT function, and (iii) whether total CDT CSA was the central driver of CDT function. First, we normalized the valve functional metrics to values associated with the baseline CDT geometry—this was repeated for both the primary and secondary CDT geometry studies. Second, we com- pared functional metrics when varying CDT density and branch number to understand if trends were consistent across different CDT geometries with similar insertion point densities. This analysis aimed to test the hypothesis that CDT insertion density will influence valve behavior regardless of which CDT parameter altered the CDT density.
This hypothesis is based on prior work by Khalighi et al. that showed drastically simplified CDT geometries provided functionally equivalent behavior as ground truth CDT geometries from ex vivo imaging so long as CDT insertion point density was above a minimum threshold. Finally, we also compared the functional metrics across different CDT geometries with similar total CDT CSA. This analysis sought to test the hypothesis that total CDT CSA will influence valve functional metrics similarly regardless of how the total CDT CSA is varied (i.e., density, branch number, or CDT CSA). The presentation of our results follows this structure.
3.1 Branched Vs. Non-Branched Cdt
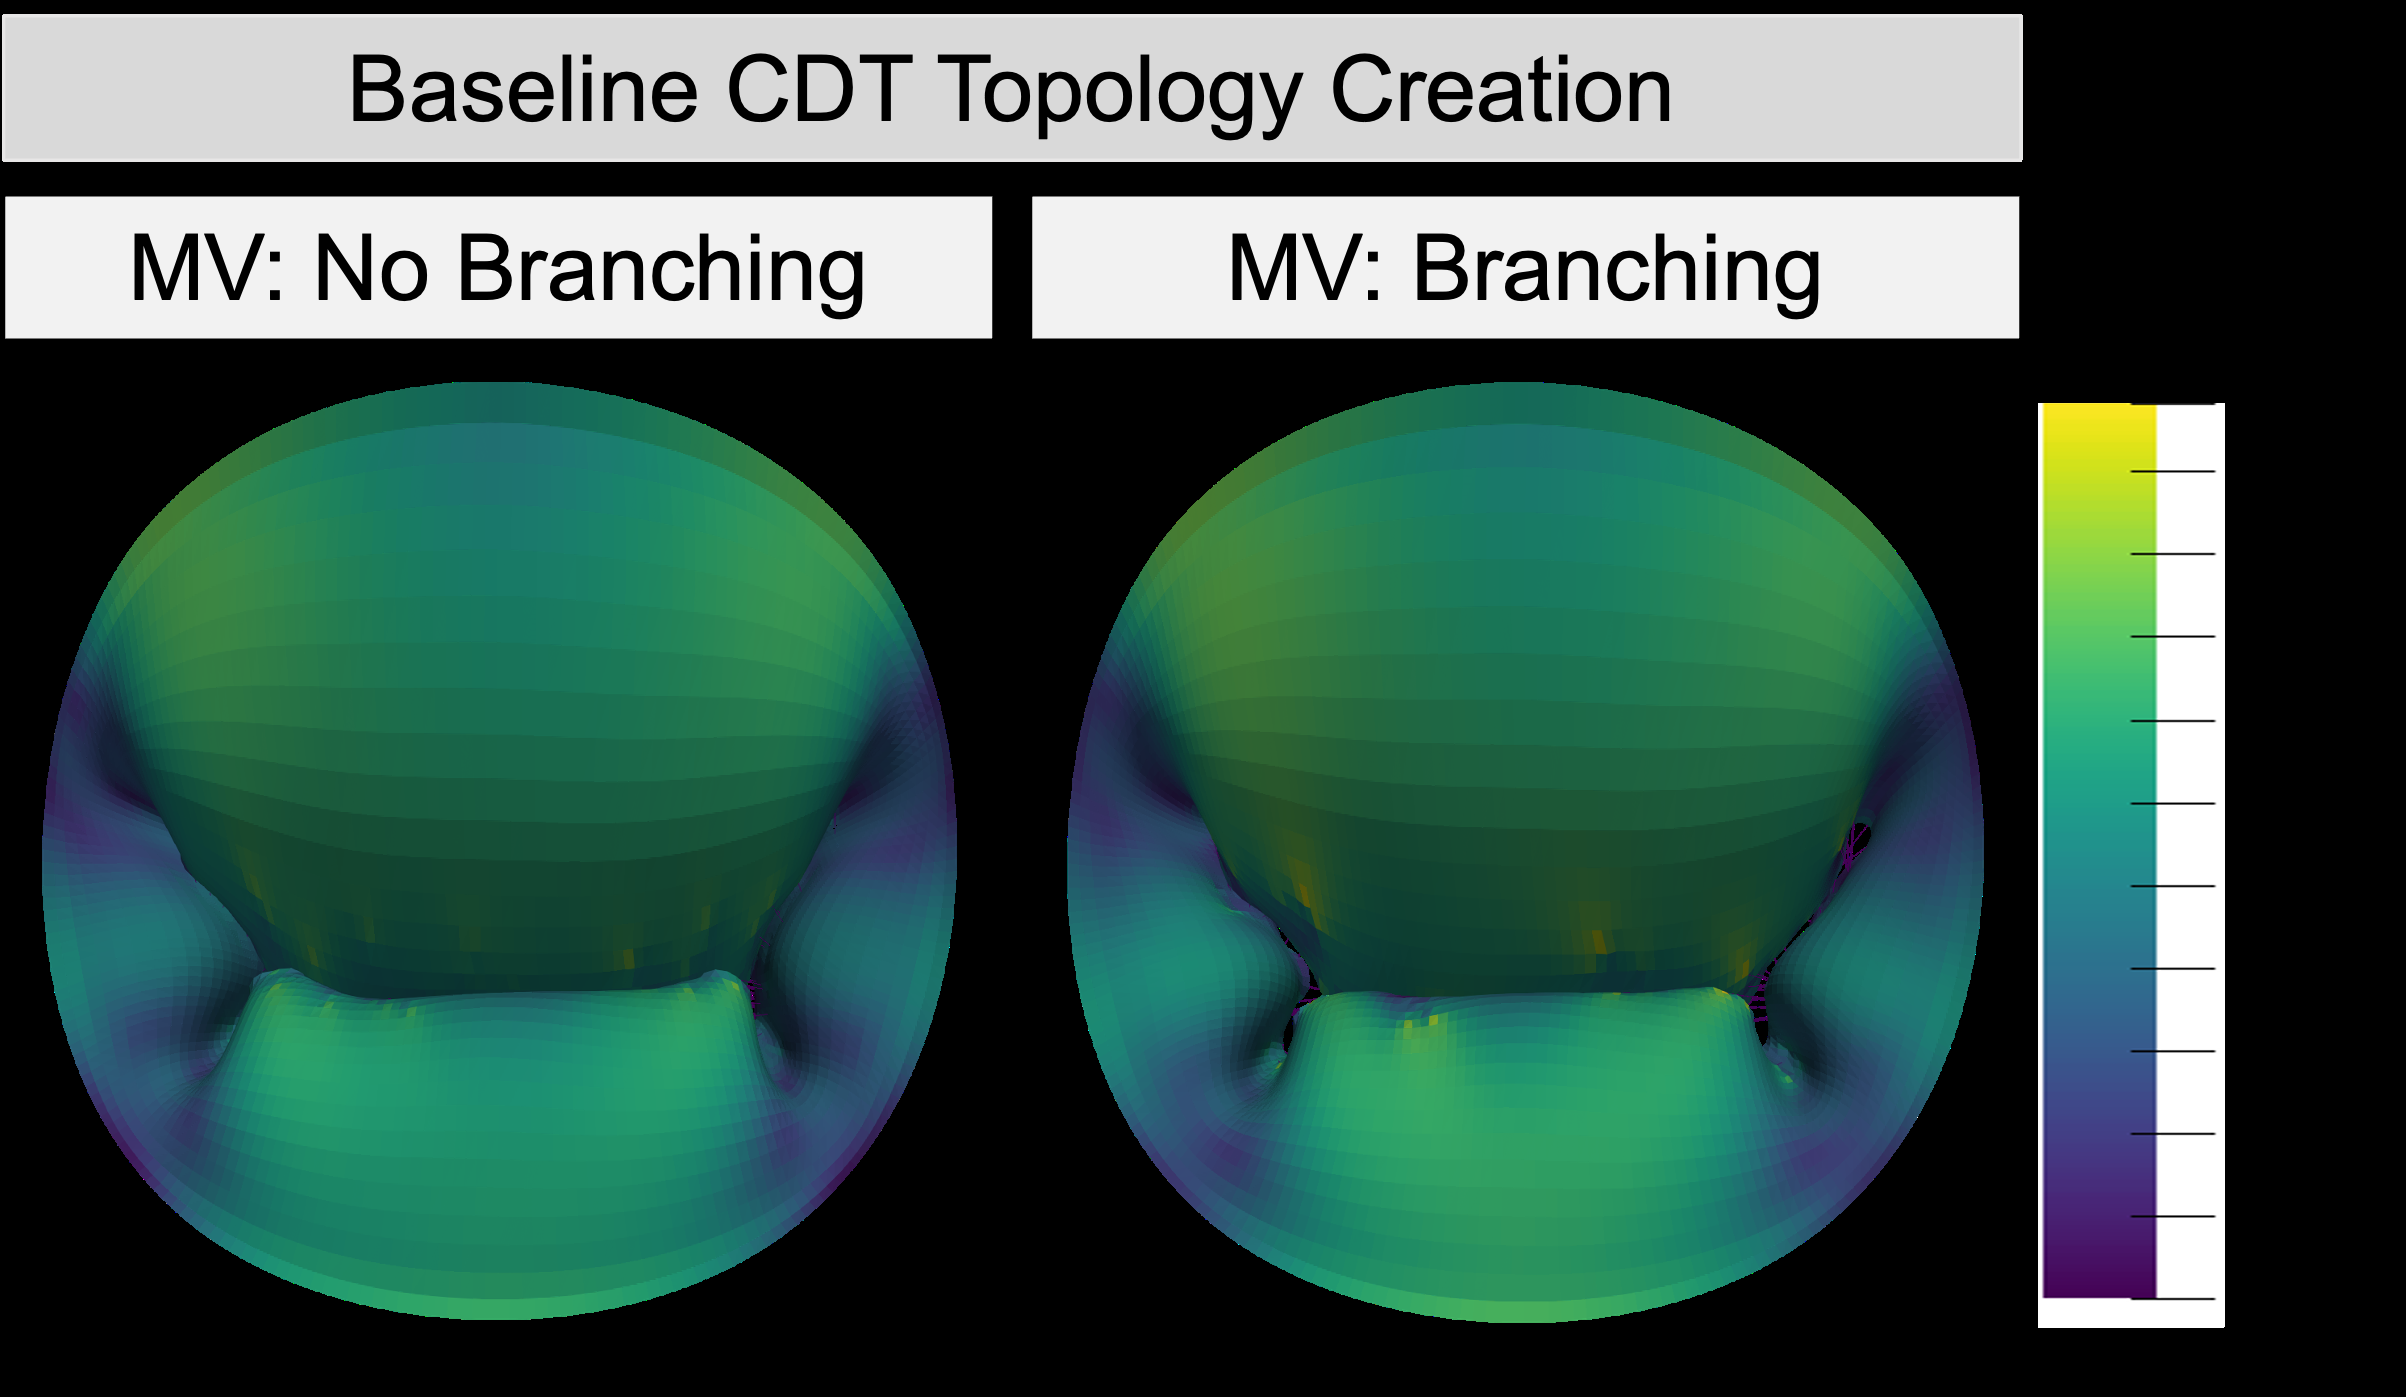
Despite having a similar number of insertion points, transitioning from the non- branched spring CDT to the truss models caused the valve closure to change. The maximum strain and ROA increased by 26% and 135%, respectively, while the CA and billowing volume decreased by 4.8% and 25% (Fig. 4).
Fig. 4 Lagrange strain color maps comparing a MV with non branching spring elements and 114 insertion points to our novel CDT creation method with branching linear truss elements and 115 insertion points.
3.2 Mesh Density
Results of the mesh convergence study are shown in Figure 5. A finite element mesh with 4820 elements was chosen for the parametric variation study presented in Sections 3.3 – 3.6 given this mesh density minimized simulation times to 227 seconds while still meeting criteria for FE model convergence of ROA with minimal variation in the strain metrics. Fluctuations in the CA and billowing volume beyond this mesh density may stem from localized changes in leaflet curvature that would influence these values; however, this effect should be minimized in our study results since the same mesh density was used throughout.
10
Fig. 5 Different FE mesh sizes were evaluated in relation to the valve closure metrics (strain, ROA, CA, billowing volume) with a 4820-element mesh chosen for the parametric variation study.
3.3 Primary Cdt Geometry
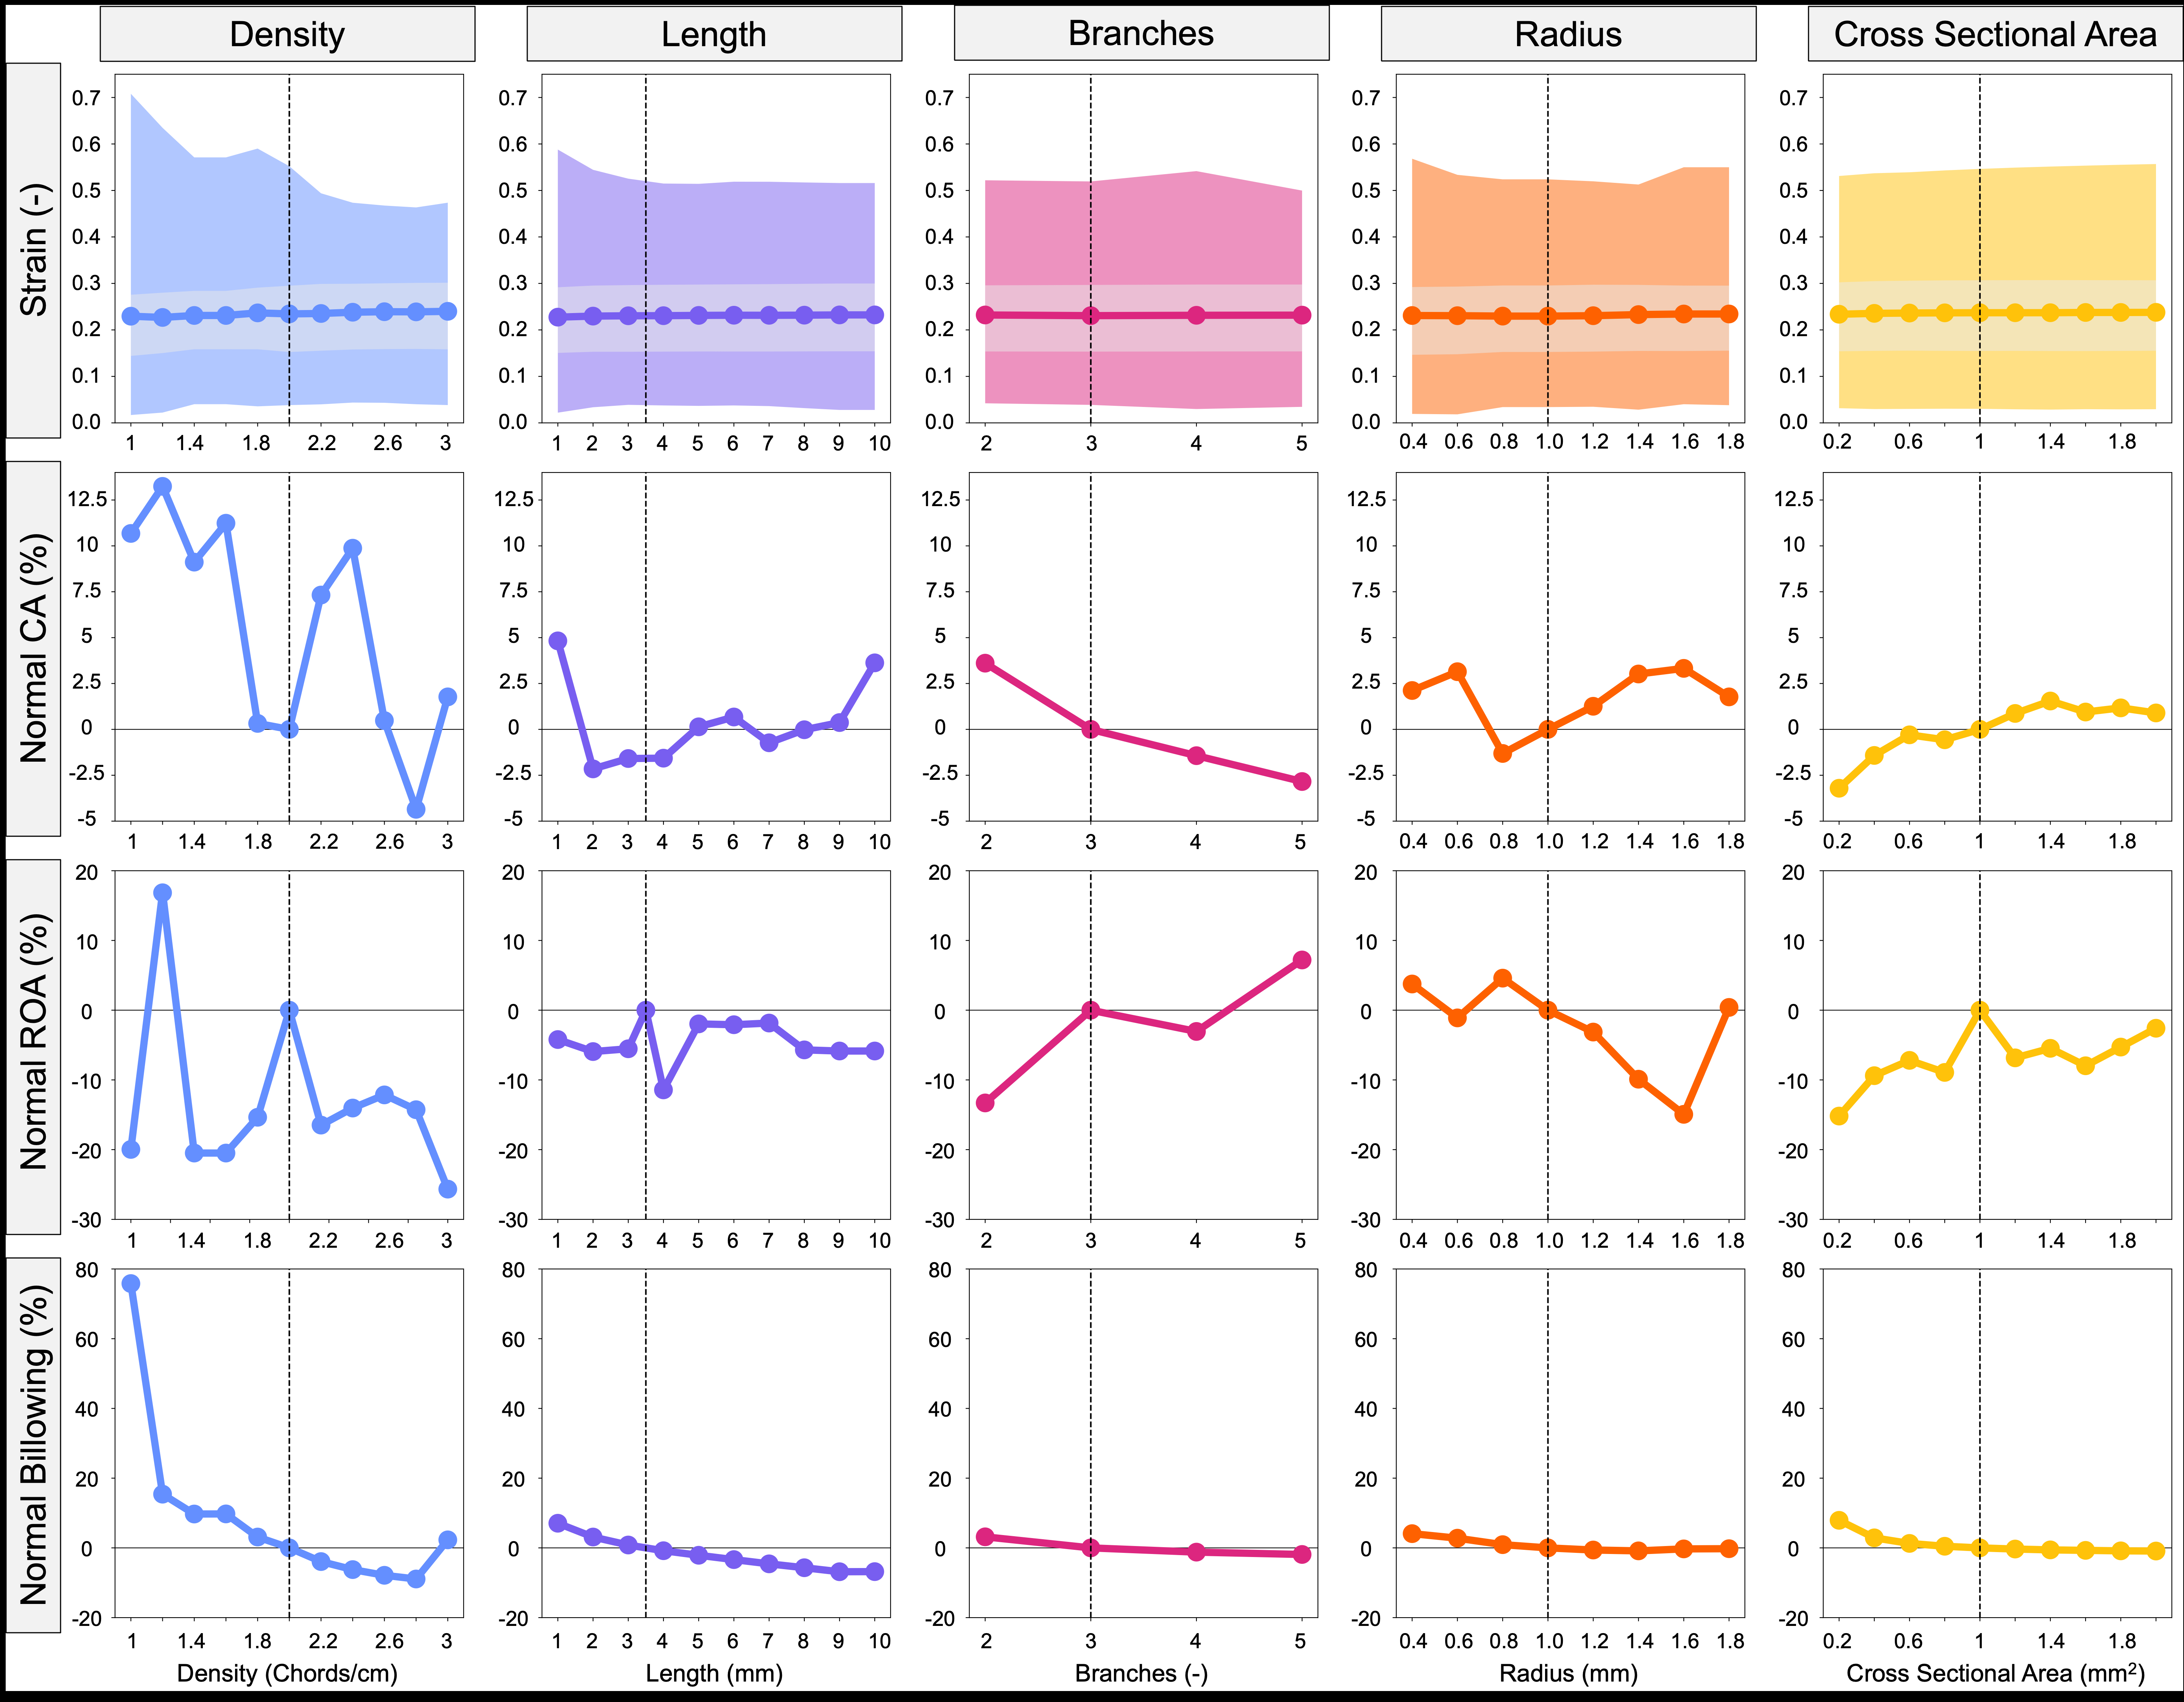
We first altered the primary CDT parameters to examine their effect on valve closure (Fig. 6).
3.3.1 Density
As the primary CDT density increases, the maximum strain decreases from 1 chords/cm (0.71) to 3 chords/cm (0.47). Variation in density resulted in contact area reaching a maximum at 1.2 chords/cm (85.78 mm2 – 13.24% above baseline),
11
and a minimum at 2.8 chords/cm (73.76 mm2 – 4.36% below baseline), yet hav- ing no discernible trend. No trend was observed with the ROA either, but values varied between extrema of 1.2 chords/cm (29.14 mm2 – 16.84% above baseline) to 3 chords/cm (18.54 mm2 – 25.66% below baseline). However, the billowing volume gen- erally decreased monotonically from 1 chords/cm (1214.2 mm3 – 75% above baseline) to 3 chords/cm (706.5 mm3 – 2.3% below baseline).
3.3.2 Length
A well-defined trend for CA and ROA vs. primary CDT length was not observed. However, maximum strain decreased from from 1 mm (0.59) to 10 mm (0.52). Billow- ing volume also decreased from 1 mm (739.1 mm3 – 7.1% above baseline) to 10 mm (643.3 mm3 – 6.8% below baseline).
3.3.3 Number Of Branches
The valve closure metrics generally did not exhibit a trend vs. number of primary CDT branches except in relation to CA, as CA decreases from 2 branches (78.89 mm2 – 3.6% above baseline) to 5 branches (73.98 mm2 – 2.84% below baseline).
3.3.4 Branch Radius
Strain and CA exhibited mild sensitivity to radius variation, and this parameter was able to influence ROA and billowing volume, but in general, no trends were observed. ROA reached a maximum at 0.8 mm (23.67 mm2 – 4.6% above baseline) and a min- imum at 1.6 mm (19.25 mm2 – 14.93% below baseline), with the billowing volume slightly decreasing from 0.4 mm (718 mm3 – 4.09% above baseline) to 1.8 mm (689 mm3 – 0.23% below baseline).
3.3.5 Cross-Sectional Area
Increasing CSA from 0.02 to 0.20 mm2 demonstrated influence over all valve closure metrics. Maximum strain increased from 0.2 mm2 (0.53) to 2.0 mm2 (0.56). The CA increased from 0.2 mm2 (75.78 mm2 – 3.21% below baseline) to 2.0 mm2 (78.99 mm2 – 0.9% above baseline). The ROA reached a minimum at 0.2 mm2 (23.57 mm2 – 15% below baseline) and a maximum at 1.0 mm2 (27.79 mm2 – at baseline), but with no discernible trend. Billowing volume decreased from 0.2 mm2 (622.3 mm3 – 7.91% above baseline) to 2.0 mm (689 mm3 – 0.23% below baseline).
3.4 Secondary Cdt Geometry
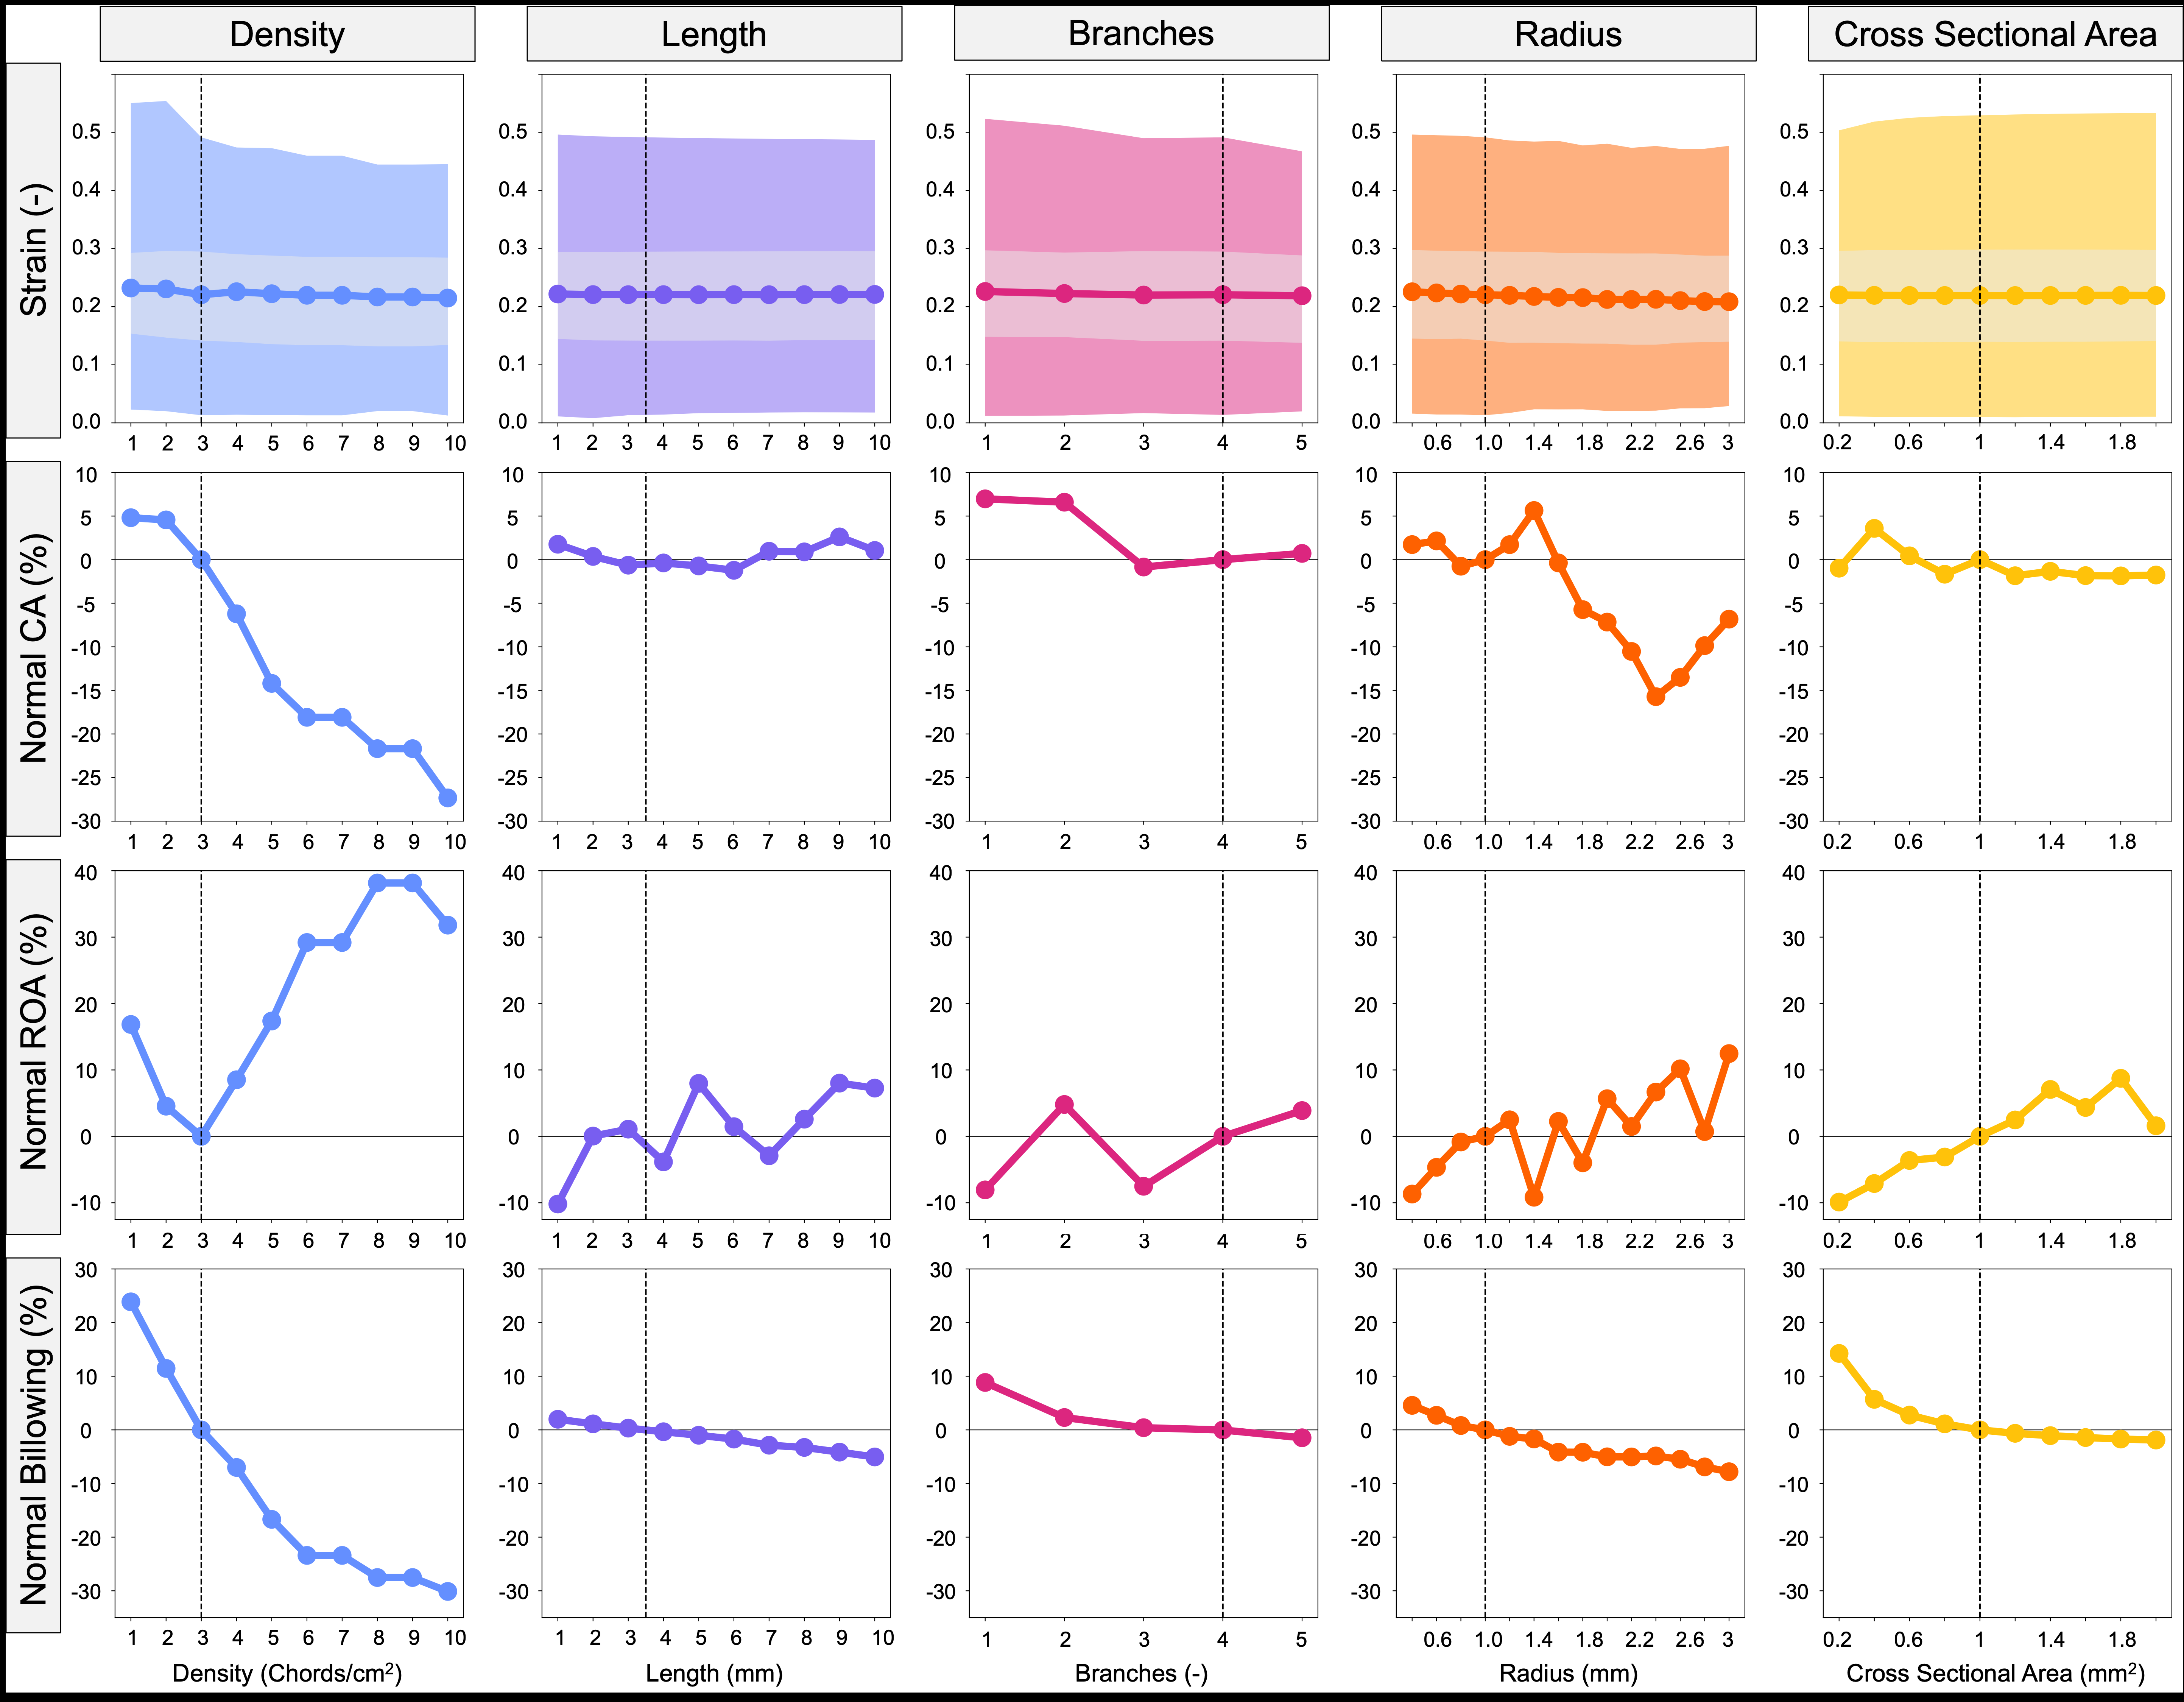
We also investigated how secondary CDT parameters influence valve closure metrics (Figure 7). In many ways the secondary CDT metrics reflected the findings of the primary CDT (Section 3.3).
3.4.1 Density
Increasing the secondary CDT density from 1 chords/cm2 to 10 chords/cm2 resulted in the maximum first principal strain decreasing from 0.55 to 0.45. However, in contrast to
12
Fig. 6 Influence of primary CDT parameters (density, length, branches, radius, and CSA) on valve closure metrics. The shaded regions in the strain plots represent the maximum (darker) and inter quartile range (lighter). CA, ROA, and billowing volume were normalized to the MV with baseline CDT topology indicated with a vertical dashed line.
the primary CDT study, increasing the secondary CDT density resulted in a stronger influence over CA, ROA, and billowing volume. The CA decreased from 1 chords/cm2 (72.78 mm2 – 4.81% above baseline) to 10 chords/cm2 (50.46 mm2 – 27.34% below baseline). ROA moderately varied in relation to secondary CDT density with the minimum density model exhibiting a 16.85% increase above baseline (29.06 mm2), with ROA decreasing from there to the baseline value (24.87 mm2) at 3 chords/cm2 (similar to the primary CDT value). But in contrast to the primary CDT variation behavior, the parameter increased from baseline by 31.81% (32.768 mm2) for the maximum density model.
3.4.2 Length
Variation of the secondary CDT length produced similar results to the primary study as they both influence strain and billowing volume, and do not influence CA. ROA how- ever, increased from 1 mm (21.51 mm2 – 10.19% below baseline) to 10 mm (25.69 mm2 – 7.27% above baseline) with non-monotonic variation between extrema.
3.4.3 Number Of Branches
Results due to increasing the number of secondary CDT branches did not demonstrate any similarities with the primary CDT study. Here, the maximum strain decreased from 1 branches (0.52) to 5 branches (0.47). Additionally, billowing decreased from 1 branches (533 mm3 – 8.86% above baseline) to 5 branches (482.5 mm3 – 4.09% below baseline).
3.4.4 Branch Radius
Secondary CDT radius demonstrated more influence over all valve closure metrics than in primary CDT radius variation. Maximum strain decreased from 0.4 mm (0.50) to 3 mm (0.48). Contact area peaked at 1.4 mm (73.36 mm2 – 5.63% above baseline) and had a minimum at 2.4 mm (58.53 mm2 – 15.71% below baseline), but with no apparent trend. ROA generally increased with secondary radius, with a minimum at 0.4 mm (22.71 mm2 – 8.69% below baseline) and a maximum at 3 mm (27.97 mm2 – 12.46% above baseline). The billowing volume decreased from 0.4 mm (512.1 mm3 – 4.57% above baseline) to 3 mm (451.5 mm3 – 7.8% below baseline).
3.4.5 Cross-Sectional Area
The secondary CDT CSA variation produced similar results to those observed in the primary CDT CSA study as it demonstrated influence over strain, ROA, and billowing volume, with the exception of it exhibiting only trivial sensitivity on CA.
The maximum strain increased from 0.2 mm2 (0.50) to 2.0 mm2 (0.53). The ROA increased from 0.2 mm2 (22.58 mm2 – 9.90% below baseline) to 2.0 mm2 (25.46 mm2 – 1.6% above baseline). The billowing volume decreased from 0.2 mm2 (447.3 mm3 – 14.25% above baseline) to 2.0 mm2 (384.1 mm3 – 1.89% below baseline).
3.5 Insertion Points And Total Csa
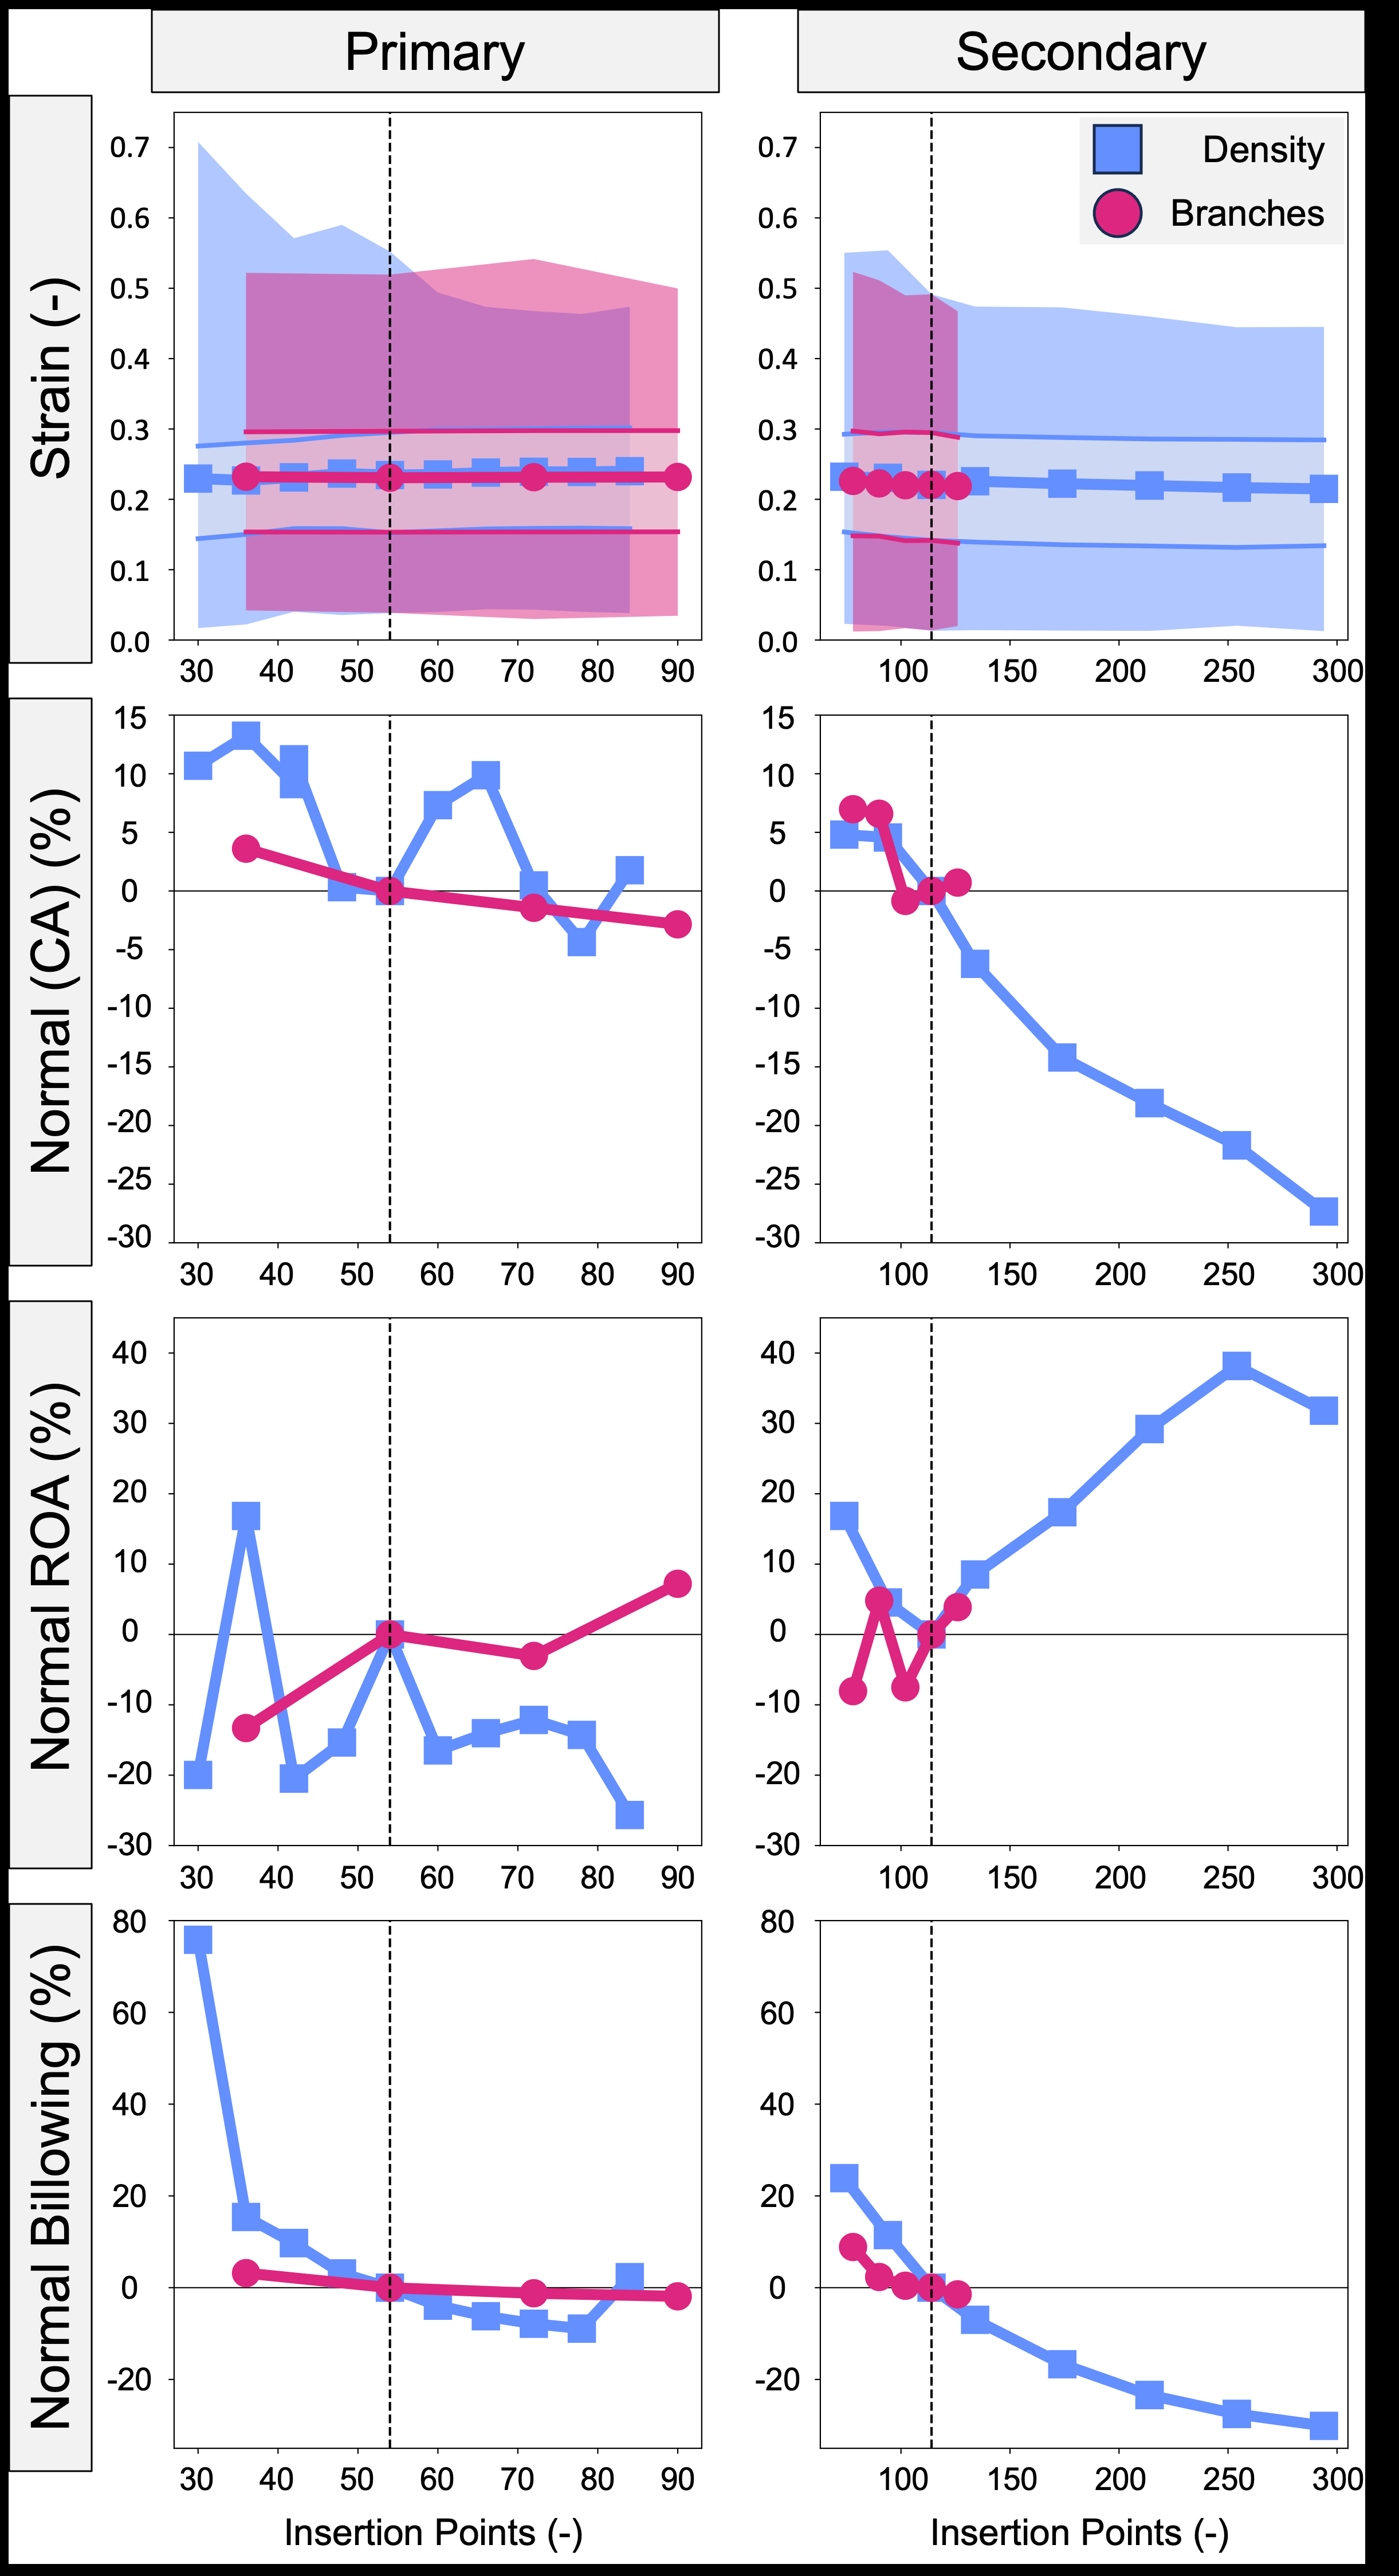
The CDT density and branching metrics were re-quantified as a function of total CDT insertion points and are presented in Figure 8. Interestingly, there were no consistent trends when varying the density and number of branches for the primary CDT, sug- gesting these parameters independently influence valve function. In contrast, there were decreasing trends in maximum strain, median strain, and billowing volume when secondary CDT density and number of branches were increased. CDT density appeared to have a stronger influence on these metrics, but this comparison is inhibited by the relatively limited range when varying the number of branches.
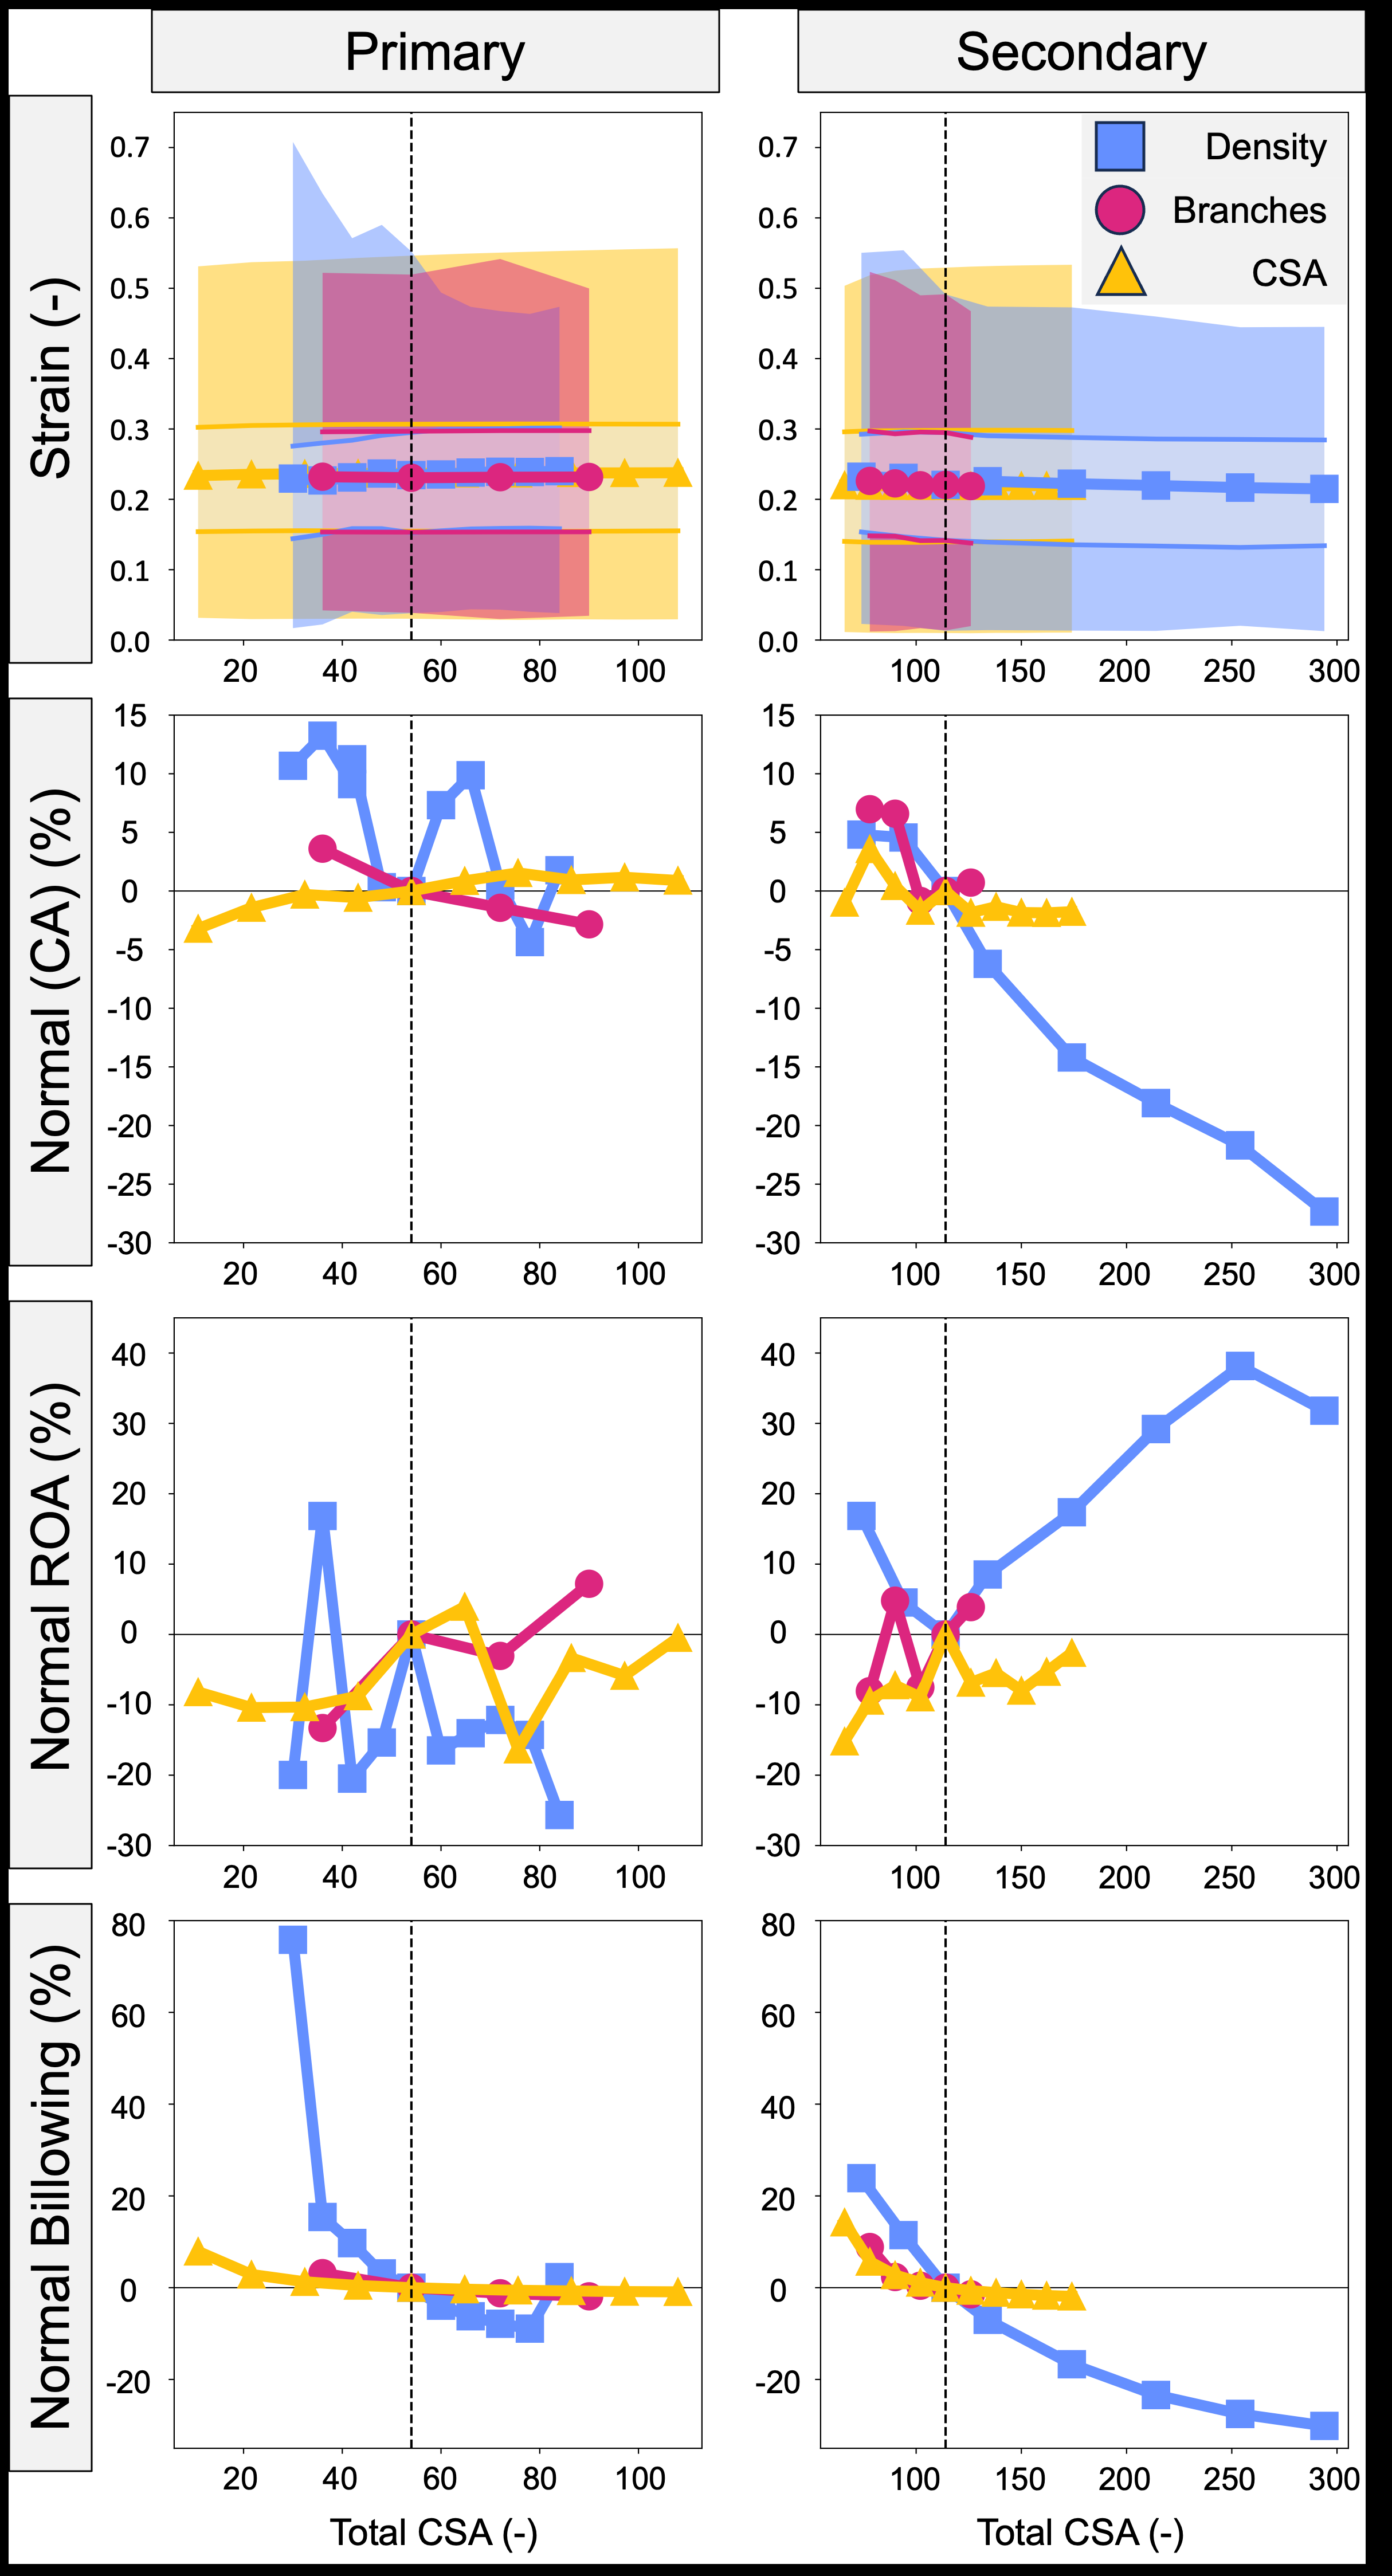
Additionally, the CDT density, branching, and CSA metrics were re-quantified as a function of total CDT CSA and are presented in Figure 9. Similar to our analysis based on CDT insertion point density, there were no consistent trends when varying the density, branches, or CSA of the primary CDT. However, there were consistent decreases in median strain and billowing volume as the total secondary CDT CSA was increased, suggesting total secondary CDT CSA is a crucial consideration to simulations of valve function.
14
Fig. 7 Influence of secondary CDT parameters (density, length, branches, radius, and CSA) on valve closure metrics. The shaded regions in the strain plots represent the max- and inter-quartile range. CA, ROA, and billowing volume were normalized to the MV with baseline CDT topology indicated with a vertical dashed line.
3.6 Additional Valves
To demonstrate the utility of our new parametric CDT generation tool, the CDT geometries of the ADMV and TV were successfully adjusted from the baseline CDT to improve simulated valve function (Fig. 10). The primary CDT density of the ADMV model was increased to reduce local free edge prolapse, which led to a 13.5% decrease in CA and 17.4% increase in ROA. Additionally, the secondary CDT density of the baseline TV model was decreased to reduce the ROA by 13% and better resemble a functioning, stereotypical TV. Decreasing the secondary CDT also resulted in a mini- mal change in maximum strain (0.629 – 0.628), decreased CA (4.84%), and increased billowing volume (5.56%). These extensions of our pipeline illustrate how the CDT generation tool can be successfully used for a range of AVV geometries.
4.1 Overall Findings
In this study, we investigated how variations in CDT structure influence AVV closure by combining our new open-source tools in SlicerHeart with our established FEBio
15
Fig. 8 The effect of density and branches on valve closure metrics when evaluated by the number of insertion points. The shaded regions in the strain plots represent the maximum (darker) and inter quartile range (lighter).
workflow (e.g., [32, 45]). Our findings demonstrated that altering the CDT geometry of a stereotypical MV led to changes in clinically relevant valve metrics (ROA, CA, and billowing volume) and valve mechanics (first principal strains). Specifically, CSA had the most influence over valve closure metrics, followed by CDT density, length, radius and branches. We then used this information to showcase the flexibility of our new workflow by altering the CDT geometry of two additional valve topologies (MV with annular dilation and TV) to improve FE predictions. To our knowledge, this is the first study to generate morphologically realistic CDT geometries and parametrically investigate how CDT branching influences FE predictions of AVV function.
16
Fig. 9 The effect of density, branches, and CSA on valve closure metrics based on the total CSA of the CDT. The shaded regions in the strain plots represent the maximum (darker) and inter quartile range (lighter).
4.2 Existing Literature
There has been great progress in computational predictions of AVV closure over the past two decades [27, 33, 33, 40, 41, 43, 44, 52–56], yet accurate reconstruction of in vivo CDT geometries remains an unresolved challenge. This has led to research groups adopting various methods (see Table 1) in which the CDT geometries are: (i) accurately reconstructed from ex vivo samples, (ii) informed from clinical images and numerical optimization, (iii) artificially generated based on assumed CDT properties, or (iv) completely disregarded or simplified to force or displacement boundary con- ditions acting on the leaflets. Here, we review each classification of CDT geometry fidelity to contextualize our newly developed CDT generation tool.
Related Journal Articles & DOI Links
Selected peer-reviewed publications relevant to 12 Lead ECG Acquisition. Click the DOI to access the full paper (may require institutional access).
-
1. Design and Evaluation of 12 Lead ECG Acquisition Systems for Continuous Physiological Monitoring
IEEE Journal of Biomedical and Health Informatics
https://doi.org/10.1109/JBHI.2020.2981234 -
2. Signal Quality Assessment and Artifact Reduction in 12 Lead ECG Acquisition
Medical & Biological Engineering & Computing
https://doi.org/10.1007/s11517-020-02145-6 -
3. Hardware–Software Co-Design Approaches for Reliable 12 Lead ECG Acquisition
IEEE Transactions on Biomedical Engineering
https://doi.org/10.1109/TBME.2019.2895762 -
4. Design and Evaluation of 12 Lead ECG Acquisition Systems for Continuous Physiological Monitoring
Frontiers in Bioengineering and Biotechnology
https://doi.org/10.3389/fbioe.2020.00123 -
5. Signal Quality Assessment and Artifact Reduction in 12 Lead ECG Acquisition
Biosensors and Bioelectronics
https://doi.org/10.1016/j.bios.2021.112345 -
6. Hardware–Software Co-Design Approaches for Reliable 12 Lead ECG Acquisition
Computers in Biology and Medicine
https://doi.org/10.1016/j.compbiomed.2021.104567 -
7. Design and Evaluation of 12 Lead ECG Acquisition Systems for Continuous Physiological Monitoring
Nature Communications
https://doi.org/10.1038/s41467-020-12345-6
Why Choose Us?
Bangalore guidance for robotics, Spectre and autonomous systems projects.
Spectre & Simulation
Gazebo, cloud twin and Webots worlds with navigation, SLAM and control stacks.
Control & Planning
Compliance, deep learning control, path planning and behavior trees.
Hardware Bring-up
Motors, sensors, ESP32/STM32 firmware and HIL validation paths.
Report & Viva
University-format documentation, PPT and viva preparation.
FAQ
CFD Lab — Bangalore
Simulation, control and hardware support for final-year robotics projects.
Stacks
Worlds
Digital Twin
Control
Robots
Offline
Bring-up