Microstructure sensitive fatigue life prediction model for
Slm Fabricated Hastelloy-X
Chandrashekhar M. Pilgara,b, Ana Fernandezc, Javier Seguradob,a aIMDEA Materials Institute, C/Eric Kandel 2, 28906, Getafe,Madrid, Spain
Abstract
A microstructure-sensitive fatigue life prediction framework based on CP- FFT is proposed to study SLM fabricated Hastelloy-X. The microstructure enters in the model through the shape, size and orientation distributions of grains in the RVEs, which are generated from experimental EBSD data.
The framework has been applied to specimens built in two different direc- tions with different polycrystalline microstructures and is able to accurately predict their fatigue life, using just two experiments for calibration. The model reproduces the better fatigue performance found experimentally at high stresses for samples built in transverse direction, identifying the origin of this anisotropy in grain aspect ratios.
1. Introduction
Hastelloy-X is a nickel-based superalloy, primarily strengthened by adding solute elements W, Cr, and Mo [1, 2] which shows excellent oxidation and corrosion resistance at elevated temperatures, making it suitable for gas tur- bines and jet engine parts. Moreover, the alloy shows good formability and weldability, making it an ideal candidate for additive manufacturing fabrica- tion, mainly using a selective laser melting (SLM) route .
SLM is an additive manufacturing process that can achieve near net shapes of complex geometries with stable properties. In this process, a laser beam follows a predefined 2D path over a platform in a sequential manner.
Preprint submitted to International Journal of Fatigue
November 16, 2022
arXiv:2211.08305v1 [cond-mat.mtrl-sci] 15 Nov 2022 After one traverse of a laser beam, the platform is lowered by the prede- fined layer thickness. This procedure is repeated till the completion of the final 3D object . SLM fabrication allows tailoring of the microstructure by changing parameters such as laser energy , scanning strategy [2, 4] or build/sample geometries [2, 4]. The production of net-shape complex com- ponents of Hastelloy-X using a SLM process presents enormous potential for the industry, especially aerospace, which have already started to design and fabricate some jet engine parts using SLM fabricated Hastelloy-X. However, strong variability is found in the monotonic and cyclic/fatigue behavior of SLM components depending on the process parameters and part geometry.
This variability of properties is mainly attributed to the highly heteroge- neous microstructures resulting from the complex thermal cycles followed during fabrication [5, 6, 7, 8] . The most critical design parameter for po- tential high-temperature applications of SLM fabricated Hastelloy-X parts is the fatigue performance. Therefore, models able to predict the fatigue life for SLM components accounting for the effect the heterogeneous microstructure are fundamental for the progressive introduction of these components into industrial applications.
Multiple authors have studied the cyclic deformation and fatigue behavior of SLM components from an experimental viewpoint [9, 10, 11, 5, 12, 13, 14]. Most of these studies reported similar conclusions for a wide range of SLM alloys including IN718 or Ti-6Al-4V [5, 15], namely an inferior fatigue per- formance of the SLM component compared to wrought and cast ones. In some cases, the reduction of fatigue life can be larger than one order of mag- nitude [14, 16, 15, 7]. This worse fatigue performance of SLM components, particularly in as-built case, has been attributed to the porosity , surface roughness or residual stresses , and also to the resulting anisotropy of the part and its orientation with respect to the cyclic loading direction [19, 15]. However, some studies reported the mitigation methodologies for porosity, surface roughness and residual stresses effects on the fatigue lives by optimizing the processing parameters, heat treatment and powder composition. With respect to the specimen orientation, the fatigue life of vertically built specimens has been found to be inferior to horizontally built parts when loaded under stress control [22, 16, 12, 23, 19]. On the contrary, under strain-controlled loading, some studies show the oppo-
Site Effect,
vertically built samples having a superior fatigue performance than horizontally built samples. This fact is justified by the resulting elas- tic anisotropy, vertically built samples have lower elastic modulus and hence
2
underwent lower stress amplitudes than horizontally built samples. In the particular case of AM Hastelloy-X, a few recent studies can be found in the literature which cover its fatigue analysis. Han et al. studied the effect of hot isostatic pressing (HIP) on the fatigue life of AM Hastelloy-X and concluded that the fatigue life could be significantly improved by HIP due to closure of internal pores and relief of residual stresses. Esmaeilizadeh et al. studied the fatigue life of AM Hastelloy-X as a function of laser scanning speed at room temperature and concluded that fatigue lives could be improved by optimizing the processing parameters. Wang et al. high- lighted the importance of HIP on fatigue life improvement and reported that the part orientation does not play a significant role in the fatigue life for low applied stress level; however, at higher loads, observed that the fatigue resis- tance of vertically orientated specimen is inferior to its horizontally oriented counterpart. Lindstrom et al. reported that the fracture surface of the horizontally oriented specimen had shown more plastic deformation than the vertically oriented specimen.
From the modelling view point, empirical models such as Basquin, Coffin Manson, etc., have been used with experimental data to correlate the fatigue life of different additive manufactured alloys [27, 28, 29], including the study of SLM Hastelloy-X by Esmaelizadeh et al..
However, It Is Well Known
that there is a strong influence of the microstructure in the fatigue life of an alloy, and these models cannot account for it because they are empirical and calibrated with experimental data without considering any microstructural aspect.
The influence of the microstructure in the fatigue performance is mainly affecting the nucleation of a crack. The repeated deformation of the poly- crystal induces the localization of plasticity at the grain level in persistent slip bands which degenerate finally in microscopic fatigue cracks . The regions of the microstructure in which these bands and subsequent cracks are more prone to appear correlate with the points in which some variable related with cyclic plastic deformation is localizing. In order to consider the effect of the microstructures resulting from SLM fabrication in the fatigue life prediction, micromechanical models which model this mechanisms have to be used.
In particular, the approaches relying on the use of polycrystalline com- putational homogenization to estimate the number of cycles for crack nucleation allow to analyze crack nucleation as a function of the mi- crostructure from a statistical viewpoint. Under the microstructure sensitive
3
fatigue life approach, fatigue life is predicted by cyclic accumulation of plas- tic slip and localized stresses that act as a driving force for fatigue crack nucleation on persistent slip bands. The driving force is quantified using Fatigue Indicator Parameters (FIP) that are based on accumulated plastic slip [33, 34], stored strain energy [35, 36, 37], dissipated energy [38, 39, 40, 41] or in general any combination of stress, strain and plastic slip fields .
The FIP is evaluated at each material point by varying local micro-fields and internal variables, and fatigue life is calculated based on the maximum FIP (hot-spots) in the domain. These models include the relevant microstruc- tural features of the polycrystal under study into Representative Volume El- ements (RVE) of the microstructure. The mechanical response of the RVEs under a macroscopic cyclic history is then simulated using crystal plasticity and some computational homogenization approach to obtain some fatigue indicator parameter that is the driving force for crack nucleation.
These
micromechanics-based fatigue life prediction models have been successfully applied to a large number of alloys produced by standard fabrication routes, as wrought Ni-based superalloys [33, 43, 40]. Most of the micromechanical studies of fatigue rely on finite element simulation and only recently Fast Fourier Transform (FFT) solvers have been introduced as an alternative to FEM [42, 44, 32]. The use of FFT-homogenization methods allow accurate prediction of the micro-field response over many cycles at a fraction of the cost of FE based solvers, making it possible to simulate larger RVEs and consider more accurate microstructural features .
The application of crystal plasticity models to investigate the effect of the resulting microstructures of AM metals in their fatigue performance is a trending topic nowadays. These models have already been applied to some SLM fabricated superalloys [45, 46, 47, 48]. In some cases the life prediction is focused on crack propagation stage. Other studies consider crack nu- cleation but the life prediction model is directly linked with the macroscopic cyclic response [25, 20, 27], without making use of the distribution of micro- scopic fields obtained. Only a few studies on AM alloys are available which rely on the use of micromechanical fields through fatigue indicator parame- ters (FIPs) to estimate the fatigue life assuming crack nucleation controlled fatigue. Among these studies, in some cases the real microstructures are not considered and simplified random textures are assumed [49, 50]. In other cases, the actual microstructures obtained from EBSD data are included in the model [51, 46, 52, 53] but the study is focused only on a particular fa- tigue regime, either LCF [46, 51, 53] or HCF [54, 55], and a particular loading
4
control, either strain or stress control. To summarize, on one hand, there are no available micromechanics based fatigue life prediction approaches available which consider both strain and stress control and a wide range of fatigue lives. On the other hand, there is still a lack of understanding of the effect that the building direction has on the fatigue performance of SLM alloys, originated in the different microstructures developed during SLM fabrication.
In this work, we present a micromechanics based fatigue life prediction approach valid for stress and strain control and a wide range of fatigue lives. From a numerical viewpoint, FFT based polycrystalline homogenization is used to simulate the cyclic response of the specimen. This framework is then applied to analyze the effect of the SLM resulting microstructures, including grain aspect ratios and orientation distributions. The model is applied to study the fatigue life of Hastelloy-X specimens built in different directions including its validation using experimental data under strain and stress control at 750 ◦C for a wide range of fatigue cycles from very low LCF to more than 105 cycles.
2.1. Material And Fabrication
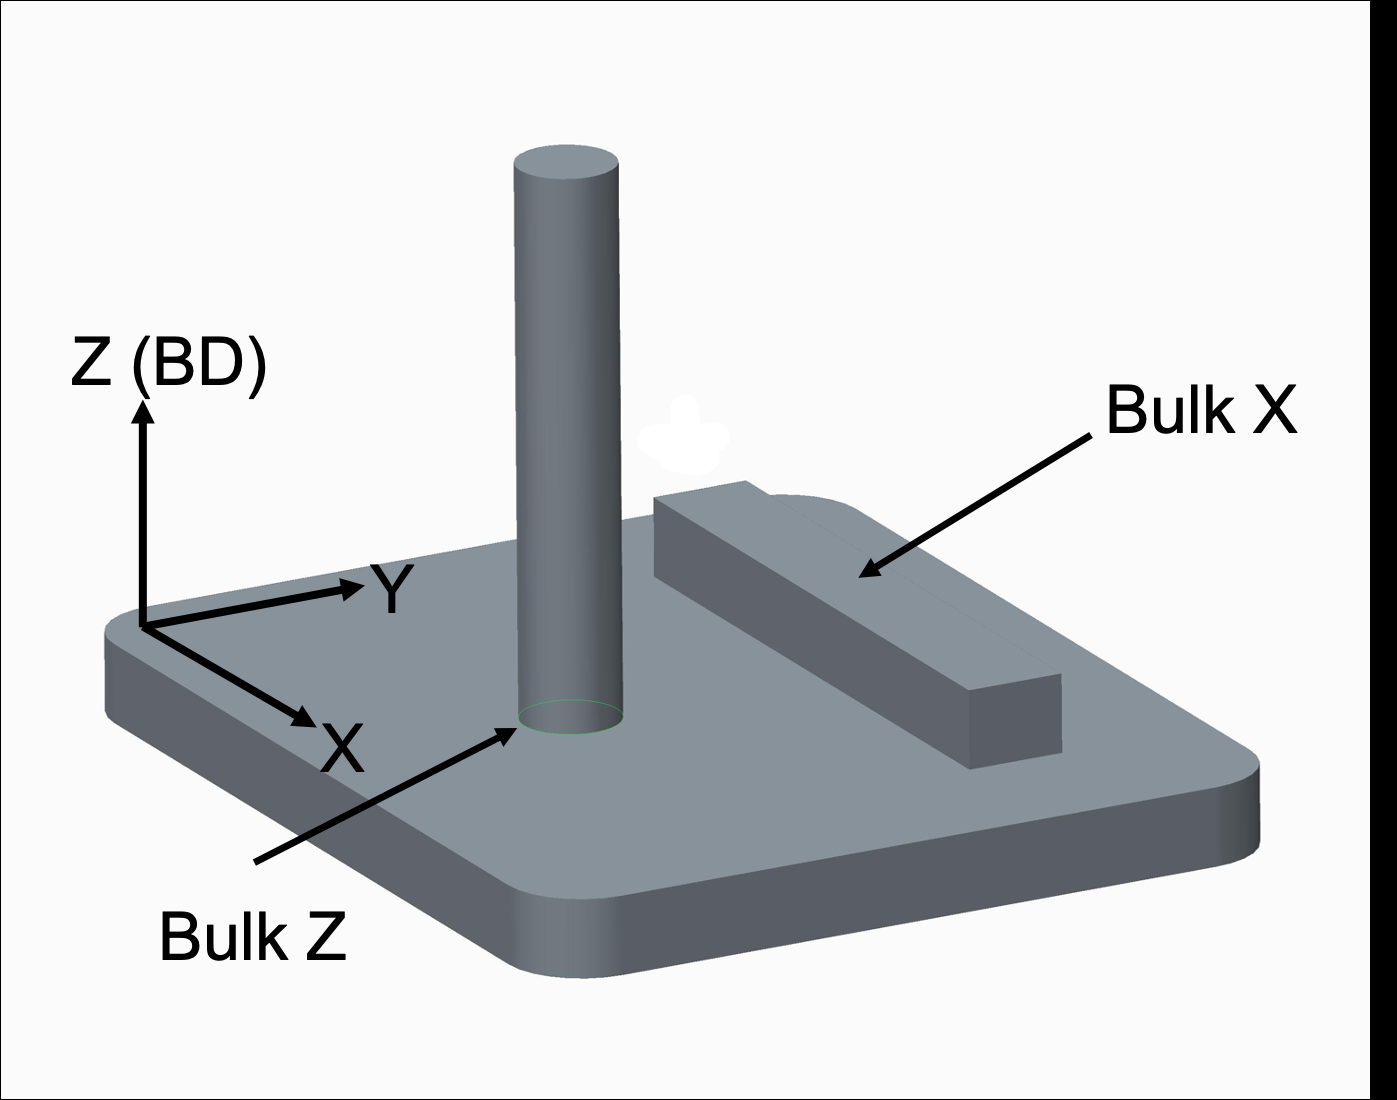
This work uses a selective laser melting(SLM) route to manufacture the Hastelloy-X samples, whose nominal composition is given in . The bulk samples were built layerwise in the Z direction using the Ren- ishaw RenAM 500Q machine, keeping a constant layer thickness of 60 µm and a rotation of the laser scanning direction between consecutive layers of 67◦(see Fig. 1). Hastelloy-X powder was made via the Ar gas atomization process, providing a powder size in the range of 15 µm to 53 µm. The pa- rameters of the SLM process, such as laser power, scan speed, hatch distance, and volumetric energy density, were well optimized to achieve the maximum part density. The different fatigue specimens were fabricated through the SLM process by ITP Aero in the shape of bulk blocks. The bulk samples were fabricated in two different orientations (see Fig.1): • Bulk Z specimen is built in a cylindrical shape, oriented parallel to the build direction.
• Bulk X specimen is printed with a rectangular shape with dimensions 15 mm×15 mm×100 mm, oriented perpendicular to the build direction.
5
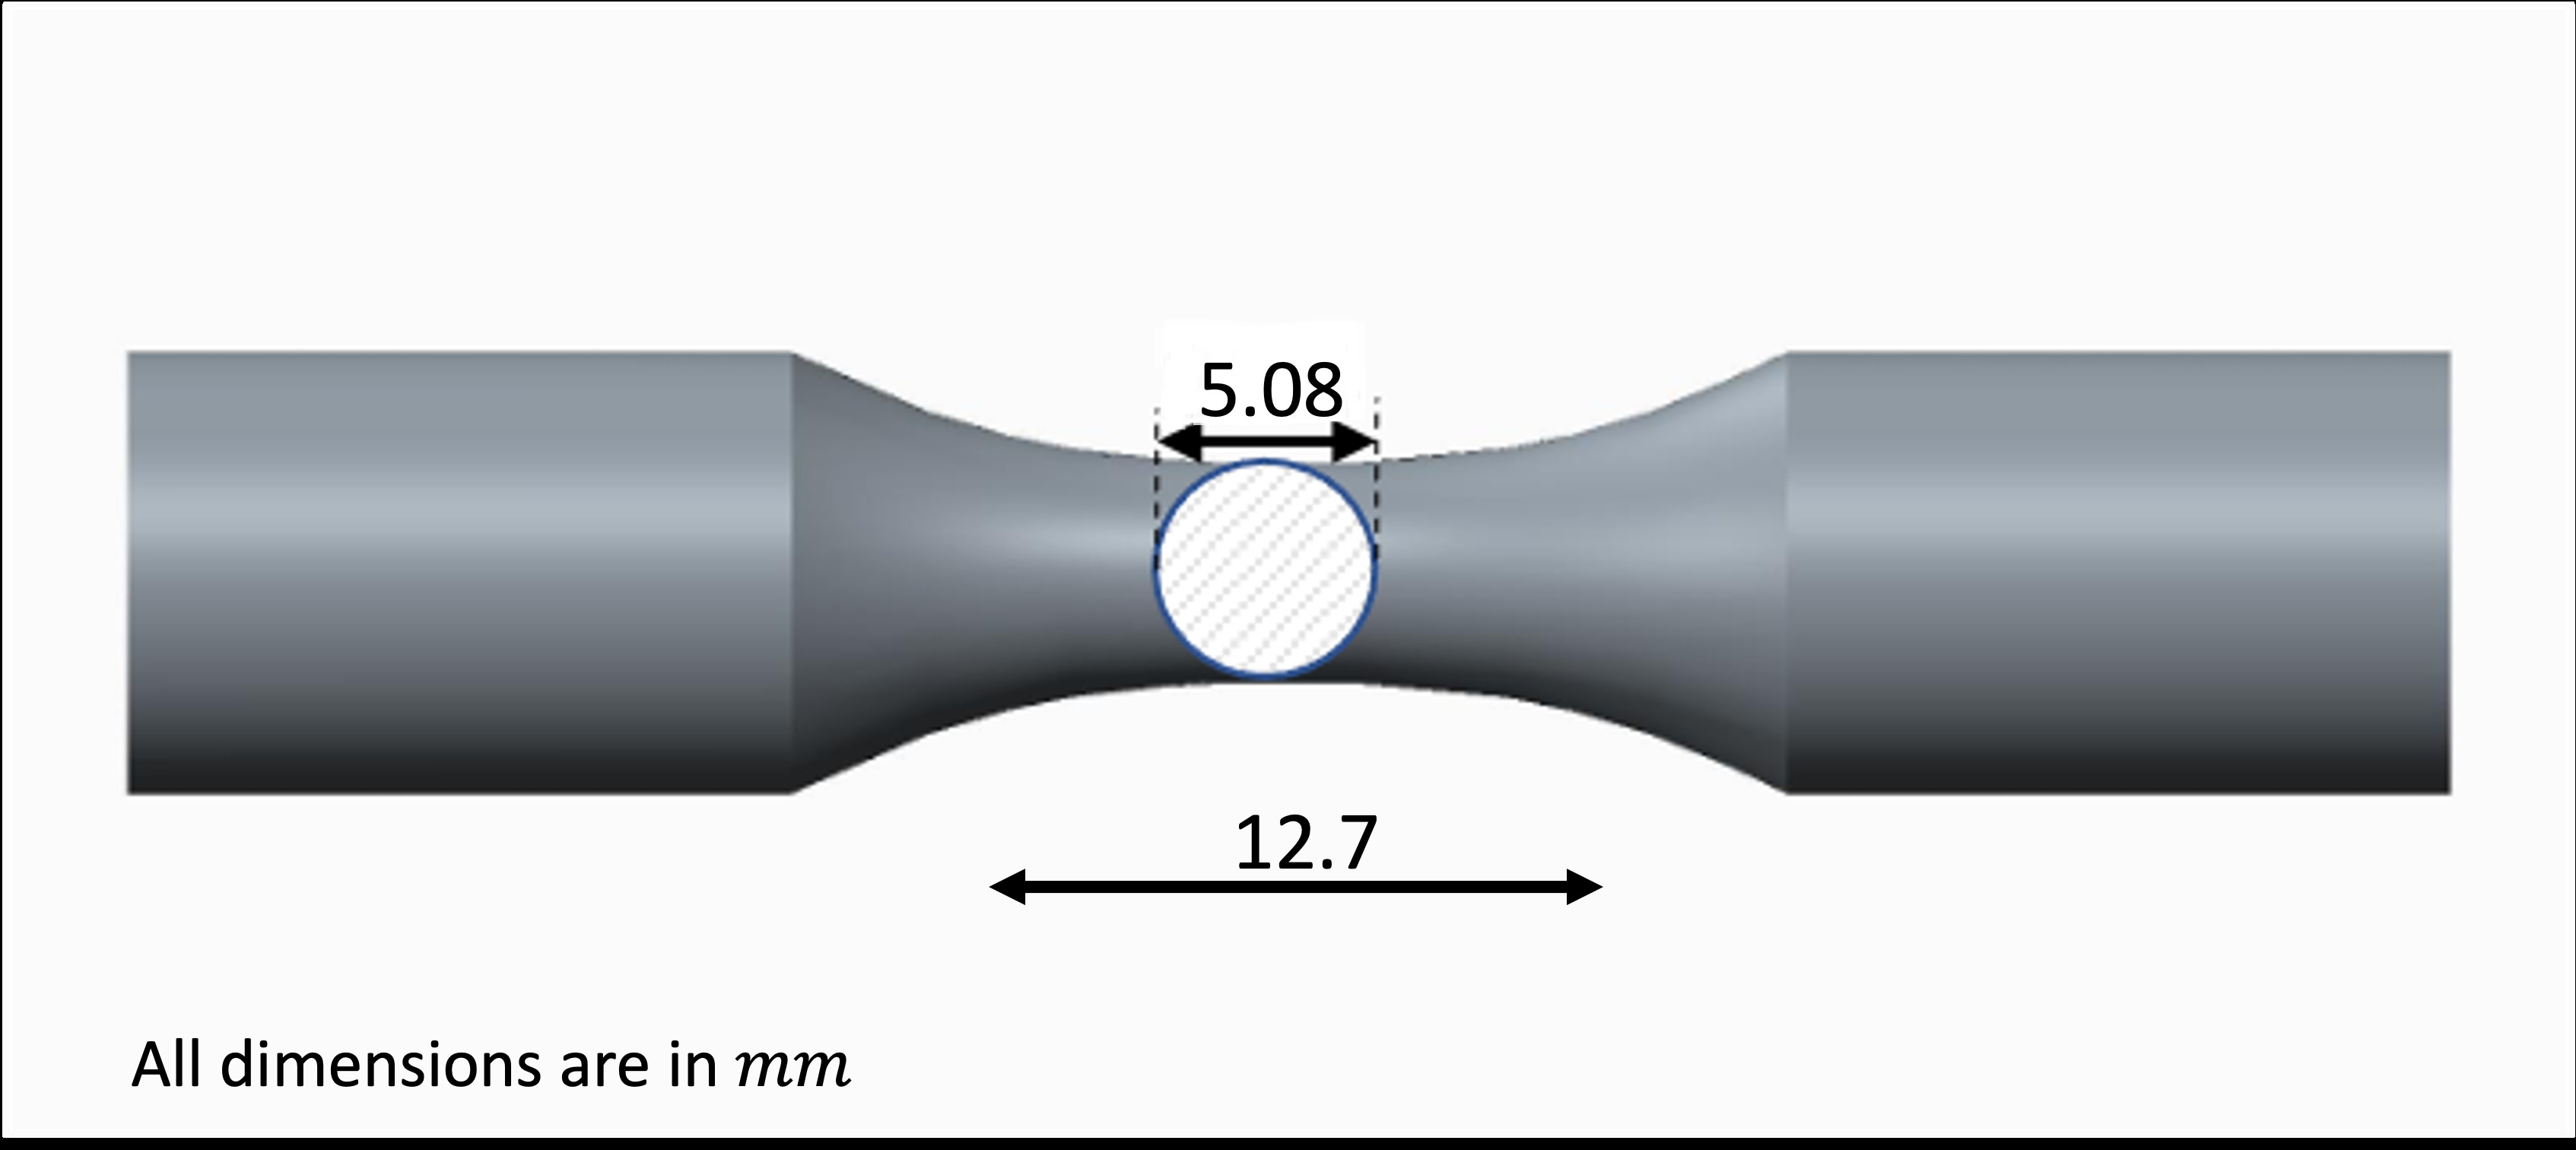
Figure 1: The SLM platform shows different orientations of the bulk samples fabricated using the SLM process along with the build direction. Coupons necessary for fatigue tests were machined from above-built bulk samples in cylindrical dog-bone shapes with the same gauge length (12.7 mm) and diameter (5.08 mm) shown in Fig.2.
Finally, The Samples Were
heat treated at 1170◦C / 30 minutes and followed by gas cooling.
The
SLM thermal history was removed by this treatment and the SLM process dendrites were dissolved.
This Annealing Also Significantly Minimises The
residual stresses of Hastelloy-X, as observed in Karapuzha et al. .
It Is
also interesting to note that precipitates were found in significant quantities in the Ni-based as-build samples, but after the heat treatment the presence of precipitates in the alloy was strongly reduced or even suppressed.
2.2. Microstructure
The resulting porosity was obtained using a microCT analysis and was be-
Figure 2:
The cylindrical dog-bone-shaped specimen, used for the uniaxial tensile fatigue test. low 1% in all the samples. With respect to the polycrystalline microstructure, it is well known that changes in the printing process parameters generate mi- crostructures with different grain elongation and textures. The bulk samples showed different grain structures in BD than in the XY plane. The elongated grains are observed in the build direction. The direction of epitaxial grain growth depends on the direction of maximum heat flow. The maximum heat flow in the SLM process is observed in the building direction. However, the equiaxed grains are observed in the lateral direction.
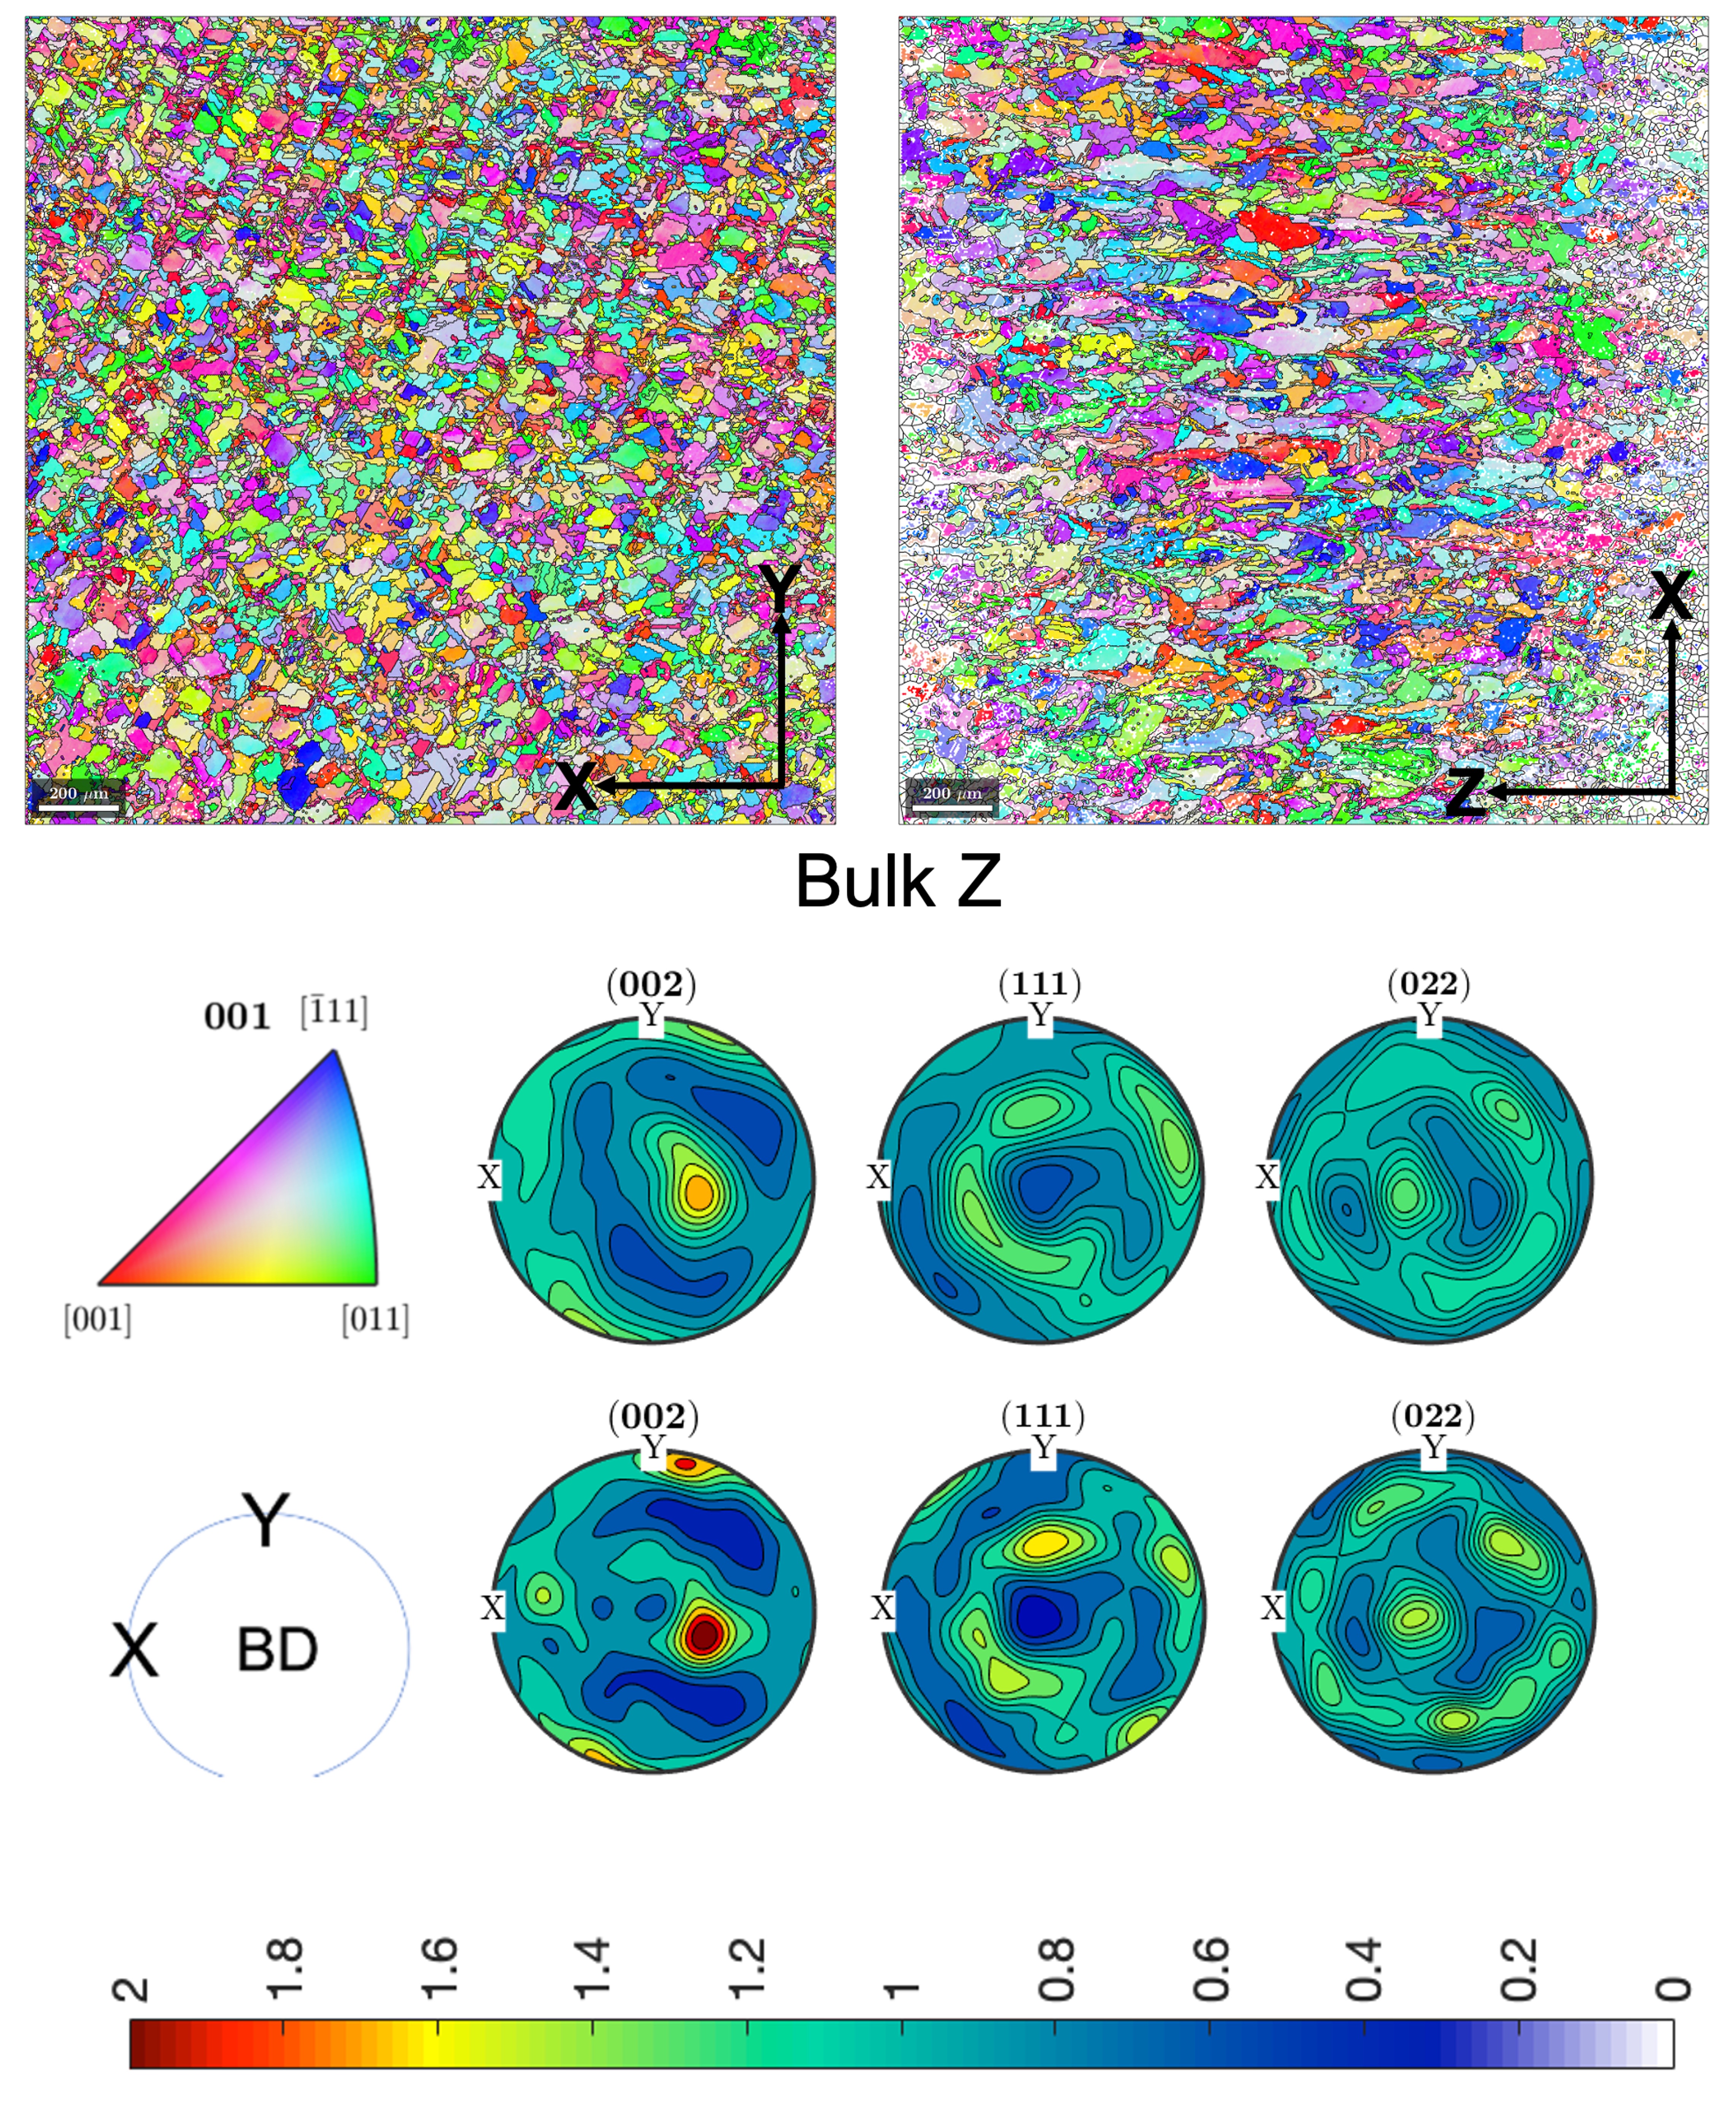
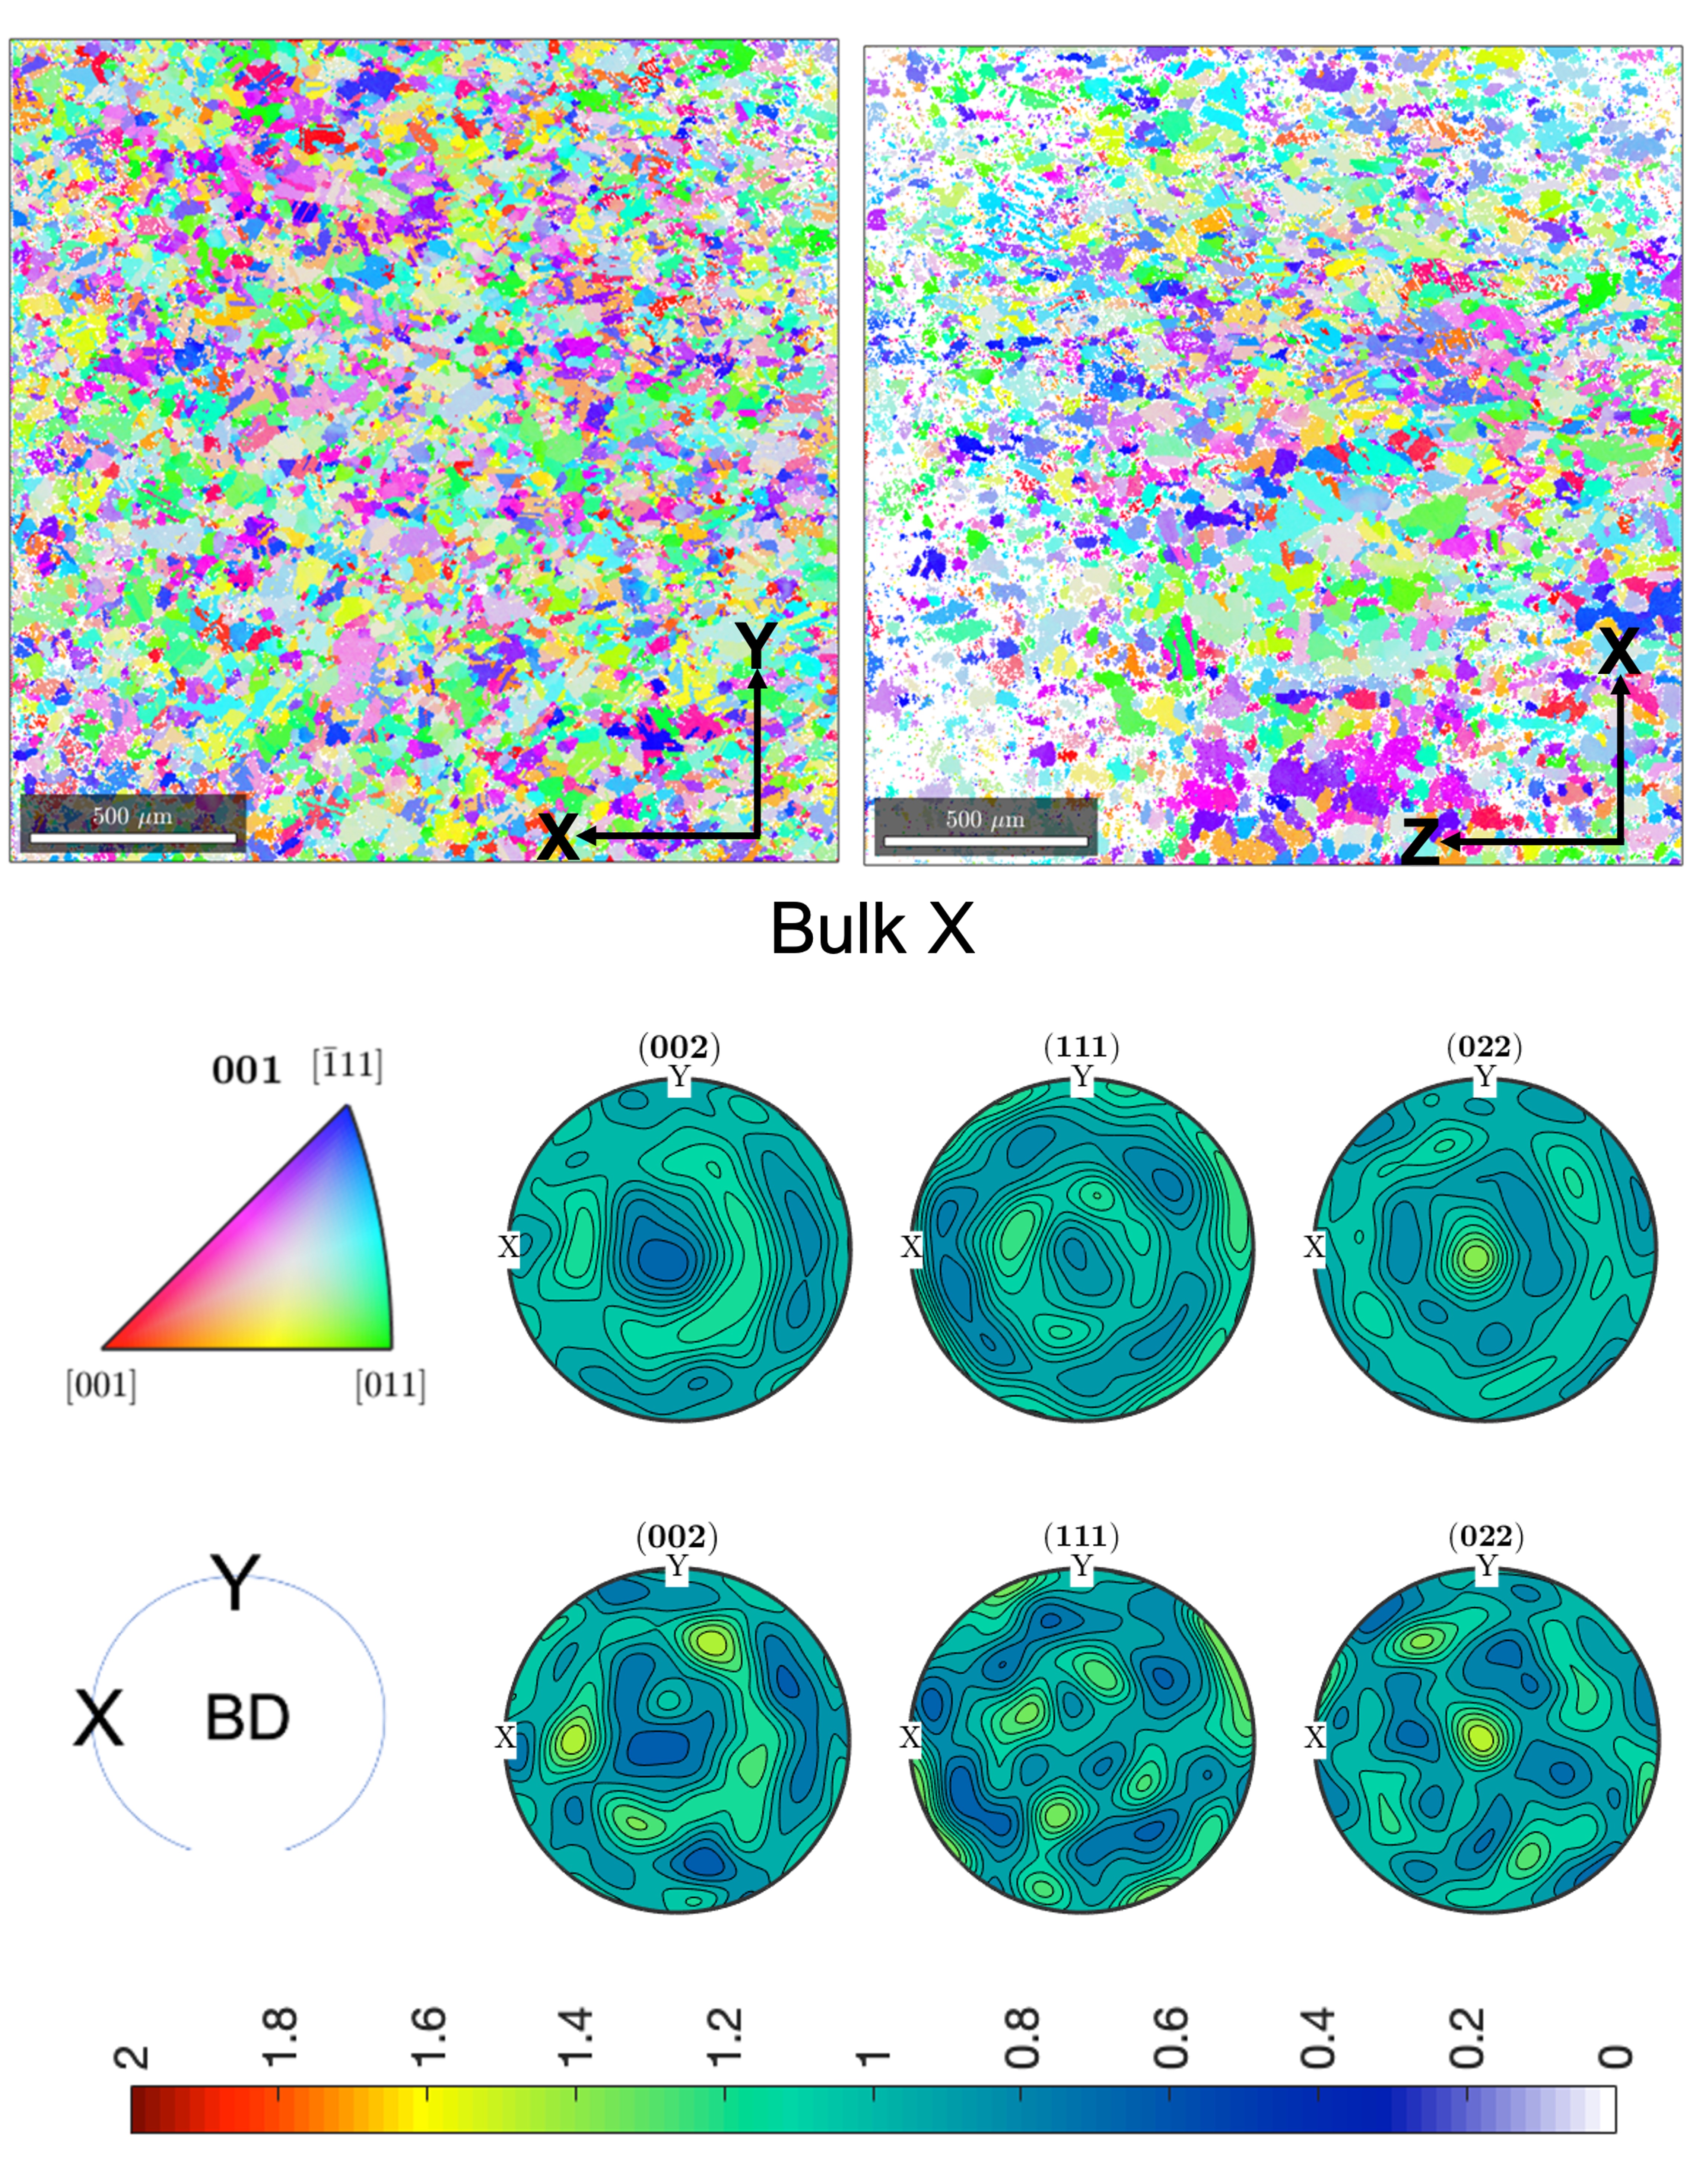
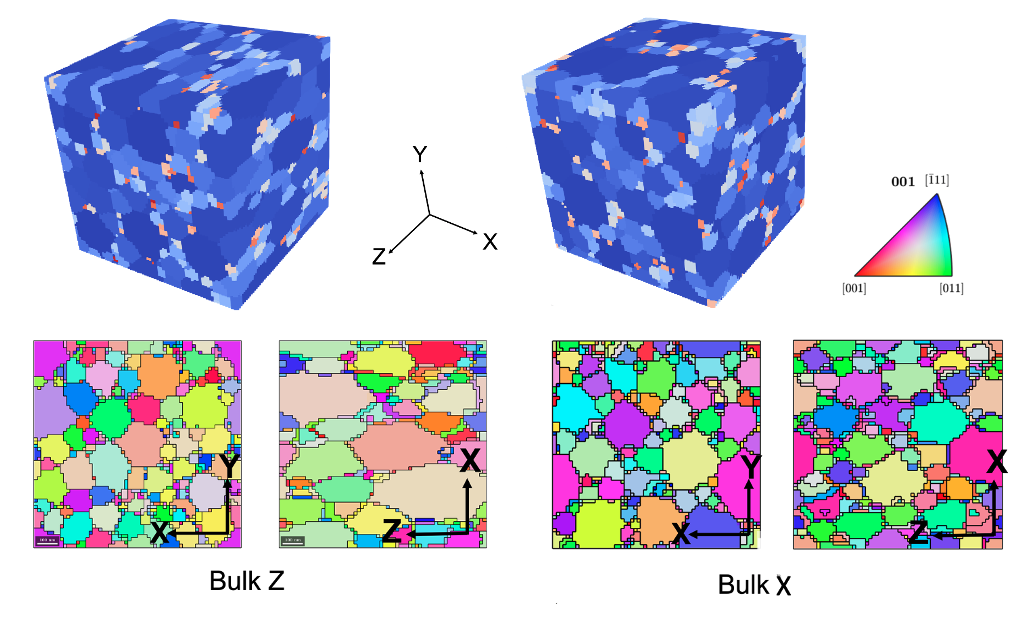
The grain size, shape, and orientation distributions were obtained using Electron Backscatter Diffraction(EBSD) imaging technique. Concerning the grain morphology, the Bulk Z sample reveals elongated grain arrangement in the build direction along with an equiaxed grain setup in the XY section (see Fig. 4). The Bulk X specimen exhibits more equiaxed grain arrangement in both sections. The average grain aspect ratio was 1/1/2 and 1/1/1.5 in X-Y-Z axis, for Bulk-Z and Bulk-X samples respectively.
The diameter of the equiaxed grains in the XY plane follows the log- normal distribution. The log-normal distribution parameters(mean and stan- dard deviation) for both bulk samples are enlisted in Table 1. The surface roughness is always present in the SLM samples due to partially melted and unmelted powder on the surface. Therefore, the samples are machined from all directions to minimize the surface roughness impact on the fatigue test.
7
Table 1: The lognormal distribution of grain diameter of the bulk samples
0.76
To obtain the orientation distribution of each grain in the microstructure, the EBSD analysis was performed on the samples before the fatigue testing. For this purpose, a SEM with an EBSD detector was used. A confidence index (CI) criteria was used to ensure the accuracy of the measured Euler angles. The Euler angles are measured only if the CI at a pixel is greater than 0.02. The OIM analysis software generates the resultant EBSD orientation maps and M-TEX generates corresponding pole figures in Z-direction, which are depicted in Fig.3 and 4 for the XY and XZ sections of Bulk Z and Bulk X samples respectively. The colors in the EBSD maps that follow the IPF triangle gives the orientation of the building direction concerning the crystal reference frame, and the colors in the pole figures follow the color bar shown at the bottom of Fig.3 and 4. The pole figures depict that both bulk samples have a random texture along the XY and XZ sections.
2.3. Mechanical Characterization
The uniaxial cyclic performance of SLM fabricated Hastelloy-X at 750◦ was experimentally determined by cyclic tests performed in a wide range of strain and stress amplitudes. The tests were carried out according to the standards PrEN3874-98 and ASTM E606. The results of the fatigue testing campaign will be presented in the result section.
3. Micromechanics Based Fatigue Life Prediction Model A computational polycrystalline homogenization framework based on the crystal plasticity and FFT homogenization (CP-FFT) is used to simulate the cyclic response for SLM Hastelloy-X under strain and stress-controlled loading.
The FFT-based homogenization code FFTMAD is used to simulate the cyclic response of Representative Volume Elements (RVE) of the microstructures considered.
The synthetic RVEs contain grain size distribution, grain aspect ratio, and orientations representative of the actual SLM microstructures experimentally
Figure 3:
EBSD images of Bulk Z (top) specimen in XY and XZ sections respectively. The colors of the maps suggest the orientation of the building direction compared to the reference frames following the IPF triangle. Pole figures using all the orientations (second) and a reduced set obtained after sampling the ODF(bottom), for Bulk Z specimen.
Figure 4:
EBSD images of Bulk X (top) specimen in XY and XZ sections respectively. The colors of the maps suggest the orientation of the building direction compared to the reference frames following the IPF triangle. Pole figures using all the orientations (second) and a reduced set obtained after sampling the ODF(bottom), for Bulk X specimen.
10
characterized. This section will describe the RVE generation, crystal plas- ticity model that accounts for the cyclic deformation of grains, the FFT homogenization framework, and the quantification methodology to predict fatigue life based on the FIP.
3.1. Rve Generation
The digital representation of RVE corresponding to the SLM Hastelloy-X microstructure is done to statistically include the grain size, shape, and orien- tations obtained from the EBSD. The detailed RVE generation methodology is enclosed in our previous work , and briefly recalled here for complete- ness.
The 2D grain size distribution is experimentally obtained from the XY section of EBSD images (see Fig 4) and is first converted to the apparent 3D grain size, assuming spherical grains, using the software GrainSizeTools.
. The 3D distributions are then used as input to generate digital RVEs consisting of equiaxial polycrystals. To this aim, a cloud of points and their corresponding weights are generated to define a weighted Voronoi tessellation which reproduced the targetgrain size distribution .
Finally, RVEs are scaled proportional to the aspect ratios measured. The resulting synthetic RVEs are shown in Fig.5 with XY and XZ sections.
3.2. Crystal Plasticity Model
The crystal plasticity (CP) model developed by Cruzado et al. for the cyclic response of Inconel 718 is used in this study to simulate the elasto- viscoplastic cyclic behavior of Hastelloy-X crystals. This model allows to reproduce the isotropic and kinematic hardening and mean stress relaxation effects which might appear under cyclic loading.
The Model Selected Is Size
independent because the differences in grain sizes are below 10%, which would have a negligible influence in the fatigue life. Moreover, kinematic hardening is considered by a flow rule, in contrast to some strain gradient models used in the context of fatigue in which kinematic hardening is obtained as a result of the computing explicitly the GNDs. The reason for this simplification is having a computationally efficient model which allow us to fulfil the two main requirements of our study (1) the use of realistic, statistically representative and well discretized microstructures and (2) considering fatigue life prediction in a statistical manner.
Figure 5:
3D images of RVEs of polycrystalline SLM Hastelloy-X for Bulk Z (top left) and Bulk X (top right). Note that colors indicate the grain numbers. EBSD maps of Bulk Z(bottom left) and Bulk X (bottom right) samples in XY and XZ sections.The colors of the maps suggest the orientation of the building direction compared to the reference frames following the IPF triangle.
12
A multiplicative decomposition of the deformation gradient F into its elastic (Fe) and plastic (Fp) components is assumed,
(1)
The plastic velocity gradient Lp is computed in the intermediate (relaxed) configuration as function of the shear rates ˙γα on all the slip systems α,
(2)
where, sα and mα are the slip and slip normal directions, respectively, in the initial configuration. The second Piola-Kirchoffstress S depends linearly on the Green-Lagrange strain Ee through the elastic stiffness tensor C, which is given by
(4)
, being Je the determinant of Fe. A power-law is used to define the slip rate in each slip system as,
(5)
where ˙γ0 and m are, respectively, the reference strain rate and the strain rate sensitivity parameters. τ α is the resolved shear stress, defined as, τ α = S : (sα ⊗mα).
(6)
The functions gα and χα are the critical resolved shear stress and backstress on the α slip system respectively. The evolution of the backstress on each slip system defines the kinematic hardening. In the present model , a simplified version of the Ohno Wang
13
where c, d, and k are material parameter. k controls the mean stress re- laxation, while c and d stand for direct hardening and dynamic recovery modulus, respectively.
The evolution of the Critical Resolved Shear Stress (CRSS) for a given slip system, gα, defines the isotropic hardening and is given by
(8)
where qαβ are the latent hardening coefficients and h is the self hardening modulus which follows the Voce hardening model , given by
(9)
where, τ0, τs, h0 and hs are the hardening parameters and the accumulated
0
|˙γα|dt.
(10)
3.3. FFT based computational homogenization framework The FFT homogenization code, FFTMAD [44, 59] is used to perform the virtual fatigue test that provide the homogenized performance of polycrystals and the localized stress and strain fields.
The polycrystal response is obtained by simulating the RVEs generated, which are discretized into a regular array of voxels. The constitutive model summarized in the previous section enters through a UMAT subroutine . The FFT homogenization problem in finite strains is solved using the Galerkin FFT method [64, 65, 66]. The differential operators in the FFT solver used a finite differentiation approach using the rotated scheme devel- oped in . Strain, stress and mixed control macroscopic boundary condi- tions are introduced following the technique proposed by Lucarini et al. .
According to this technique, the external macroscopic loading is controlled in terms of macroscopic deformation gradient F ij(t) or first Piola-Kirchoffstress components P IJ(t), for strain and stress-controlled fatigue respectively .
The loading process is discretized in increments and the resulting non-linear system of equations for each time increment defines the deformation gradient which provides stress equilibrium. The non-linear equation is solved using Newton Raphson and the conjugate gradient method is used as linear solver for each Newton iteration.
14
3.4. Fatigue Indicator Parameters and Life Prediction The successive deformation of the polycrystal induces the localization of plasticity in persistent slip bands which degenerate finally in microscopic fatigue cracks . The areas of the microstructure in which these bands and subsequent cracks will appear correlate with regions where some Fatigue Indicator Parameter (FIP) is maximum. Moreover, quantifying the value of this FIP in that hot-spots allows to estimate the number of cycles to crack nucleation.
In the current study, the Fatigue Indicator Parameter through the microstructure is obtained from computation homogenization of a full cycle. The FIP distribution within the RVE was computed from the variation of micro-fields and the state variables at every material point. This distribution defines the hot-spots in which fatigue cracks are more likely to appear and the fatigue life is predicted based on the most critical point. The most common FIPs found in the literature are, accumulated plastic strain per cycle [33, 30, 34], the plastic stored energy per cycle [35, 37], accumulated internal strain energy and some other parameters.
In this work, plastic work per cycle Wcyc(x) is chosen as local FIP, as it has shown to correlate well the fatigue life in many different materials [38, 39, 40, 41]. This election is merely practical and other FIP would probably lead to similar results. As an example, the stored energy criterion [35, 37], would provide very close number of cycles, since the stored energy is a small fraction of the total plastic work per cycle.
(11)
at each point x in the RVE being τα and ˙γα the resolved shear stress and shear strain rate respectively. Eq.11 is applied at the center of each voxel to obtain a local map of FIP values in the RVE.
However, the crack initiation on the persistent slip bands is a non-local phenomenon, as shown for example in Castelluccio et al. .
For This
reason, and considering also the strong mesh dependence of the local FIP maps, non-local FIP maps are defined as the volume averaged of local FIPs over the grains or bands within a grain parallel to the slip planes with a constant thickness [43, 40].
This Type Of Non-Local Variable Corresponds To
an non-local integral type model. Alternative non-local FIP by means of gradient approaches can be derived, as proposed in
15
The estimation of the number of cycles for crack nucleation is done based on the most critical point of an RVE. In this work, the maximum of the non- local FIPs defined at each band in the RVE is taken as driving force. More details on the geometrical definition in bands can be found in . Each grain is divided in four families of bands, being nb the total number of bands in the RVE. The FIP of the full RVE is then defined as
(12)
where 1 ≤i ≤nb refers to each of the bands in the RVE, βi = 1, 2, 3, corresponds to the three different slips systems contained in the slip plane parallel to that band and Vi is the volume of the band.
Normally, crack nucleation is directly related to the cyclic FIP obtained from Eq.12 using some empirical relations. However, in this work, a different methodology has been used to predict both fatigue life for stress- and strain- controlled loading, keeping a similar definition of FIP.
Strain Controlled Loading
The value of the FIP in a stable cycle can be used to estimate, based on extrapolation, the number of cycles for crack nucleation. The relation between this value and the number of cycles for nucleation can be based on a linear extrapolation or on other relation, as the power law in [40, 41].
In the latter case, the value of the FIP in a stable cycle, Wcyc, is linked to
(13)
where Wcrit and m are two parameters of the material. This biparametric fatigue life prediction law requires the use of two independent fatigue exper- iments to be calibrated.
The use of the previous approach implies direct simulation of the RVE deformation until a stable hysteresis cycle is reached. Under strain control, hysteresis evolves from cycle to cycle, and stabilization can be reached after a few cycles in some cases to thousands of cycles in other cases, depending on the material and loading conditions . To limit the computational cost of these simulations, different strategies have been developed in the context of polycrystalline homogenization, such as the wavelet transformation-based multi-time scaling algorithm (WATMUS) or the linear extrapolation of internal variables or cycle jumps .
Stress Controlled Loading
Contrary to strain-controlled tests, under stress-control loading, the plas- tic flow is concentrated mainly in the first few cycles. From a computational point of view, this usually results in a relatively fast transition to an approx- imate elastic cyclic macroscopic response. Although microplasticity can still be observed after the shakedown regime, the associated FIPs are three to four orders of magnitude lower than the FIPs in plastic regimes, too small for an accurate prediction of crack nucleation based on the extrapolation approaches used for strain control.
As an alternative, we consider that the total accumulated plastic defor- mation (also related to the stored energy) until the shakedown limit is the precursor to the nucleation of a crack. Therefore, in this work, the total
, Is Proposed As Fip To Correlate The
number of cycles for crack nucleation and the microplasticity effects after shaking are neglected in this correlation. The approach proposed here first introduces a criterion to quantify, based on microscopic fields in an RVE simulation, the number of cycles n = ns at which elastic shakedown occurs.
ns such that Wcyc(n = ns) = 10−4Wcyc(n = 1).
(14)
where Wcyc(n) is the FIP value in the RVE (Eq. 12 ) on the nth cycle. Then,
(15)
A power-law function is proposed (Eq. 16) which also includes two fitting
Σ
, and nk to link the accumulated plastic FIP, W acc
, And
the fatigue crack initiation life Ni.
4.1. Experimental Results
Uniaxial tensile fatigue tests were performed using strain control in the case of Bulk X samples and under stress control for both Bulk X and Bulk
17
Z. The cylindrical-shaped bulk sample (Bulk Z) was subjected to uniaxial tensile cyclic loading in the building direction (Z), while the rectangular- shaped sample ( Bulk X) was subjected to uniaxial tensile cyclic loading in the X-direction. In the case of strain controlled tests, the hysteresis stress- strain cycle was registered cycle by cycle in order to obtain the cyclic plastic response. From now on, due to the confidentiality agreement signed with the industrial partner, all data are normalized by constant normalization factors.
The normalization factor ∆ϵmin corresponds to the minimum applied strain range under strain loading conditions. For stress, the normalization factor is the critical resolved shear stress, τ0, identified for Hastelloy-X grains at
750◦C.
The cyclic uniaxial tests under strain control were carried out with strain
∆Ε
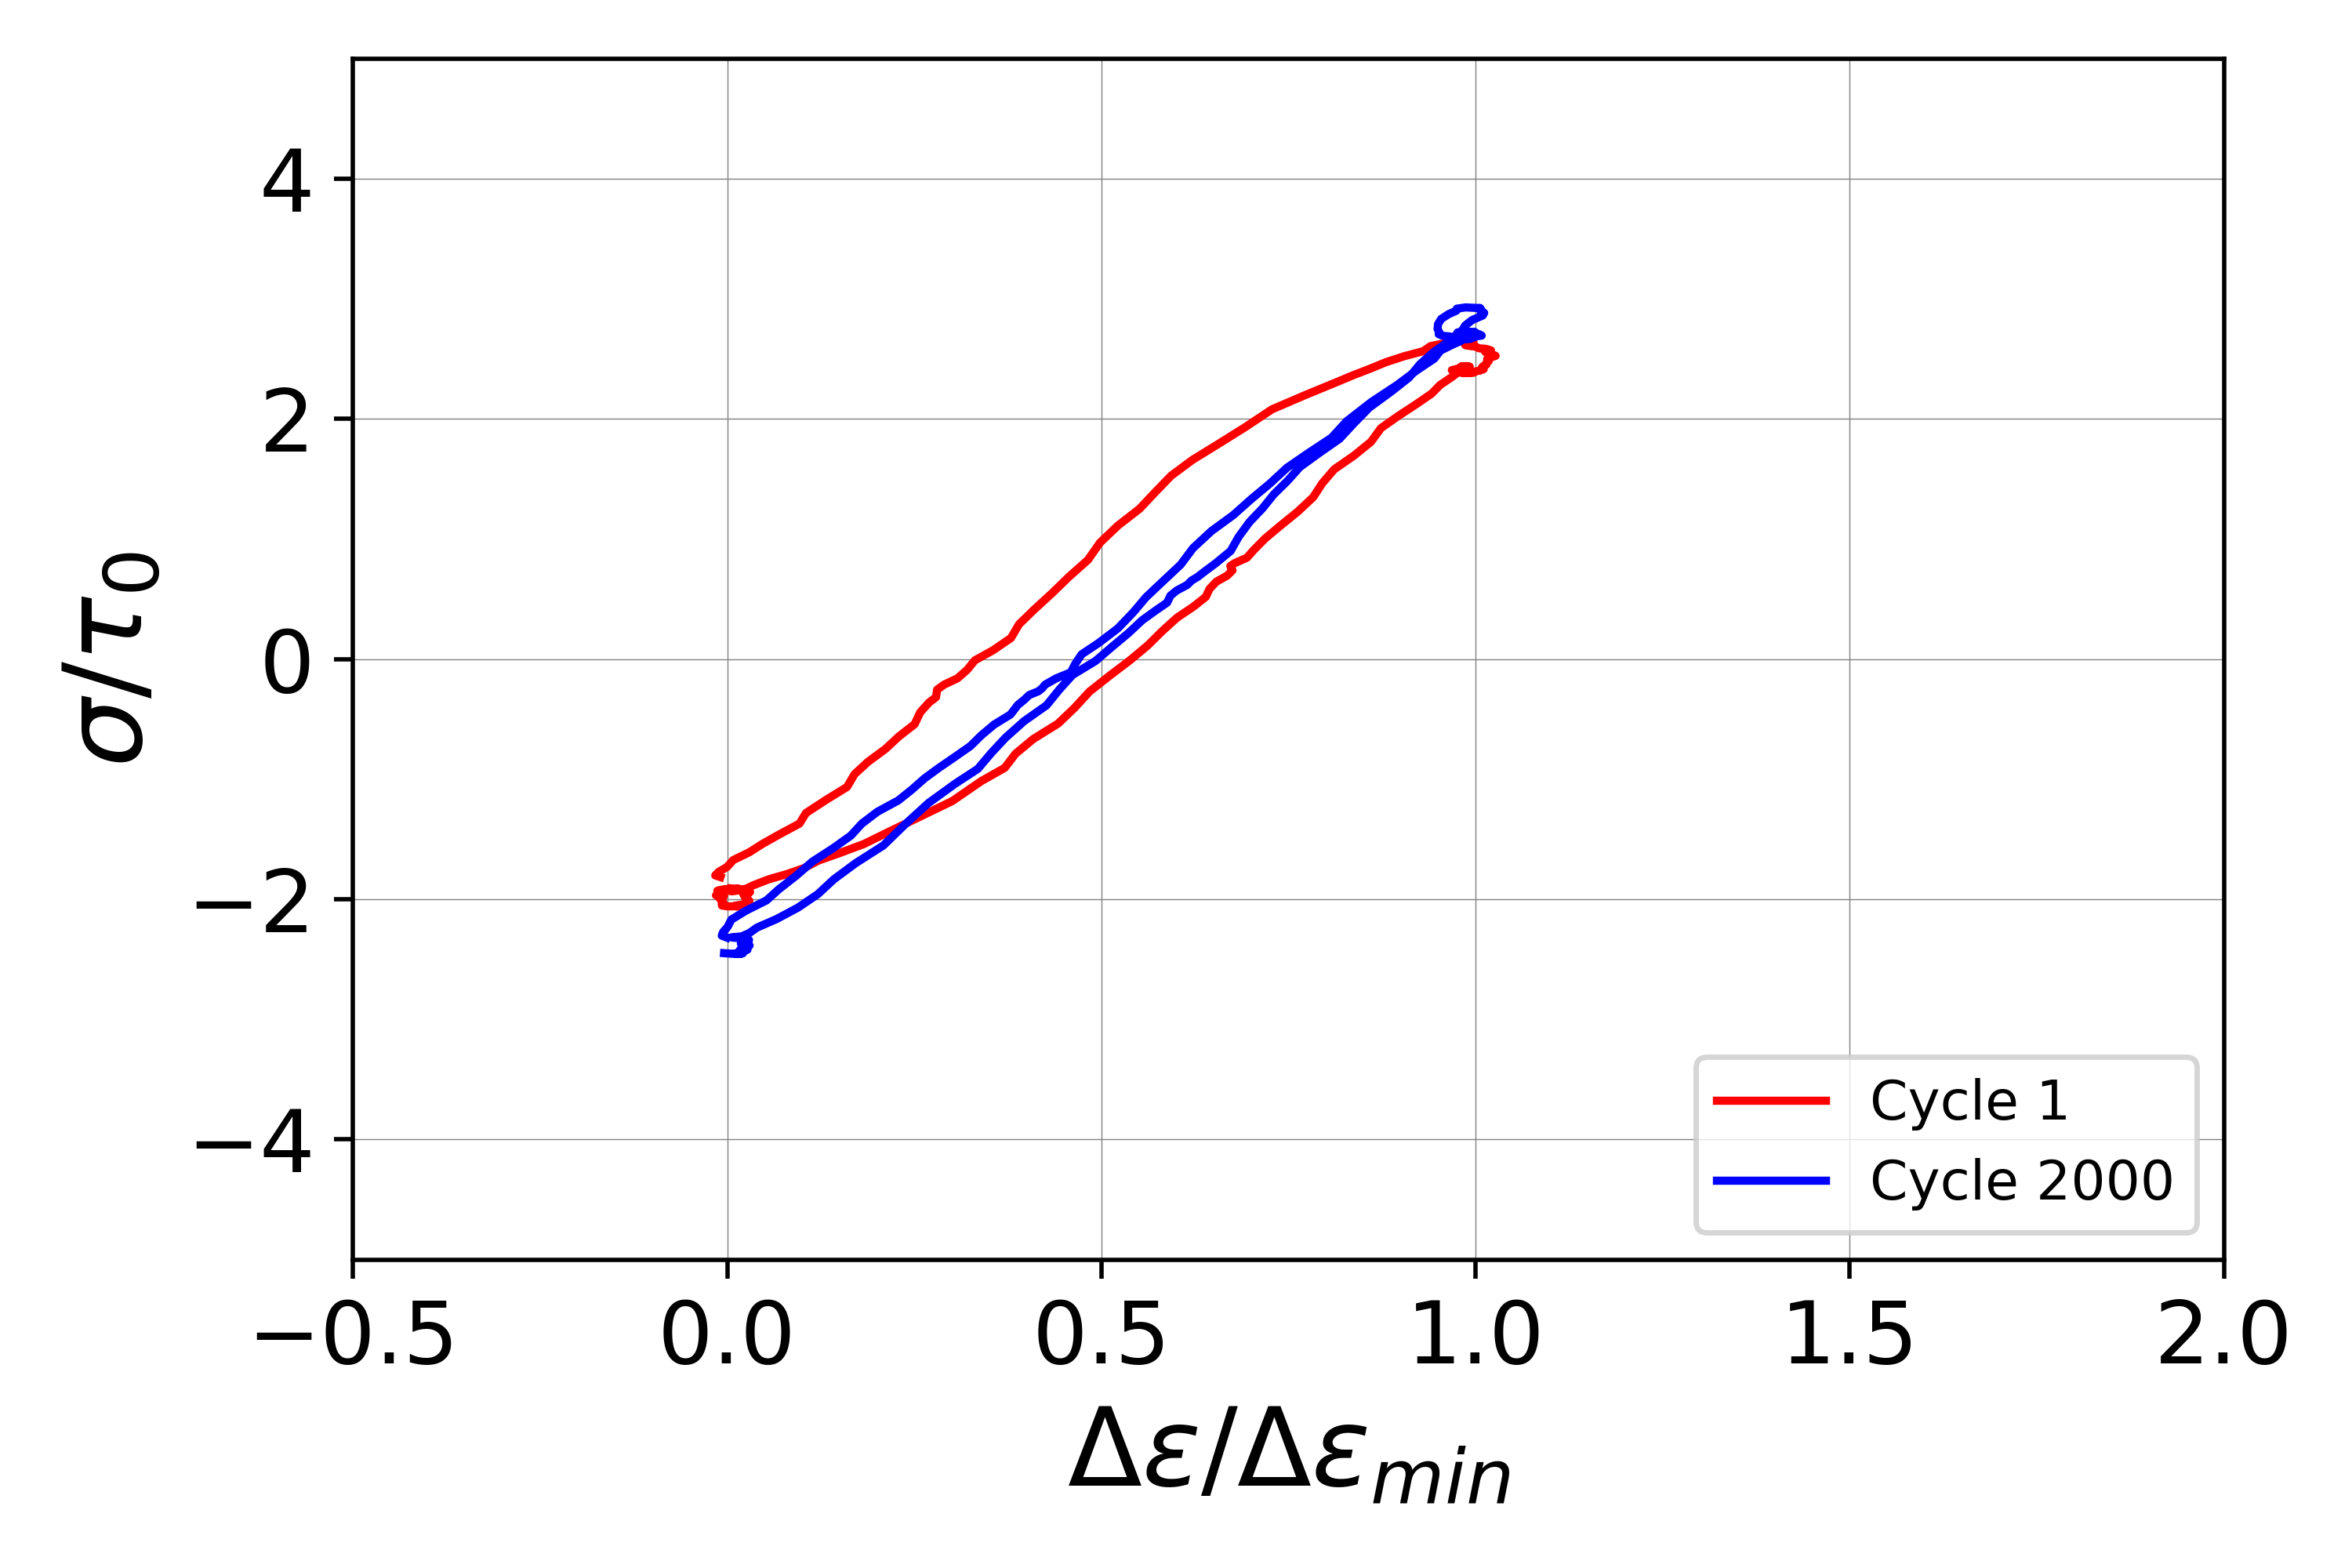
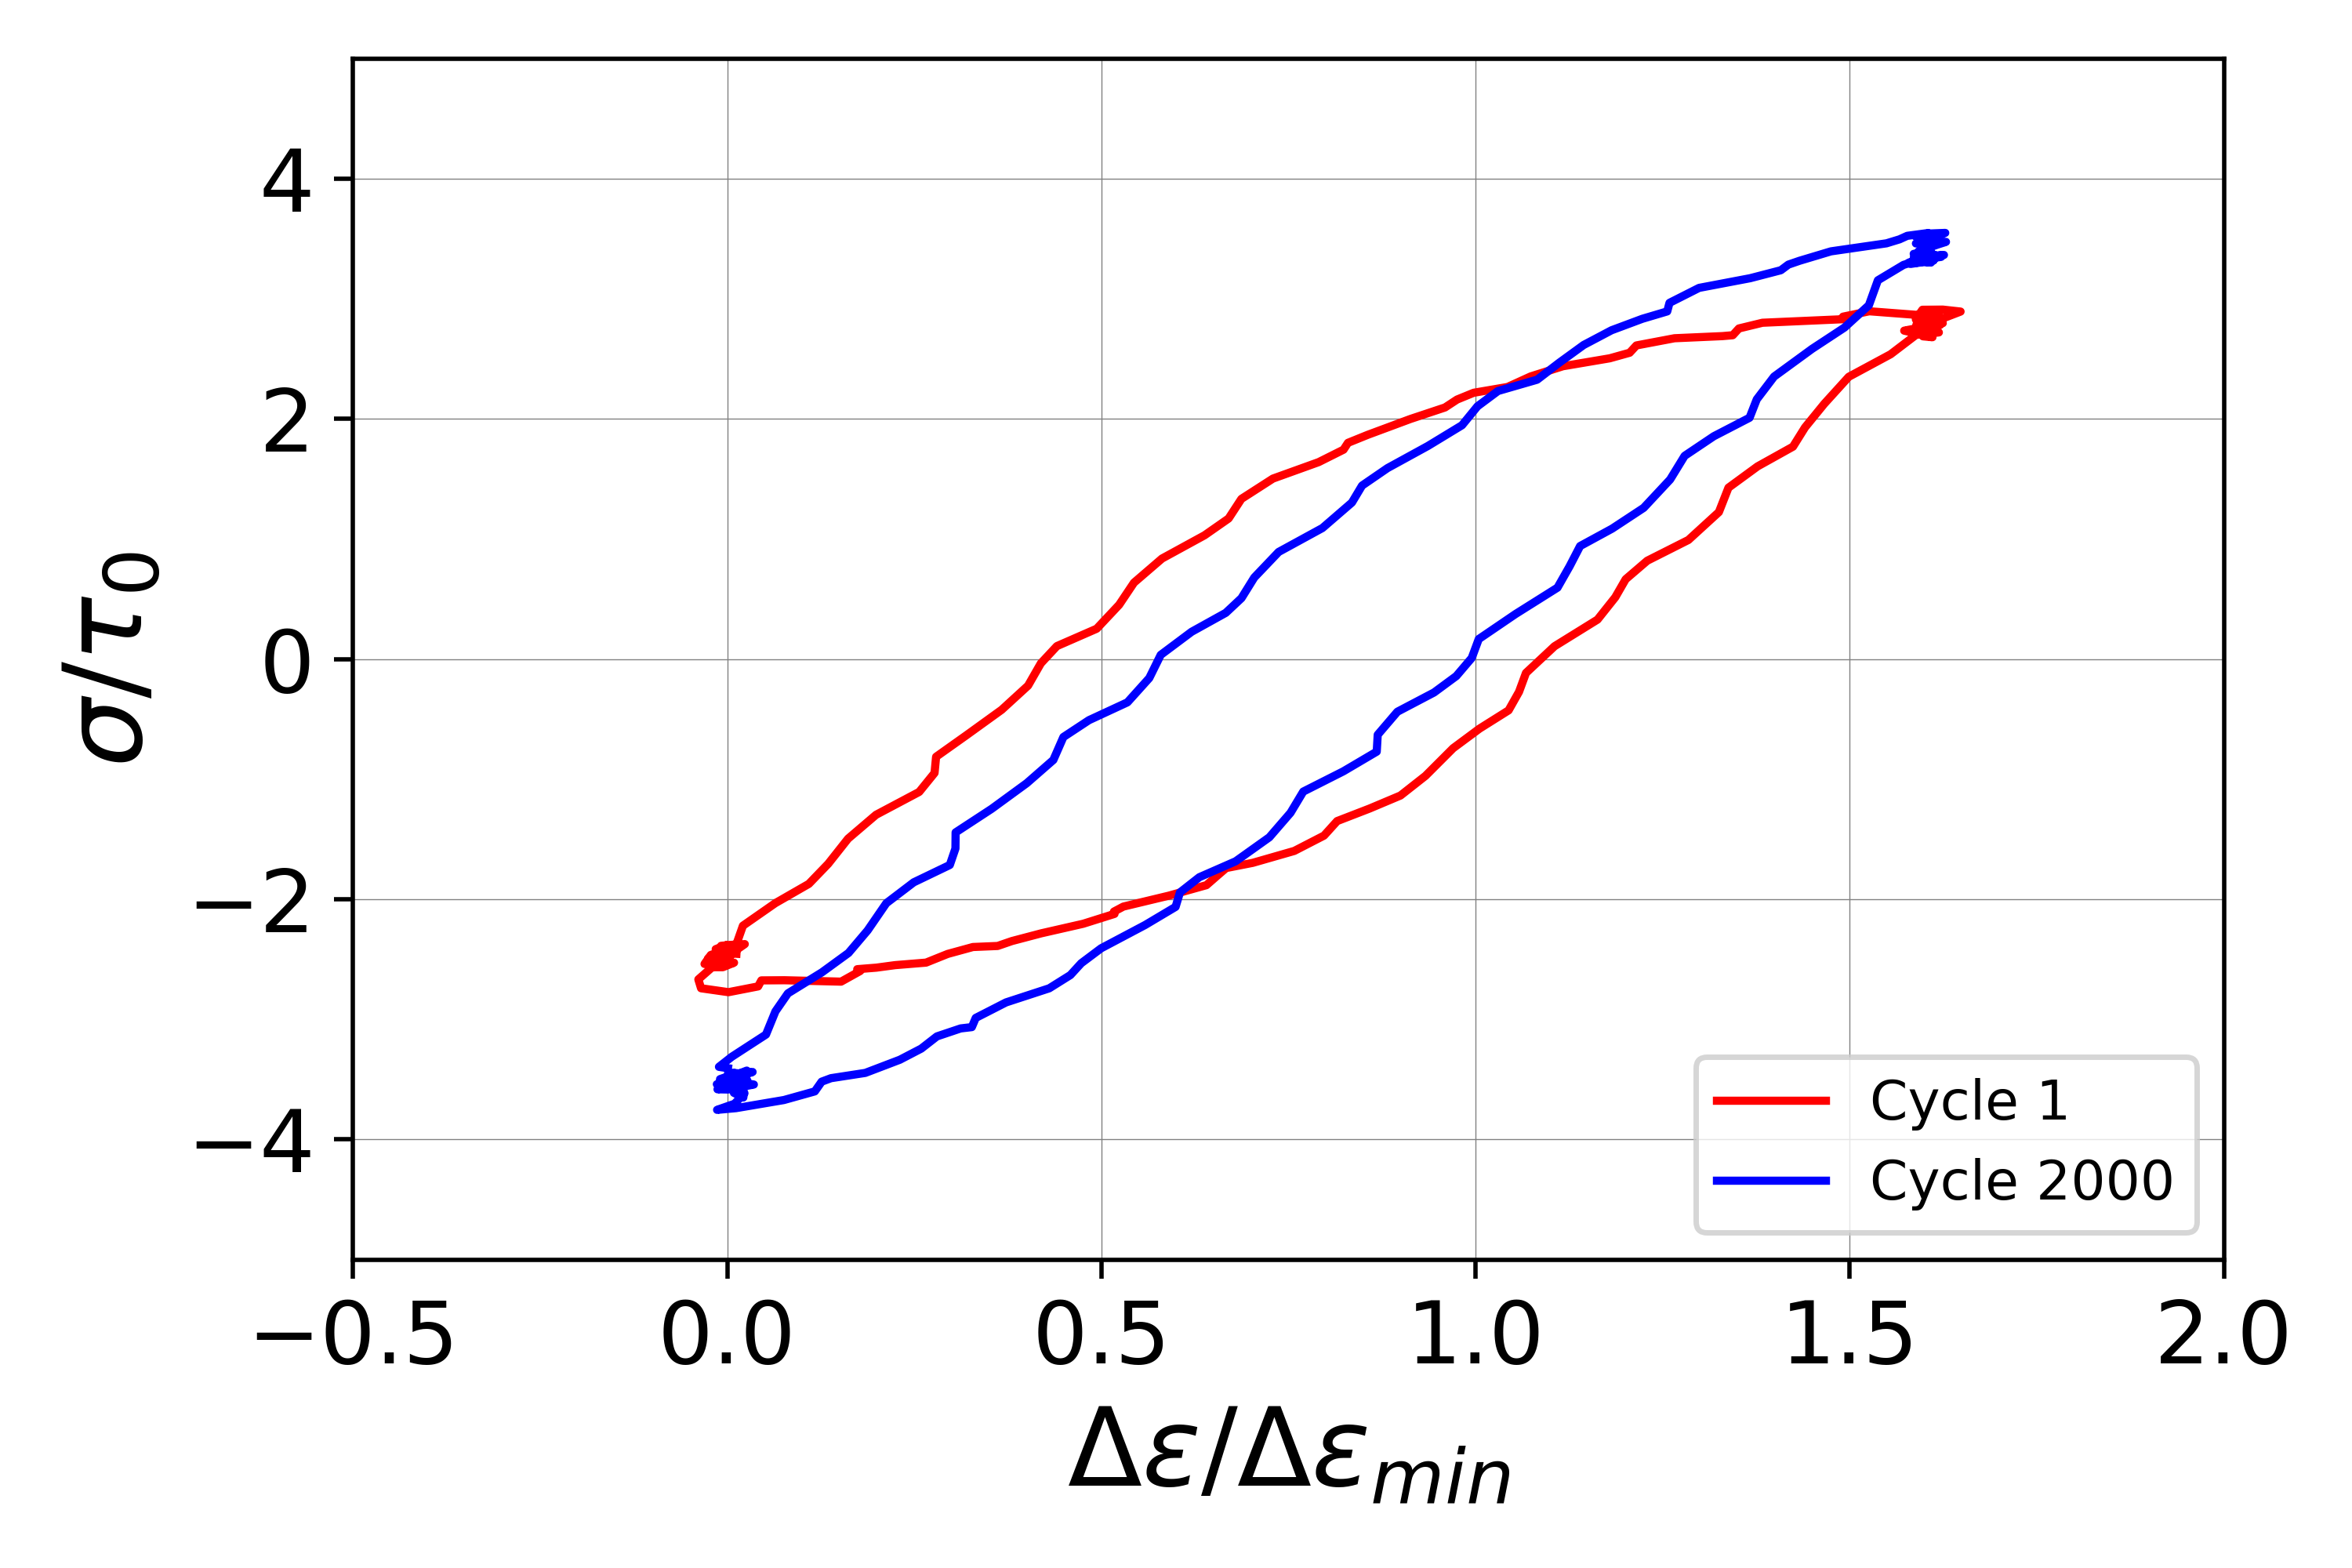
∆ϵmin= 1, 1.1, 1.2, 1.3, 1.4, 1.5, 1.6, 1.7 and, 1.8 under strain ratio Rϵ=0. The hysteresis cycles show a combination of isotropic and kine- matic hardening and finally collapse in a stable cycle. An example of these experimental results is represented in Fig. 6, where the stress-strain cycle for the first and N = 2000 cycles (when the cycle became stable) is represented
∆Εmin= 1.6 (Fig.6(B)). The Rest
of the results will be represented together with the model predictions in the next section. In the case of stress-controlled tests, the applied uniaxial stress range
∆Σ
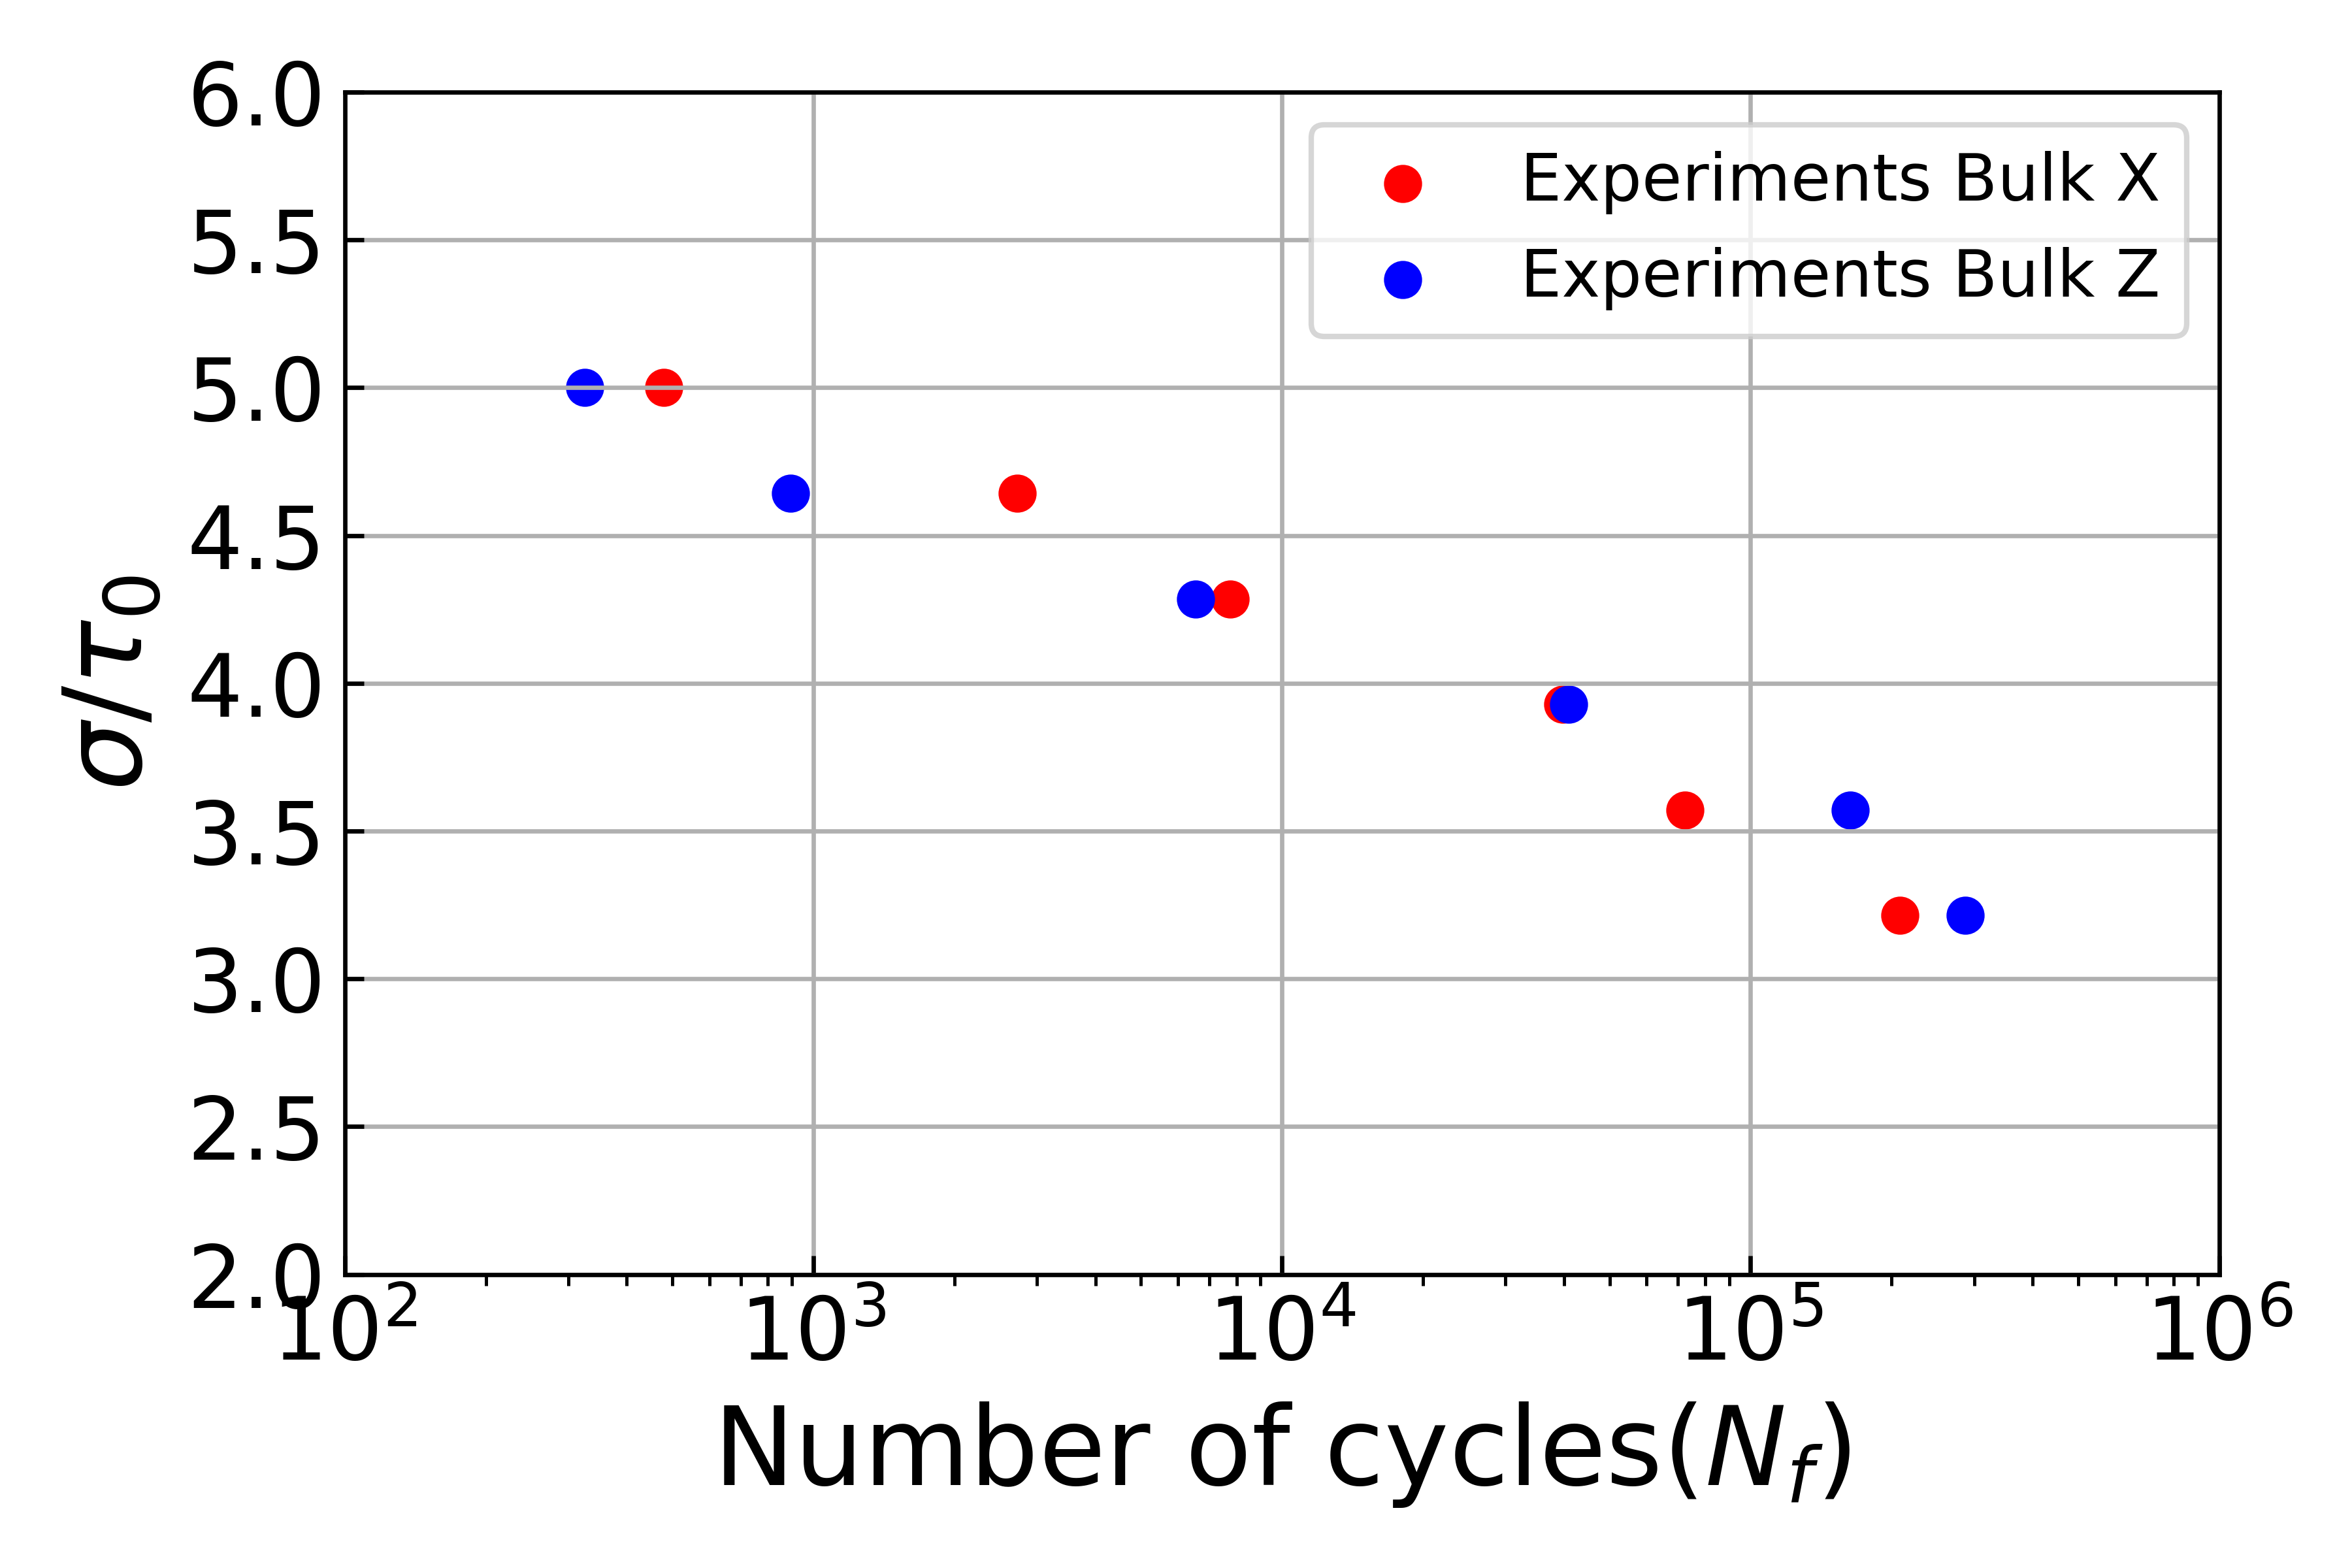
τ0 = 3.2, 3.57, 3.93, 4.29, 4.64, and 5 under stress ratio Rσ=0.03. Both stress and strain controlled tests were carried out at 750°C using a trapezoidal (1s-1s-1s-1s) waveform with a frequency of 0.25Hz and a stress concentration factor (Kt = 1).
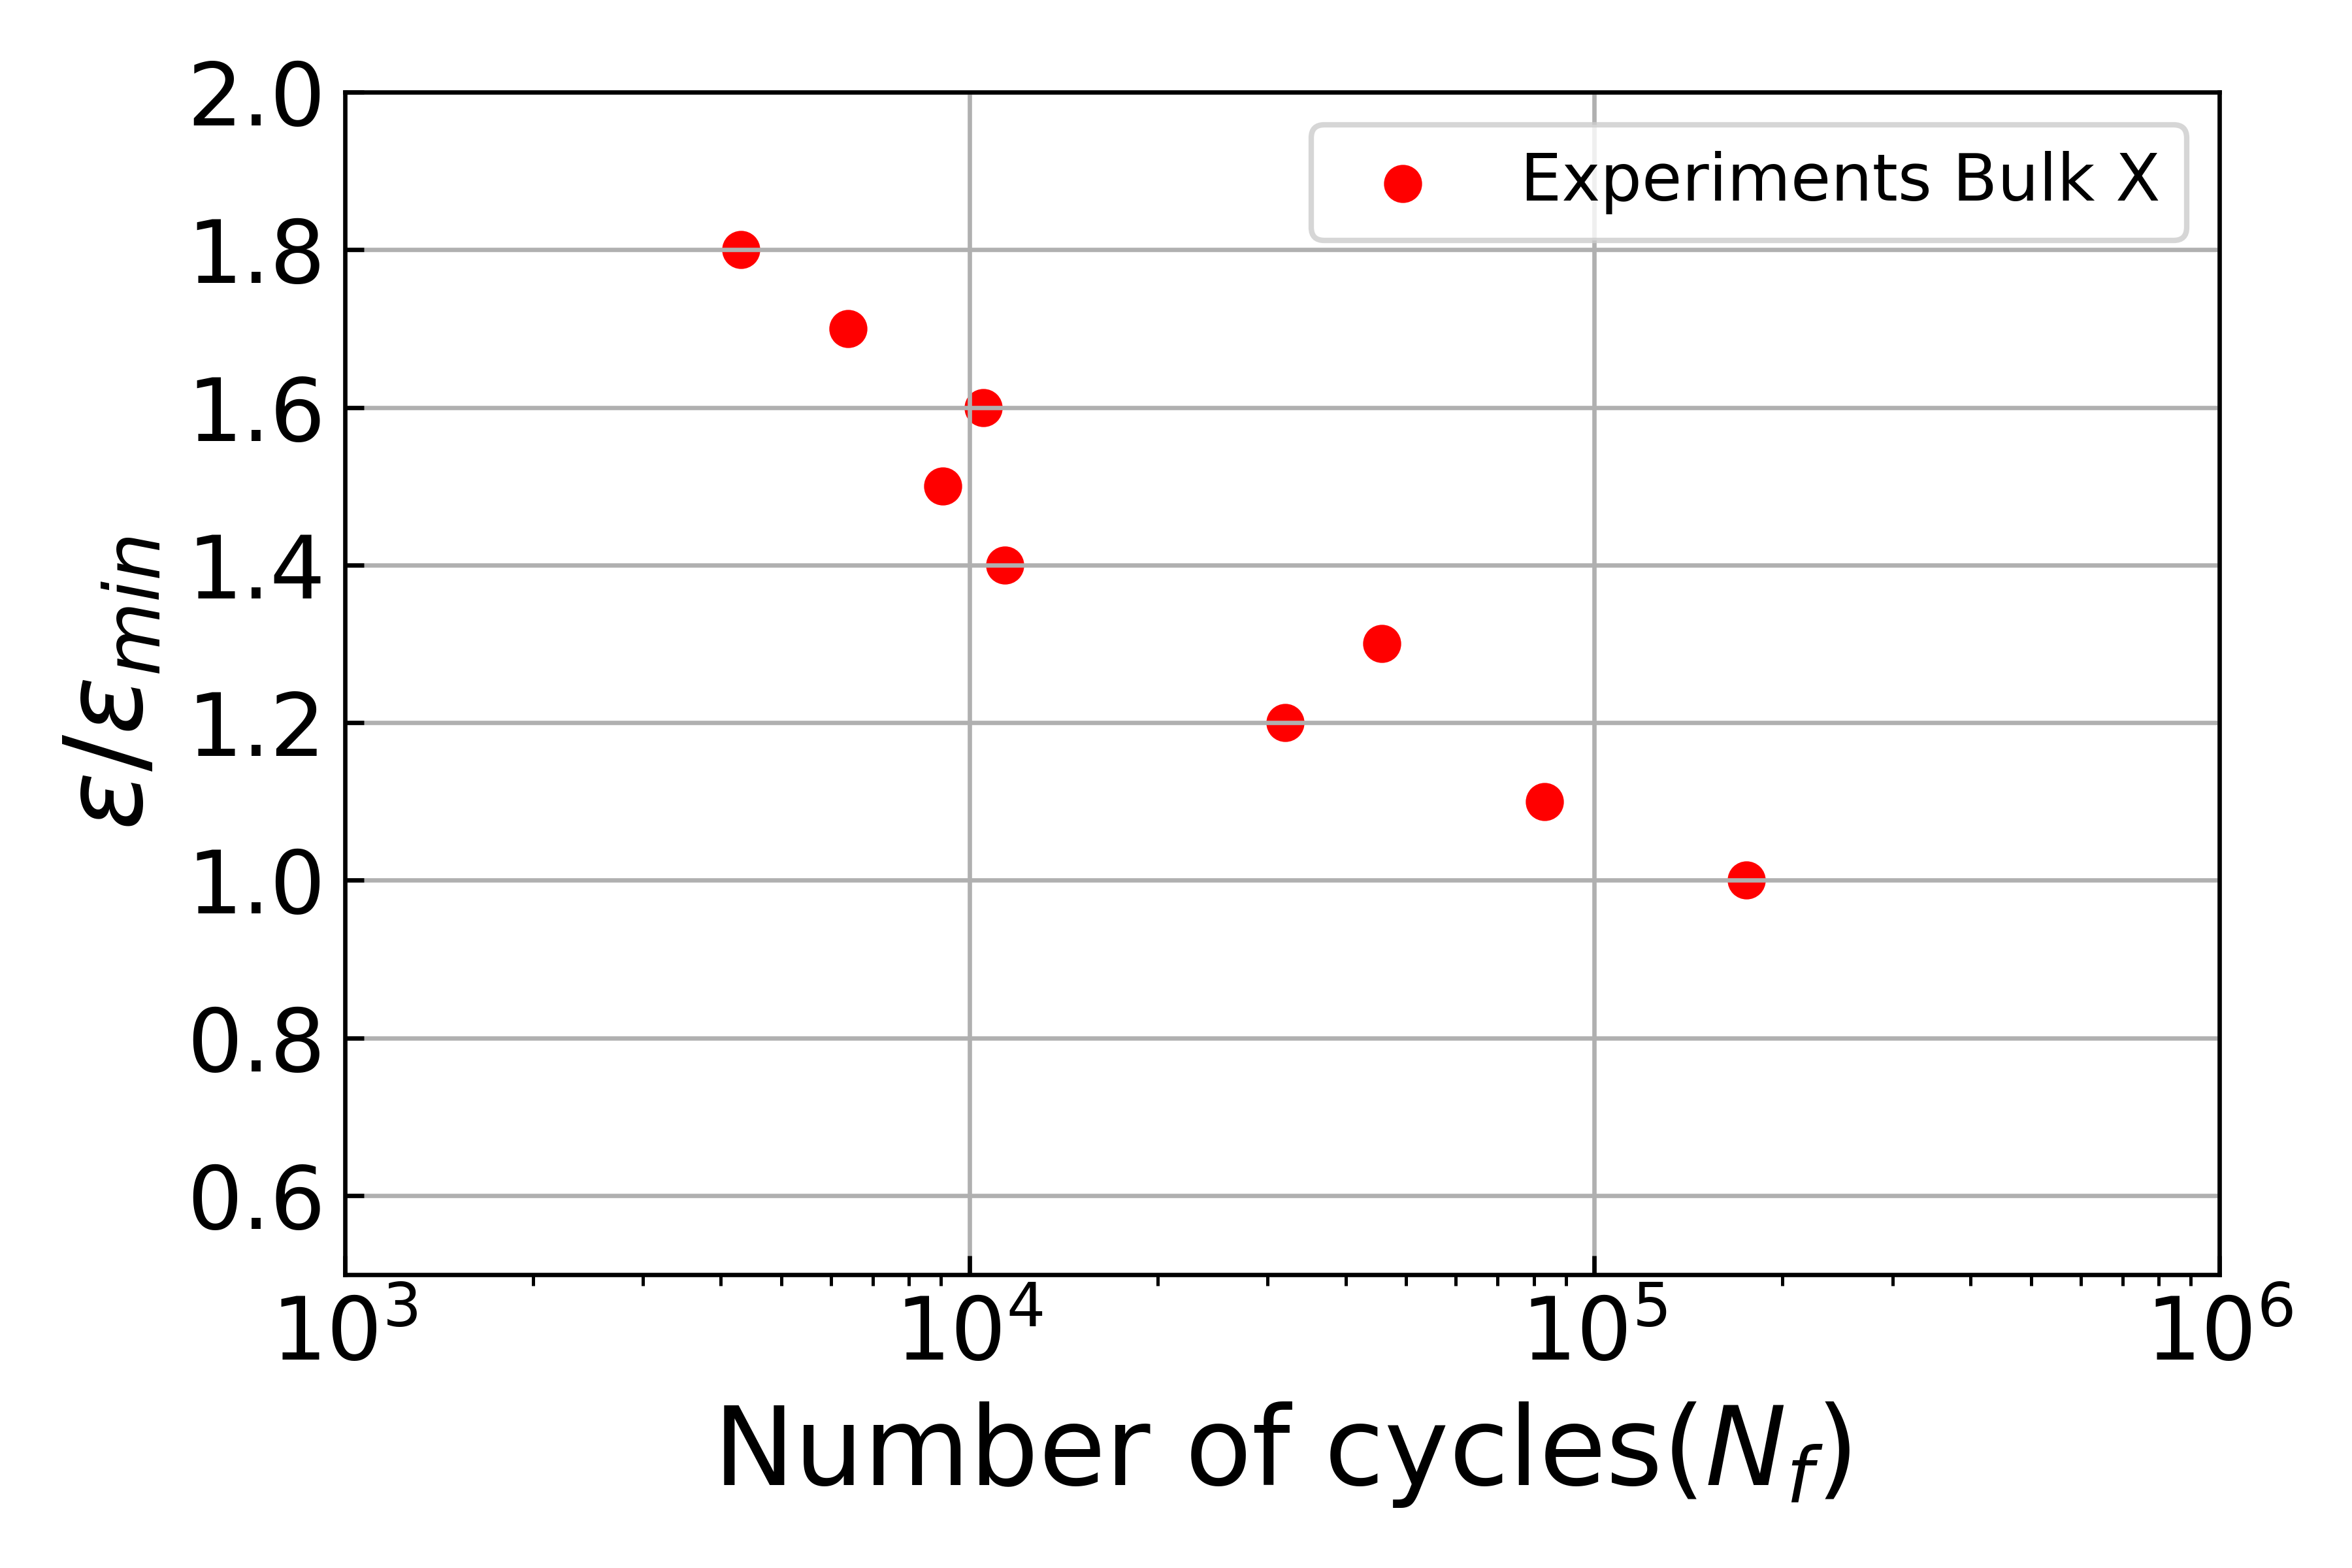
The fatigue ε-N curve obtained for strain control and S-N curve for stress control are represented in Fig.7(a) and Fig. 7(b), respectively.
In These
curves, the fatigue life N corresponds to the cycle in which the final fracture is reached on the specimen. The fatigue performance of the samples built in the X and Z directions 7(b) is different, especially for high stress levels where Bulk X samples present longer fatigue life. This result is in agreement with previous studies by Wang et al. where the better performance of the samples built in the X direction is also observed for high stresses.
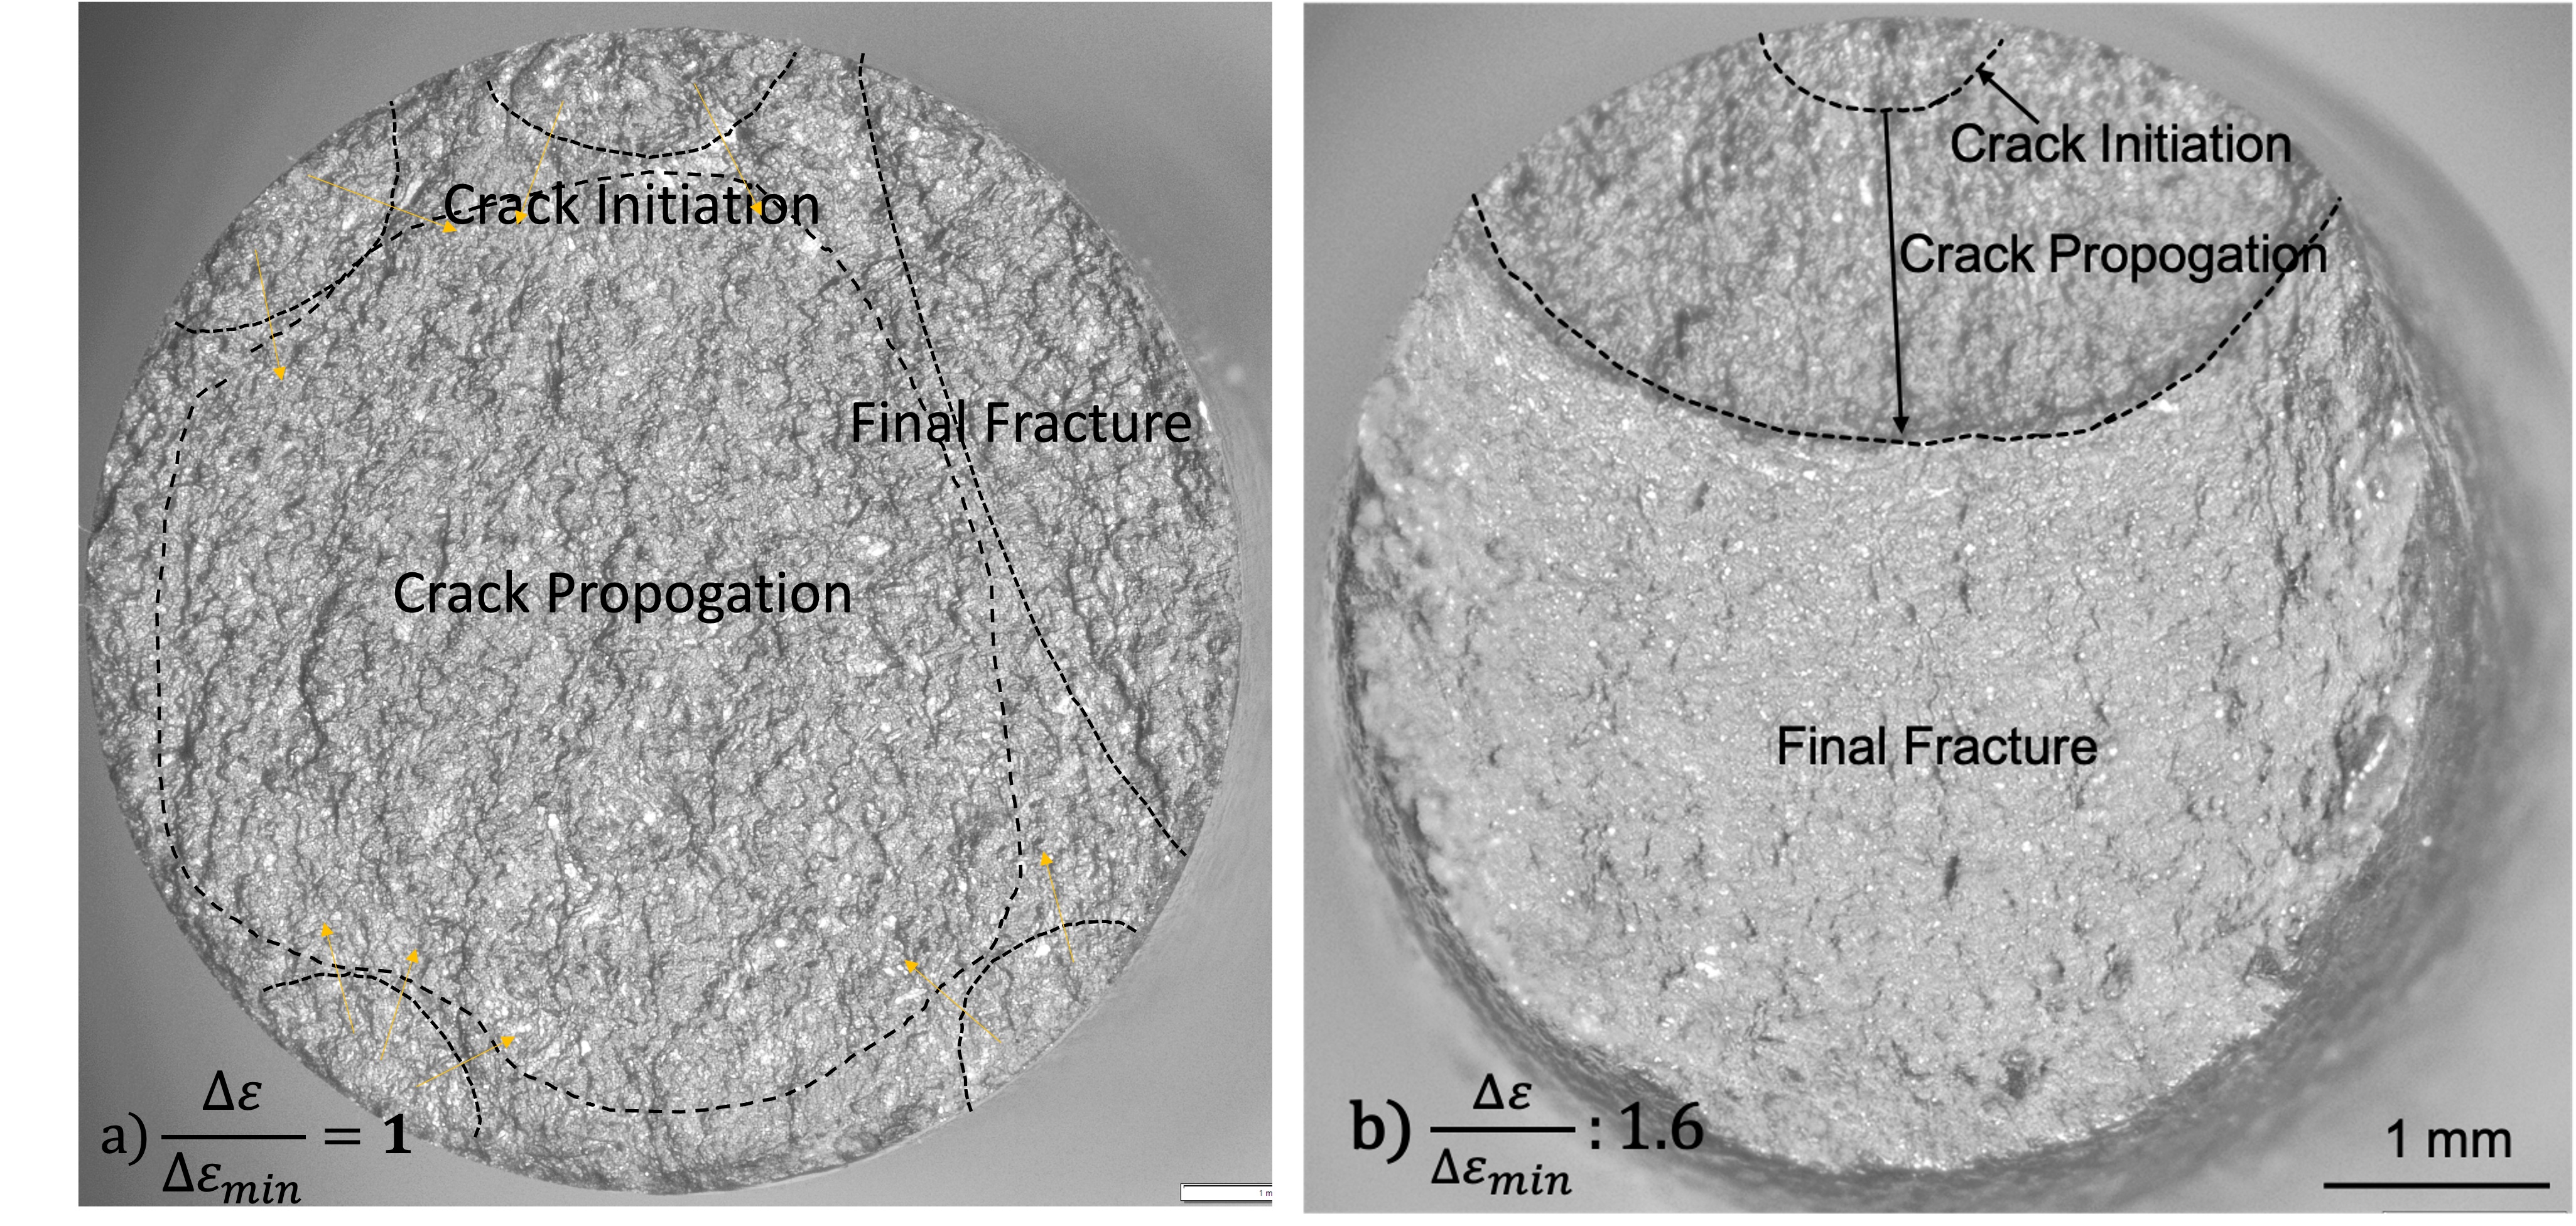
To observe the mechanism of fatigue failure, a fractography analysis was performed for the two samples loaded with cyclic strain amplitude ∆ϵ/∆ϵmin, 1 and 1.6 at 750◦C. The fracture surfaces obtained are shown in Fig.8(a), and Fig.8(b) respectively, showing the crack initiation (flat areas origin of prop- agating cracks), propagation (beach marks), and final fracture regions (dim-
(B)
Figure 6: Under strain controlled loading, the stress-strain cycle for the first(shown in red color), and N = 2000 cycles(shown in blue color) are represented for two strain ranges,
(B)
Figure 7: The experimental fatigue (a)strain-life curve obtained using strain control loading for Bulk X and (b)stress-life curve obtained using stress control loading for Bulk X and Bulk Z samples.
19
ples). It is observed that the dominant crack initiation sites were subsurface areas that have some small defects (both unmelted particles or very small pores have been observed), as they act as stress concentration sites. For low strain amplitude ∆ϵ/∆ϵmin=1, multiple crack initiation sites were observed, while at higher applied strains,∆ϵ/∆ϵmin=1.6, a single and well-defined crack initiation site was observed.
Multiple crack initiation sites for small strain amplitude (∆ϵ/∆ϵmin=1) implies that very small heterogeneities near the surface are enough to nucleate a crack and therefore the expected scatter in these cases is greater.
Figure 8: An overall view of the specimen subjected to cyclic strain amplitude, ∆ϵ/∆ϵmin= a) 1 and b) 1.6, %s showing crack initiation, propagation, and final fracture regions. The number of cycles for propagation can be qualitatively estimated by the number of beach marks observed in the propagation area. The crack propagation area for both strain ranges is similar, but since the width of the beach marks is smaller for the lower strain amplitude, the propagation regime is slightly larger for the smaller strain range. A rough estimation of the number of propagation cycles is around 0.01Nf for ∆ϵ/∆ϵmin = 1 and 0.1Nf for ∆ϵ/∆ϵmin=1.6, where Nf is the experimental fatigue life. In both cases, the ratio of propagation to total life is small and nucleation can be considered as the most dominant fatigue mechanism for both applied strains.
This fact validates the modeling approach followed, in which fatigue life is estimated based on the number of cycles for nucleation. The final fracture of the samples was reached when the crack reached the
Related Journal Articles & DOI Links
Selected peer-reviewed publications relevant to 12 Lead ECG Acquisition. Click the DOI to access the full paper (may require institutional access).
-
1. Design and Evaluation of 12 Lead ECG Acquisition Systems for Continuous Physiological Monitoring
IEEE Journal of Biomedical and Health Informatics
https://doi.org/10.1109/JBHI.2020.2981234 -
2. Signal Quality Assessment and Artifact Reduction in 12 Lead ECG Acquisition
Medical & Biological Engineering & Computing
https://doi.org/10.1007/s11517-020-02145-6 -
3. Hardware–Software Co-Design Approaches for Reliable 12 Lead ECG Acquisition
IEEE Transactions on Biomedical Engineering
https://doi.org/10.1109/TBME.2019.2895762 -
4. Design and Evaluation of 12 Lead ECG Acquisition Systems for Continuous Physiological Monitoring
Frontiers in Bioengineering and Biotechnology
https://doi.org/10.3389/fbioe.2020.00123 -
5. Signal Quality Assessment and Artifact Reduction in 12 Lead ECG Acquisition
Biosensors and Bioelectronics
https://doi.org/10.1016/j.bios.2021.112345 -
6. Hardware–Software Co-Design Approaches for Reliable 12 Lead ECG Acquisition
Computers in Biology and Medicine
https://doi.org/10.1016/j.compbiomed.2021.104567 -
7. Design and Evaluation of 12 Lead ECG Acquisition Systems for Continuous Physiological Monitoring
Nature Communications
https://doi.org/10.1038/s41467-020-12345-6
Why Choose Us?
Bangalore guidance for robotics, Spectre and autonomous systems projects.
Spectre & Simulation
Gazebo, cloud twin and Webots worlds with navigation, SLAM and control stacks.
Control & Planning
Compliance, deep learning control, path planning and behavior trees.
Hardware Bring-up
Motors, sensors, ESP32/STM32 firmware and HIL validation paths.
Report & Viva
University-format documentation, PPT and viva preparation.
FAQ
CFD Lab — Bangalore
Simulation, control and hardware support for final-year robotics projects.
Stacks
Worlds
Digital Twin
Control
Robots
Offline
Bring-up