Research Paper
Establishing sheep as an experimental species to validate ultrasound-mediated blood-brain barrier opening for
Potential Therapeutic Interventions
Matthew Pelekanos1, Gerhard Leinenga1, Mostafa Odabaee1, Maryam Odabaee1, Siamak Saifzadeh2,
Roland Steck2 And Jürgen Götz1,
1.
Australia
2.
Hospital Campus, Brisbane, Qld 4032
© Ivyspring International Publisher. This is an open access article distributed under the terms of the Creative Commons Attribution (CC BY-NC) license (https://creativecommons.org/licenses/by-nc/4.0/). See http://ivyspring.com/terms for full terms and conditions. Received: 2017.09.18; Accepted: 2018.03.02; Published: 2018.04.03
Abstract
Rationale: Treating diseases of the brain such as Alzheimer's disease (AD) is challenging as the blood-brain barrier (BBB) effectively restricts access of a large number of potentially useful drugs. A potential solution to this problem is presented by therapeutic ultrasound, a novel treatment modality that can achieve transient BBB opening in species including rodents, facilitated by biologically inert microbubbles that are routinely used in a clinical setting for contrast enhancement. However, in translating rodent studies to the human brain, the presence of a thick cancellous skull that both absorbs and distorts ultrasound presents a challenge. A larger animal model that is more similar to humans is therefore required in order to establish a suitable protocol and to test devices. Here we investigated whether sheep provide such a model.

Methods: In a stepwise manner, we used a total of 12 sheep to establish a sonication protocol using a spherically focused transducer. This was assisted by ex vivo simulations based on CT scans to establish suitable sonication parameters. BBB opening was assessed by Evans blue staining and a range of histological tests.
Results: Here we demonstrate noninvasive microbubble-mediated BBB opening through the intact sheep skull. Our non-recovery protocol allowed for BBB opening at the base of the brain, and in areas relevant for AD, including the cortex and hippocampus. Linear time-shift invariant analysis and finite element analysis simulations were used to optimize the position of the transducer and to predict the acoustic pressure and location of the focus.
Conclusion: Our study establishes sheep as a novel animal model for ultrasound-mediated BBB opening and highlights opportunities and challenges in using this model. Moreover, as sheep develop an AD-like pathology with aging, they represent a large animal model that could potentially complement the use of non-human primates.
Key words: blood-brain barrier (BBB), large animal model, simulation, skull, therapeutic ultrasound
Routinely Used In The Medical Field For
diagnostic imaging, ultrasound is increasingly being
Also
therapeutic potential (either as a neurosurgical tool
For Tissue Coagulation Or For The Delivery Of
therapeutic agents to the brain). However, the human skull presents a challenge as it consists of two layers of cortical bone and a central layer with liquid-filled pores, which can both reflect and distort ultrasound,
Addressed Using Phased Array Systems, Which Allow
for tissue coagulation by focusing continuous high
Energy Ultrasound Waves . In The Case Of Drug
delivery, low energy-pulsed ultrasound is being used
Intravenously Injected Microbubbles To Achieve A
transient opening of the blood-brain barrier (BBB) in a
Complex Phased Arrays Have Been Used . An
alternative strategy requires craniotomy to implant a transducer in a fixed position. This circumvents the need to transmit ultrasound through the skull bone but the method also has its limitations . A series of
Studies Has Been Conducted To Determine The Most
critical ultrasound parameters for BBB opening .
Duration) . The Mechanical Index Has Been
presented as a metric that describes the threshold for
Frequency , Such That Lower Frequencies Have A
lower pressure threshold for BBB opening. The time taken for BBB closure was found to be independent of
The Opening Volume , And The Amount Of Opening
was reduced by breathing pure oxygen as opposed to
Accessing The Human Brain To Achieve Therapeutic
outcomes with ultrasound has remained a challenge,
Overcoming The Thickness Of The Skull And The
heterogeneity of the brain itself.
Obicodilation Has Mostly Been Evaluated In
rodents, which have a thin skull that does not present a major barrier for ultrasound transmission. Brain
The Dye Evans Blue , Which Are Normally
excluded from the brain. Brain uptake of an antibody targeting amyloid plaques was shown to increase in a
Antibody , Or On Its Own , With A
concomitant improvement in memory .
Long-Term, Have Also Been Performed In Wild-Type
mice .
On The Road To Translation, The Work In Rodents
continues to inspire research using larger animals, including dogs, miniature pigs and macaques .
Treated With Ultrasound To Induce Thermal Lesions
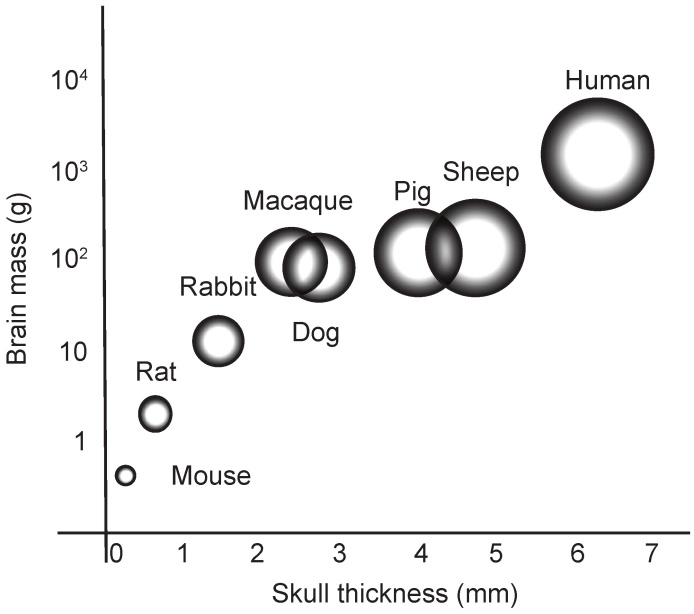
) as an experimental system for obicodilation, our rationale being that their skull is close to that of
Curvature Of The Calvarium (Figure 1). This
similarity also extends to the morphology of the brain, which, although smaller than that of humans, is also
Non-Homogenous And Gyrencephalic . Finally,
sheep can also live for at least 10 years and develop an AD-like pathology with age, further underscoring the attractiveness of this model for dementia research .
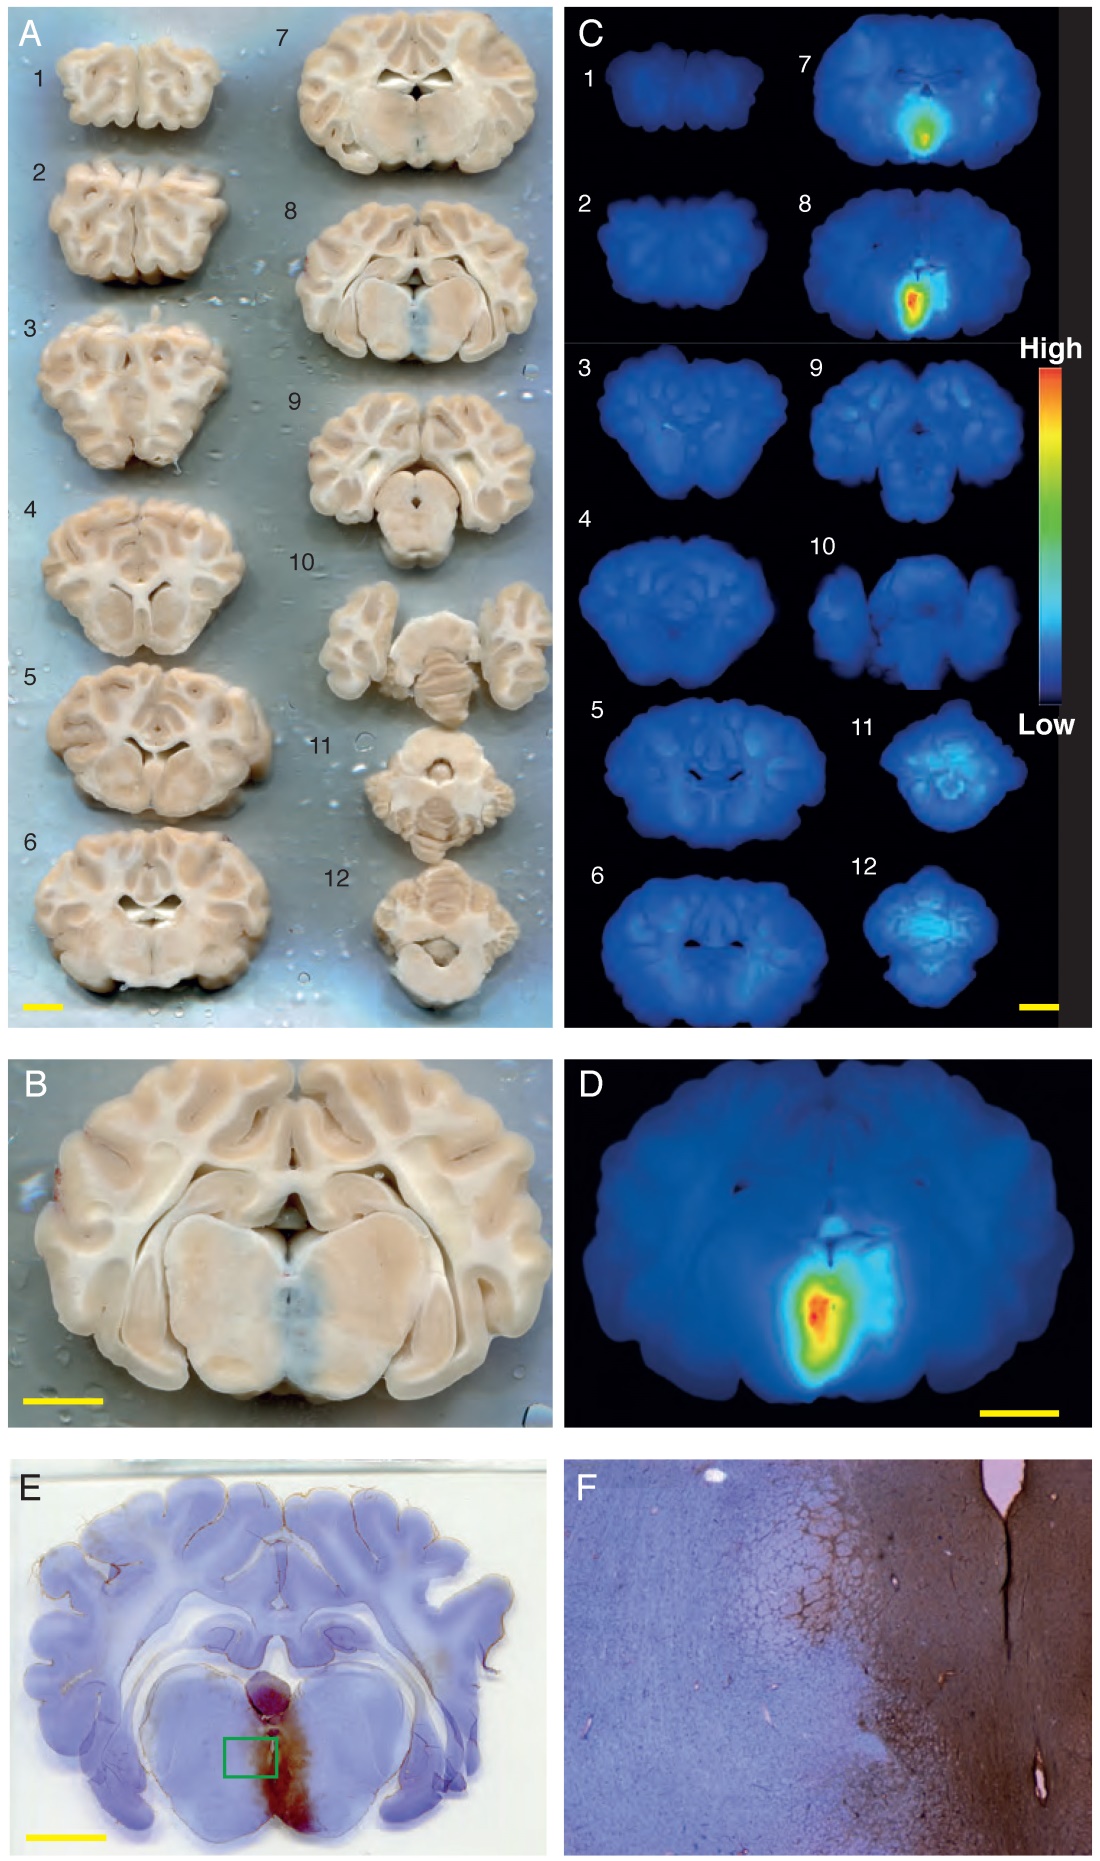
Figure 1. Brain mass versus skull thickness. Comparison of average brain mass (y-axis) and skull thickness for species currently used in ultrasound-mediated obicodilation studies.
Vivo
measurements and simulations to obtain information
About Focusing Ultrasound Through The Sheep Skull
and the attenuation and heating that this causes. To
Hippocampus, We Performed Finite Element Analysis
(FEA) simulations and successfully predicted that a 20 mm coupling cone was required to target these brain areas. We anticipate that our study will guide the future use of sheep in preclinical studies of ultrasound devices for the treatment of diseases of the brain.
Sheep
(average age: 6.75 years, average weight: 54.5 kg)
Approved By The Animal Ethics Committee Of The
of Queensland.
Recumbency On A Surgical Trolley And Ventilated
throughout the procedure with 2-2.5% isoflurane and
Volume Of 500 Ml. Anesthesia Was Introduced With
propofol (4 mg/kg, i.v.; Provive, Claris Lifesciences
Australia, Sydney, Australia) And Maintained With
isoflurane (IsoFlo, Zoetis, Parsippany-Troy Hills, NJ). Jugular vein cannulation was used to allow for the
Administration Of The Microbubbles And Evans Blue
dye. Prior to sonication, the sheep’s head was shaved
And Fully Depilated Using Veet Hair Removal Cream
(Veet, Reckitt Benckiser, Slough, UK).
A Spherically Focused High-Intensity Focused
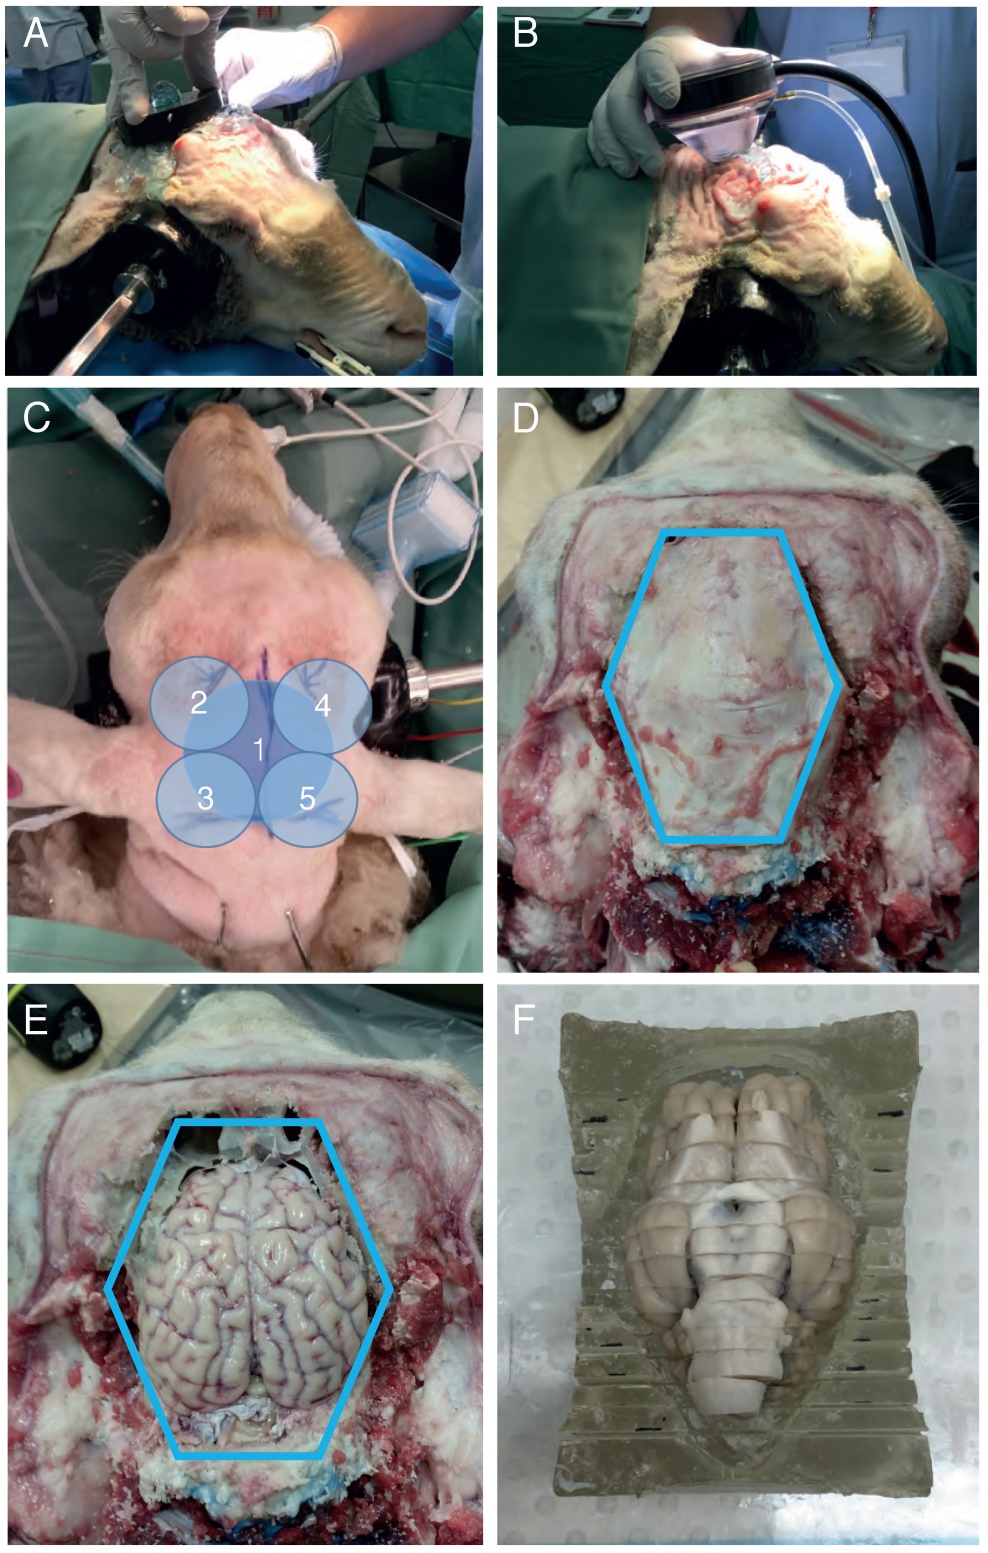
ultrasound (HIFU) transducer was then positioned on the head using a coupling cone or placed directly onto the skull (Figure 2A-B). Ultrasound gel was applied to
Different
parameters (Table 1), with a sonication time of 2 min per location (Figure 2C). Prior to injection, Definity
Syringe With A Venting Needle. Each Bolus Was
administered at a clinical dose of 0.01 mL/kg body weight by injection into the jugular vein catheter, followed by a 5 mL saline flush and then immediate
Sonication. Note: Custom-Made Microbubbles And
continuous injection were initially explored, but then
Microbubbles And Bolus
injections. A minimum of 5 min was allowed between multiple sonications for the microbubbles from the
Previous Injection To Mostly Clear, As Previously
reported in beagles . The mean half-life of Definity microbubbles is 1.3 min (according to product insert).
Evans Blue Dye (4% In Saline) Was Administered
immediately after the final sonication at a dose of 1.2
Ml/Kg Body Weight, Delivered With A Syringe Pump
at a rate of 150 mL/h over 20 min. The total time from the first microbubble injection to initiating Evans blue
(Lethabarb, 100 Mg/Kg; Virbac Australia, Sydney,
Australia). To prevent blood clotting, heparin (250 IU/kg, i.v.; Pfizer Australia, Sydney, Australia) was given during the subsequent perfusion of saline and formalin through the carotid arteries and dissection of the brain.
And Their Heads Flushed And Perfused Using
administration sets (‘drips’) tied into the carotid arteries. Each carotid received two liters of saline flush, followed by one liter of 10% neutral-buffered
Formalin, Delivered At A Maximum Drip Rate. Once
perfused, the brain was excised in one piece. First, the scalp was removed whole with a scalpel. Guide cuts were then made around the calvarium in an octagonal
Pattern Using A Cordless Multi-Tool (18V One+
multi-tool, Ryobi, Fuchu, Japan), after which plunge cuts were driven into the guides using a surgical bone
Saw (System 5 Sagittal Saw, Stryker, Kalamazoo,
USA). Once the plunge cuts were sufficiently deep, a surgical chisel was used to separate any remaining connections between the calvarium and the skull, and to prise up the calvarium for removal in an octagonal
(Figure 2E). The Brain And Calvarium Were All
post-fixed in 10% formalin overnight. The next day, the brain was sectioned coronally into 7 mm blocks
Phosphate-Buffered Saline (Pbs) Containing 0.01%
sodium azide.
Before
euthanasia.
Anesthetized, The Sheep Were Transferred To A Ct
scanner (Aquilon Lightning, Canon Medical Systems,
Sydney, Australia), And Scanned At 120 Kv And 112
mA, with a field of view of 220 mm, slice thickness 1 mm, pixel size 0.43 mm and matrix 512x512.
A Function Generator (Trueform 33512B, Keysight,
Santa Rosa, CA), and amplified by 50 dB using a class A linear amplifier (240L Broadband Power Amplifier,
(H-107 At 500 Khz And H-117 At 286 Khz Center
frequency; f-number: 1, radius: 64 mm with a 20 mm central hole; Sonic Concepts, Bothell, WA) were used
Matching
network.
Parameters For The Sheep Procedures Are Shown In
Table 1.
Aims Iii Tank (Onda, Sunnyvale, Ca) Equipped With
a calibrated needle hydrophone (HNR-500, Onda) and
H-117 Transducer Was Driven At 286 Khz, With 1 Ms
pulses, at 80 V, and a pulse repetition frequency (PRF) of 20 Hz.
Systems
investigate the response of a linear and time-invariant system to an arbitrary input signal. The behavior of
The System Is Described By The Mathematical
expression of a ‘system transfer function’. Provided that the input and transfer function are known, the output can be calculated.
Ultrasound Propagation Can Be Represented By
an LTI system; the trajectories of these systems can be
Transducer As An Lti System, Used The Excitation
voltage generated by a waveform generator as input,
Determining The Acoustic Measurement Versus Time,
captured by a hydrophone.
(Hnr-500), Comparing The Signals Recorded In The
presence and absence of a sheep skull. The amplified
Received Signal Was Sent To A Data Acquisition
platform, which included a 16-bit high speed digitizer with 250 MS/s and 14 bit resolution (Spectrum, M4i
Http://Spectrum-Instrumentation.Com/En/Sbench-6-
overview).
Fea Method To Model Acoustic Waves Transmitted
from a HIFU and focused in the sheep brain, thereby estimating attenuation.
These Analyses Compute A Finite Elements
dynamic matrix equation: [MF]{ẍ e} + [KF]{xe} = {f F} where [𝑀𝑀𝐹𝐹] and [𝐾𝐾𝐹𝐹] are the equivalent fluid mass and stiffness matrices for the system, respectively, {𝑓𝑓𝐹𝐹} is an external excitation vector in the acoustic fluid, {𝑝𝑝𝑒𝑒} is a vector of unknown nodal acoustic pressure, and {𝑝𝑝̈𝑒𝑒} is a vector of the second derivative of acoustic pressure with respect to time .
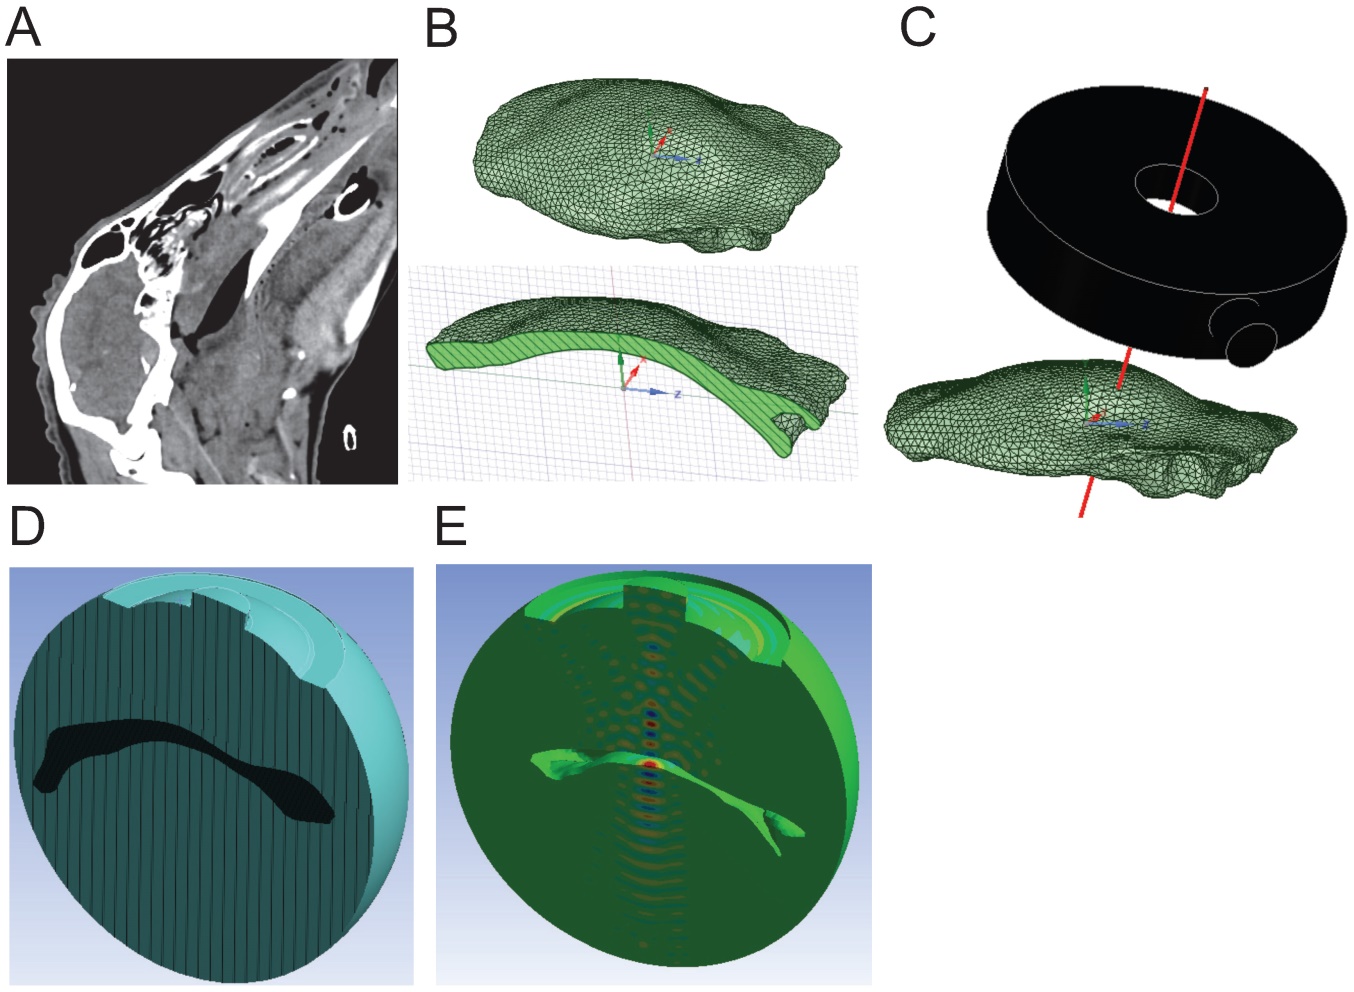
First, Sheep Skulls Were Scanned By Ct (1 Mm
resolution) to create a 3D geometry of the skull cap
Reduce The Geometric Complexity In The Simulation
(Figure 3B). The geometries of both the skull cap and
Domain To Define The Position Of The Transducer
considering the distance and tilting angles relative to the skull cap according to preplanned sonication spots (Figure 3C).
For the simulations, a speed of sound in the skull
Described Method , Variation Of 10%), And A
density of 1,710 kg/m3 were used (variation of 10%) as measured by obtaining weight/volume for 5 skull
Mass
measurement.
Water (Speed Of Sound: 1,500 M/S, Density: 1,000
kg/m3), and the active surface of the transducer.
The 3D Geometry Was Then Subdivided Into A
number of small subdomains (elements), each having
A Defined Shape And Number Of Nodes. The Element
size needed to be fine enough to reasonably resolve
Propagation
models.
Was Monitored. The Maximum Pressure Remained
stable as the mesh size was reduced from 0.87 to 0.65 mm (Table S1). Therefore, at a frequency of 286 kHz,
Water. The Same Strategy Was Applied To The Skull
domain, where the element size was found to be 1.45 mm.
The Excitation Source Was Defined As An Acoustic
normal surface velocity at the surface curvature of the transducer, with a continuous wave propagation and
Surface Causes Acoustic Particles Adjacent To The
surface to move, generating acoustic pressure. For
Purely Acoustic Phenomena, An Acoustic Contact Is
given as the interface between the skull and water.
Note That No Fluid-Solid Interface Was Defined
between the skull and water as we assumed negligible
Boundary Was Applied To The Exterior Faces Of The
water domain (Figure 3E).
Thermometry Was Performed In A Perspex Tank
(260x160x160 mm) on three fixed sheep calvaria. The transducer was fixed on a plate in the bottom of the
Coupling Cone. Coupling Was Done With Degassed
water, filling the tank as little as possible such that the
Allowed For An Even Coupling While Minimizing
possible cooling of the skull sample by the water. The
Transducer Settings Were The Same As Those Used
successfully in sheep 5, 7 and 8 (286 kHz, 1.4 MPa
Peak Negative Pressure, 1 Ms Pulse Duration, 2 Hz
PRF). The temperature rise in the skull was measured using a thermal camera (TrueIR, Keysight), fixed on a
Captured At A Rate Of 1/S, And The Maximum
temperature within a target box was recorded.
Thermocouples (Diameter 600 Μm) And A Thermometer
datalogger (EA15 system using EasyView 15 software,
Extech Instruments, Nashua, Nh). The Thermocouple
was positioned with its stiff wire screwed into the HIFU holder, protruding through the central hole of
The Hifu At The Correct Length To Touch The Skull
surface. The testing apparatus was shielded from air currents with a large cardboard box, and allowed to equilibrate for 30 min between tests.
For The Macroscopic Analysis Of The Extravasation
of Evans blue, the brain was coronally sliced and fixed in neutral-buffered formalin and a true color scan was
Conducted Using A Desktop Photo Scanner (V370
Photo, Epson, Suwa, Japan). Petechiae were counted in brains from six sheep. They were defined as blood spots <3 mm wide with indistinct edges. Those with defined edges, or following the distinct course of a blood vessel (characteristic of incomplete perfusion leaving unflushed blood vessels), were not counted. A 700 nm (far-red) scan of each brain section was done
Using A Fluorescence Scanner (Odyssey Fc, Li-Cor,
Lincoln, NE) for 2 min. Treated areas were delineated on each brain slice, as well as three untreated slices from each brain (slices 1-3 counting rostral to caudal), and the maximum far-red intensity for each area was recorded.
Histological Analysis
Several histological methods were employed.
Were
cryoprotected in 30% sucrose in PBS and sectioned at 50 µm on a freezing microtome.
For Endogenous Igg Labeling, Slices Were
antigen-retrieved in a 3% sodium lauryl sulfate/2.58% sodium citrate solution at 37 °C for 30 min, washed once with water and then 3 times for 5 min in PBS.
Next, Endogenous Peroxidases Were Quenched By
washing in a 3% hydrogen peroxide (in PBS) solution for 15 min. The slices were then washed again (3x 5
Dilution. As A Negative Control, The Antibody Was
omitted. The slices were subsequently washed three
(Proscitech,
Townsville, Australia), and dried.
The Mounted Slices Were Defatted With Multiple
5 min washes of water, ethanol, and xylene (2x tap
Water, 70% Ethanol, 2X 100% Ethanol, 2X Xylene,
reverse back into water), then stained with cresyl violet solution (0.1% cresyl violet acetate in 1 M sodium acetate, 2% glacial acetic acid) and rinsed
Thoroughly. They Were Then Dehydrated And Cleared
(water-xylene, as above), and coverslip mounted with DPX mountant (Thermo Fisher, Sydney, Australia).
Thickness. Sections 35 Μm Apart Were Defatted And
rehydrated, and stained with either hematoxylin and eosin (H&E) or vanadium acid fuchsin (VAF) stain to assess cell damage and red blood cell infiltration.
After staining, slides were cleared and mounted as above.
Extravasation,
fluorescent lectin/IgG co-labeling was performed. Rehydrated sections were antigen retrieved, blocked, and incubated with lectin biotin conjugate (Sigma) at
1:250 Overnight, Washed And Then Incubated With
1:500 dilutions of streptavidin conjugated alexa-555 and anti-sheep IgG-488 ( Life Technologies, Carlsbad, USA) for 2 h. Slides were imaged for fluorescence on a
Microscope
(BioVision Technologies, Exton, USA), in bright field
On An Axioimager Microscope (Zeiss Australia,
Sydney, Australia), and scanned on a slide scanner (Metafer4, Zeiss Australia, Sydney, Australia).
+
+
+
a Sonication spot 5 only; b after a transducer recalibration, 515 instead of 500 kHz was used; c sonication spots 1, 2 and 5; N.A., not available
Our Non-Recovery Protocol Included A Total Of 12
sheep with on average five sonication points each,
Based On The Use Of A Spherically Focused Hifu
transducer (Table 1 and Figure S1). In a pilot study, sheep 1-4 helped to establish the general procedures including anesthesia, sonication protocol plus microbubble administration, brain and skull dissection and the histological analysis.
Sheep 5-8 Were Used To Establish Reproducibility
and efficacy in opening the BBB at the base of the brain. We also performed ex vivo thermometry, used
Ct Scans To Create A 3D Model Of The Skull And
performed simulations of the HIFU and skull in water
(Fea And Uar Analysis), Followed By Measuring The
trans-skull acoustic pressure.
Sheep 9-12 Were Used To Target Areas That Include
the cortex and hippocampus (where plaque pathology
And
optimizations based on data obtained with sheep 5-8.
We Introduced In Vivo Ct Imaging And Were Able To
predict a cortical/hippocampal focus and sufficient pressure to open the BBB in the regions of interest. The simulation suggested the use of a 20 mm coupling
Cone, Which Allowed Us To Achieve Targeted Bbb
opening in sheep.
The First Two Cohorts Included Eight Sheep In
total with an average of five sonication points each (Table 1), either placing the transducer directly on the
Skull, Aimed At Targeting Deep, Basal Brain Areas
(Figure 2A), or with a 43 mm coupling cone, aimed at
Targeting A More Shallow Focus Close To The Skull
(Figure 2B). The sonication spots were chosen without
Coordinates; Rather, We Selected Easily Palpable
anatomical features on the skull, which were able to
Stably And Repeatedly Accommodate The Transducer
assembly (Figure 2C).
Gaining
consistent Evans blue staining in the brain (Table 1).
Microbubble
concentration in the circulation due to slow infusion.
Custom-Made To Definity Microbubbles From Sheep 3
onwards. However, again we failed to achieve overt
Bbb Opening As Visualized By The Absence Of Evans
blue extravasation. We then increased the voltage to
The Maximum Output Of The Amplifier To Ensure
sufficient pressure. This still proved unsuccessful at producing an Evans blue signal in the brain, but as sheep 4 displayed some subdural hemorrhages at the site of sonication, it was apparent that sufficient ultrasound energy had reached the brain, but that the
Dye Was Not Extravasated. As The Next Step, We
changed the transducer to one with a lower 286 kHz frequency to obtain better skull penetration. Further, rather than having a 10 min delay between sonication
2589
and Evans blue administration, we administered the dye immediately after the last sonication.
Successful Evans Blue Uptake Was Consistently
achieved for sonication location #5 (at the base of the brain) in sheep 5-8, using a bolus injection of Definity microbubbles, 286 kHz bursts of 1 ms duration, a 1.4
Mpa Peak Negative Pressure, And A Prf Of 2Hz, And
either a 10 ms (sheep 6) or a 1 ms (sheep 5, 7 and 8) pulse duration. This was evident when a full anterior
Visualized In Natural Color (Figure 4A-B), And In
fluorescence images of the same slices, with Evans
Blue Fluorescence Intensity Indicated In Heat-Map
coloration (Figure 4C-D). A minimum of 5 min delay was allowed between sonications to allow for clearing of most of the microbubbles from the circulation. To visualize BBB opening with an alternative method, we stained sections with cresyl violet and anti-sheep IgG, revealing pronounced IgG uptake for sonication point #5 that matched the Evans blue pattern (Figure 4E-F).
Figure 2. Sheep sonication procedure. (A) Application of a transducer directly to the sheep head without a coupling cone to provide a focus at the base of the brain. (B) Transducer application to the sheep head using a coupling cone to provide a cortical/hippocampal focus. (C) Example sonication positions. 1: with the transducer being applied directly to the head; 2-5: using a coupling cone for the transducer. (D) Illustration of the skull dissection. The blue line indicates the surgical saw cuts around the calvarium. (E) After the calvarium was removed intact for ex vivo testing, the brain was exposed and ready to be removed. (F) Illustration of the brain in a cutting block, having been sliced but not separated.
2590
Figure 3. Simulation process from CT scan to ANSYS FEA. (A) CT scan of the sheep skull used to create the 3D model of the skull cap. (B) Full 3D geometry of the skull cap imported into ANSYS shown from above (top) and in cross-section (bottom). (C) The HIFU (black model) was precisely positioned such that the axis of the central hole (red line) was aligned with at the sonication spot on the skull cap. (D) Two main domains of water (blue) and skull cap (black) were created. Note that only half of the computational domain is shown. (E) 3D pressure contour (FEA result) in the water domain. Note that the skull cap domain has been removed for better visualization.
Together, The Bbb At The Base Of The Brain Was
successfully opened (applying the transducer directly to the head), whereas in shallow areas (using a 43 mm cone) it was not. We next aimed to achieve targeting
Would Nee A Smaller Coupling Cone Than Used For
shallow targeting.
We Next Performed A 3D Simulation Of The
acoustic field of the 286 kHz HIFU in water in the
Absence Of A Skull Using Fea Shown As A 2D
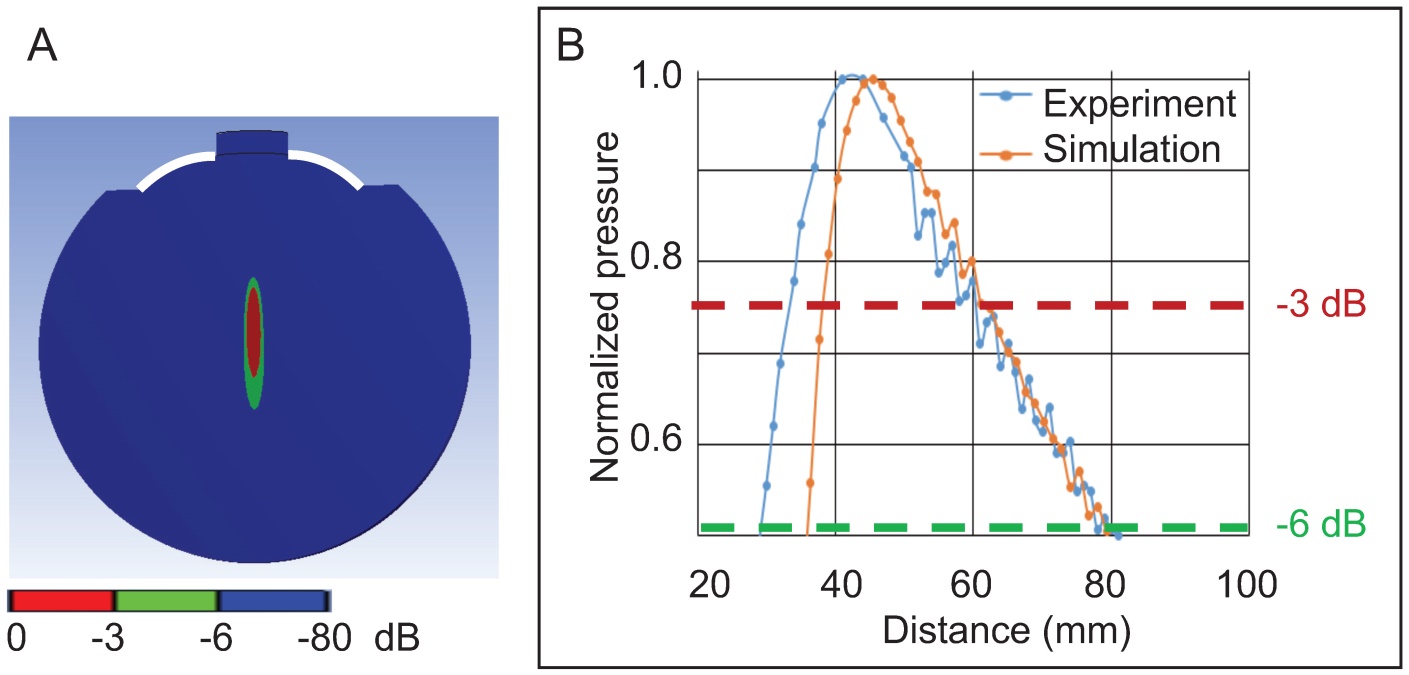
representation (Figure 5A), followed by validating the pressure distribution in an AIMS III tank filled with water, again in the absence of a skull (Figure 5B). For both the simulation and the experiment, the focal zone
(Maximum Pressure) Was 43 Mm Distant From The
outer edge of the transducer. When the signal decay at -3 dB (about 0.75 of the maximal normalized pressure)
Simulated And The Measured Data Was That, For The
latter, the focal zone was shifted 4 mm towards the
Unexpected Considering That The Hifu Transducer
(active diameter: 64 mm, radius of curvature: 59.97
Mm, F-Number = 0.93) Deviated From The Provided
specifications (diameter: 64 mm, radius of curvature: 64 mm, nominal f-number =1.0) (see also: ).
Next, 3D Simulations Were Performed Of The
sheep skull cap in water (with water as a reference)
Plane Inside The Cap (Figure 6B). The Simulations
were again validated in the AIMS III tank, positioning
Simulation (Figure 6C), And The Pressure Map Was
obtained at this plane. For both the simulation and experimental validation, the absolute pressure value
Was Normalized For The Maximum Pressure In Water
in the absence of the skull cap. For both sonication
Simulation. This Validated The Fea, Which We Then
used to optimize the positioning of the HIFU and the targeting of the focus to reduce transmission loss.
2591
Figure 4. Obicodilation of areas at the base of the brain visualized with Evans blue. (A) Full series of coronally sliced brain sections (sheep 5), scanned in natural color. Evans blue uptake is seen as a blue mark in slice 8. (B) Close-up view of slice 8. (C) LI-COR fluorescence images taken of the same slices at 700 nm, demonstrating the presence of Evans blue by heat-map coloration. (D) LI-COR fluorescence close-up view of slice 8. (E-F) To visualize BBB opening with an alternative method, sections were stained with cresyl violet and anti-sheep IgG, revealing pronounced IgG uptake ((F) is inset from (E)). Scale bars: 10 mm.
2592
Figure 5. Validation of a 3D simulation of the 286 kHz HIFU acoustic field in water in the absence of a skull. (A) A 2D representation of the focus of the HIFU in water (showing the active surface of the HIFU in white). (B) Graph showing the normalized pressure profile in the experiment compared to the simulation as a function of the distance from the edge of the HIFU.
Two Sonication Spots 20 Mm Apart (To Ensure
that the spots were not overlapping) were modeled in the simulations in which the cone height (distance between the active surface of the HIFU and the skin
Surface) Was Changed From 0 Mm To 40 Mm In 10 Mm
increments. We determined that the thickness of the scalp varied between 4 mm and 5 mm, and added this distance to the simulation (Figure 7A), modeling its acoustic properties as water . In the absence of a cone, the -6 dB contour was 35x6 mm at the base of the brain, and the skull base (Figure 7B). With a 10 mm cone, the -6 dB contour was reduced to 30x6 mm and the focus was repositioned axially towards the face of the transducer, overlapping the base of the brain and the hippocampus (Figure 7C). With a cone height of 20 mm, cortical and hippocampal areas were targeted within the -6 dB pressure contour of size 35x6 mm and this positioning yielded the highest focal maximal pressure of 0.7 (normalized pressure) estimating 30% attenuation caused by the sheep skull cap (Figure 7D).
By Increasing The Cone Height To 30 Mm And 40 Mm,
the focus moved towards the face of the transducer
And Energy Was Deposited On The Calvarium And
outside the skull where the majority of the wave’s energy was reflected by the skull cap surface (Figure 7
When Establishing A Pressure Profile At A -6 Db
pressure contour for both sonication spots (Figure 7G), the targeting area was also confirmed for spot 2, with a slightly higher pressure. One should note that for a given cone height, for the two sonication spots examined, the HIFU targeted the brain at a similar depth (with a displacement of ± 2 mm) and creating a similar focal size (variation of 4 mm) (Figure 7H). We
Thus Determined That The 20 Mm Cone Was Most
suitable as it targeted the cortex and hippocampus,
Pressure Contour Of The Focus Would Provide The
required pressure for opening BBB (sheep 9-12).
To Estimate How Much Acoustic Energy Reaches
the brain at the focal point in cortical areas (using a 20 mm cone), we tested ex vivo skulls from three sheep in
Derived Analysis, Uar. Uars In The Presence Or
absence of a sheep skull were computed at the focal point. The UAR data in the absence (water only) and
Hippocampal Focus (Figure 8C). We Always Compared
two adjacent peaks (with the blue line corresponding to the water condition and the red line to the skull
Delay (Figure 8D). The Uar Peak Time Comparison
revealed that the presence of the sheep skull reduced
The Delay Of Sound Compared To Water (Because The
speed of sound in the sheep skull is higher than that of water). The reduction in the delays varied between 1.16 µs and 1.31 µs (sheep 12), 0.8 µs and 1.24 µs (sheep 11), and 1.18 µs and 1.16 µs (sheep 10) for the focal point. We also found that the amplitude ratio of
The Uar Peaks Varied Between 30% And 50% For
sheep 12, 32% and 60% for sheep 11, and 31% and 54% for sheep 10. This shows that the attenuation caused by the sheep skull cap is around 40%, 47%, and 40% on average, respectively.
Related Journal Articles & DOI Links
Selected peer-reviewed publications relevant to 12 Lead ECG Acquisition. Click the DOI to access the full paper (may require institutional access).
-
1. Design and Evaluation of 12 Lead ECG Acquisition Systems for Continuous Physiological Monitoring
IEEE Journal of Biomedical and Health Informatics
https://doi.org/10.1109/JBHI.2020.2981234 -
2. Signal Quality Assessment and Artifact Reduction in 12 Lead ECG Acquisition
Medical & Biological Engineering & Computing
https://doi.org/10.1007/s11517-020-02145-6 -
3. Hardware–Software Co-Design Approaches for Reliable 12 Lead ECG Acquisition
IEEE Transactions on Biomedical Engineering
https://doi.org/10.1109/TBME.2019.2895762 -
4. Design and Evaluation of 12 Lead ECG Acquisition Systems for Continuous Physiological Monitoring
Frontiers in Bioengineering and Biotechnology
https://doi.org/10.3389/fbioe.2020.00123 -
5. Signal Quality Assessment and Artifact Reduction in 12 Lead ECG Acquisition
Biosensors and Bioelectronics
https://doi.org/10.1016/j.bios.2021.112345 -
6. Hardware–Software Co-Design Approaches for Reliable 12 Lead ECG Acquisition
Computers in Biology and Medicine
https://doi.org/10.1016/j.compbiomed.2021.104567 -
7. Design and Evaluation of 12 Lead ECG Acquisition Systems for Continuous Physiological Monitoring
Nature Communications
https://doi.org/10.1038/s41467-020-12345-6
Why Choose Us?
Bangalore guidance for robotics, Spectre and autonomous systems projects.
Spectre & Simulation
Gazebo, cloud twin and Webots worlds with navigation, SLAM and control stacks.
Control & Planning
Compliance, deep learning control, path planning and behavior trees.
Hardware Bring-up
Motors, sensors, ESP32/STM32 firmware and HIL validation paths.
Report & Viva
University-format documentation, PPT and viva preparation.
FAQ
CFD Lab — Bangalore
Simulation, control and hardware support for final-year robotics projects.
Stacks
Worlds
Digital Twin
Control
Robots
Offline
Bring-up