“This Whole Thing Smacks of Gender”: Algorithmic Exclusion in
Abstract
Smart weight scales offer bioimpedance-based body composition analysis as a supplement to pure body weight measurement. Com- panies such as Withings and Fitbit tout composition analysis as providing self-knowledge and the ability to make more informed de- cisions. However, these aspirational statements elide the reality that these numbers are a product of proprietary regression equations that require a binary sex/gender as their input. Our paper combines transgender studies-influenced personal narrative with an analysis of the scientific basis of bioimpedance technology used as part of the Withings smart scale. Attempting to include nonbinary people reveals that bioelectrical impedance analysis has always rested on physiologically shaky ground. White nonbinary people are merely the tip of the iceberg of those who may find that their smart scale is not so intelligent when it comes to their bodies. Using body com- position analysis as an example, we explore how the problem of trans and nonbinary inclusion in personal health tech goes beyond the issues of adding a third “gender” box or slapping a rainbow flag on the packaging. We also provide recommendations as to how to approach creating more inclusive technologies even while still relying on exclusionary data.
Ccs Concepts
• Human-centered computing →Ubiquitous and mobile com- puting; • Social and professional topics →Gender; Race and ethnicity; People with disabilities; Geographic characteristics; Cul- tural characteristics; Remote medicine; • Applied computing → Consumer health.
Keywords
data collection and curation, sex/gender, bioelectrical impedance analysis, body composition, critical data/algorithm studies, science and technology studies, critical HCI and the design of algorithmic
Acm Reference Format:
Gender”: Algorithmic Exclusion in Bioimpedance-based Body Composition Analysis. In Conference on Fairness, Accountability, and Transparency (FAccT ∗Both authors contributed equally to this research.
Permission to make digital or hard copies of part or all of this work for personal or classroom use is granted without fee provided that copies are not made or distributed for profit or commercial advantage and that copies bear this notice and the full citation on the first page. Copyrights for third-party components of this work must be honored.
For all other uses, contact the owner/author(s). FAccT ’21, March 3–10, 2021, Virtual Event, Canada © 2021 Copyright held by the owner/author(s).
Https://Doi.Org/10.1145/3442188.3445898
’21), March 3–10, 2021, Virtual Event, Canada. ACM, New York, NY, USA,
Introduction
Kendra: As a nonbinary person who was assigned female at birth, I’ve always had an uncomfortable relationship with my body weight. To be honest, before I stepped on the Withings scale, I hadn’t weighed myself in some time. But after undergoing some medical transition steps, I found myself much more curious about what my body fat percentage was. Especially since I have put on a fair amount of muscle, I was interested to see how the numbers matched or didn’t match my self perception.
Because of this discomfort with weight numbers, I asked Maggie to make a profile for me when I was getting started with the scale. She started going through the registration flow for a new user, and quickly encountered a roadblock - the system required a gender.
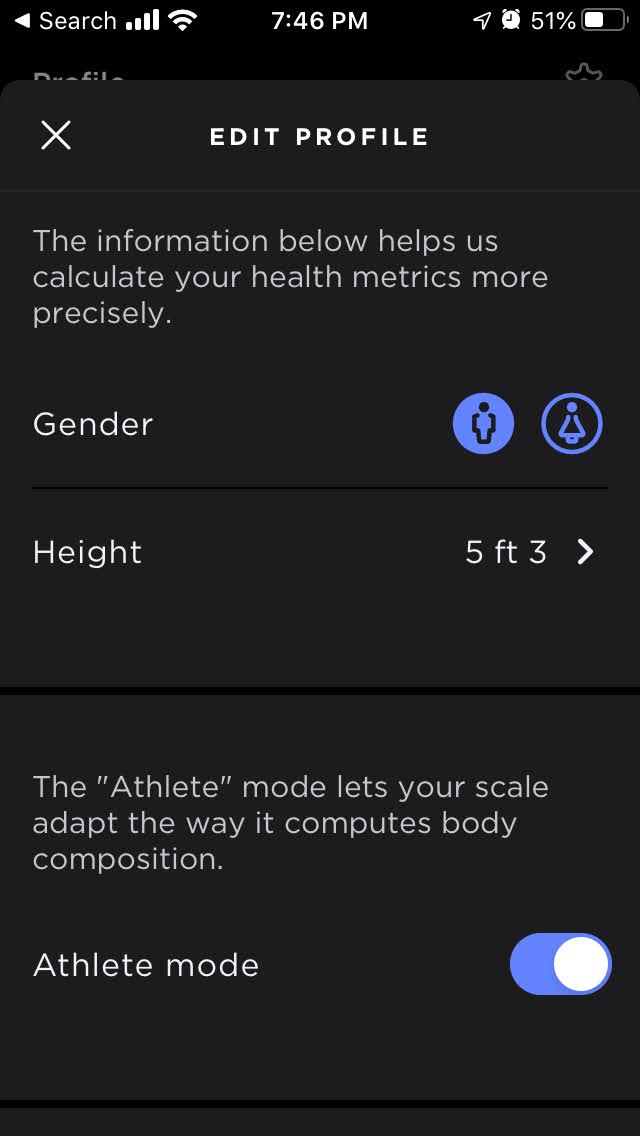
Wait, that’s not right. It didn’t require a gender, it required you to pick one of two images labeled gender - a person wearing pants or a person wearing a skirt (see Figure 1). When Maggie asked me which one I preferred, I told her to pick one and not tell me.
When I did finally step on the scale (with my shiny new profile), I looked at the numbers and felt...well, some sort of way. To be honest, I’m happier with my body now than I remember ever being before, but the numbers seemed very off.
The next morning, we were talking about the scale at breakfast, and that was when Maggie first told me that the fat percentage was an estimation based on a technique called bioelectrical impedance analysis (BIA). There was an equation behind that number - it didn’t actually measure my body fat percentage directly. I was shocked, and asked how that related to my gender. We decided to do some testing.
When Maggie changed my “gender” from skirt-wearing to pants- wearing, my body fat percentage dropped 10% points. 10! The huge difference seemed to confirm everything I’d thought about the numbers feeling wonky. But which one was right? Or failing that, which one closer? Could we look at how the algorithm calculated the percentage in order to see which one was likely to be more accurate for me? Maggie: Kendra’s reaction to the scale was an interesting expe- rience because I realized that the knowledge I had about how BIA worked was non-obvious to anyone not familiar with the tech. I had already been thinking about how sex is often coded in the underlying BIA equations as 1 or 0 because I had given a guest lecture about it recently, but I hadn’t fully thought through the implications for trans and nonbinary people.
Seeing the numbers on the scale jump by so much was jarring. We talked a lot about how to interpret the results and what the exact percentages really mean. There is a little progress bar on the scale that indicated that the numbers (regardless of gender) were above
Arxiv:2101.08325V3 [Cs.Cy] 25 Jan 2021
FAccT ’21, March 3–10, 2021, Virtual Event, Canada
Kendra Albert And Maggie Delano
Figure 1: The Withings profile view in their Health Mate mo- bile application. the “normal range.” But that normal range itself appears to be a “normal range” for an athlete because we were both well above that line. In terms of making the scale work for Kendra, the answer I was proposing was to pick skirt-wearing or pants-wearing and then track that number over time.
Kendra’s interest in using the Withings smart scale, and figuring out what “gender option” was right drove us to reexamine how BIA works as a technology, and how assumptions about gender and sex are built into the fundamental equations that drive the algorithmic models used for estimating body fat percentage.
This paper, the result of that analysis, combines transgender studies-influenced personal narratives with an analysis of the sci- entific basis behind the bioimpedance technology used as part of the Withings smart scale. With these different forms of knowledge, we explore how the problem of trans and nonbinary inclusion in personal health tech goes beyond adding a third “gender” option or slapping a rainbow flag on some packaging. Rather, nonbinary exclusion is the tip of an iceberg of flawed assumptions and exclu- sionary clinical testing, resulting in algorithms that are advertised for self-knowledge but prove to allow anything but.
Background
This paper draws on previous work related to self-tracking, trans- gender studies, human-computer interaction, and the study of sex and gender in biomedical research. In this section, we provide a brief summary of related work in these disciplines to situate our findings.
While the Withings weight scale is not the first commercially available scale to estimate body fat percentage, the device was one of the original “smart” (i.e. connected) weight scales . The device was first sold in the early 2010s at the beginning of a surge of interest in self-tracking and the advent of the “quantified self” movement [47, 55, 57]. The quantified self movement included a variety of stakeholders including individual self-trackers, organizations such as Quantified Self, companies and toolmakers, academic researchers, and physicians (with considerable overlap between these categories) . Participants are broadly interested in the capabilities of self- tracking to provide unique, actionable, and personalized insights [50, 82]. Self-trackers engage deeply with their data through a process sociologist Deborah Lupton refers to as “data sense-making” . Many self-trackers believe that data can “speak for itself” and should be involved in medical care [27, 59]. However, the use of data collected from commercial “wellness” devices such as the Withings scale or activity trackers like Fitbits is controversial as these devices don’t always perform well in third-party validations, and often involve proprietary algorithms and metrics (e.g. steps, sleep scores).
Previous research investigating self-tracking devices and wear- able monitors has shown that these devices, like devices in other categories, are designed primarily for an unmarked user [12, 15].
That is, the user is assumed to be a White, cisgender, non-disabled man. Cifor and Garcia, for example, use duoethnography to eval- uate gendered assumptions in the design and app of the Jawbone UP3 fitness tracker. They illustrate that while the device itself ap- peared “genderless,” the design of the device and the app reinforced masculinist values such as competition . Such issues are also present in the design of algorithms - for example, Fitbit devices count steps less reliably at slower gait speeds and with softer steps, which decreases step count accuracy for older people or people with mobility related disabilities [24, 37]. Early implementations of the hardware and algorithms used to estimate heart rate on wear- ables were less accurate for users with darker skin tones [31, 69], though recent evidence suggests these disparities may have been addressed by improvements to the device’s algorithms .
The development of algorithms without a diverse set of users creates algorithmic exclusion. Populations are excluded from the use of algorithmic tools because they were not included as part of the original data used in development, or because information was not gathered in such a way as to make their needs visible.
This algorithmic exclusion means that the performance of these algorithms for individuals not in the original dataset are unknown; the practical implication is that these algorithms likely work less well for those not included in the original dataset. Algorithmic “This Whole Thing Smacks of Gender”: Algorithmic Exclusion in Bioimpedance-based Body Composition Analysis FAccT ’21, March 3–10, 2021, Virtual Event, Canada exclusion can have real world impacts as individuals rely more and more on these data, especially when these data are used by physicians. For example, pulse oximeter devices that measure blood oxygenation (using a more involved technique similar to that used by wearables manufacturers for measuring heart rate) overestimate blood oxygenation in individuals with darker skin tones [7, 25].
Renewed interest in these disparities during the COVID-19 epidemic led to a study that showed that Black patients had nearly three times the frequency of occult hypoxemia (oxygen depravation) that was not detected by pulse oximetry than White patients [52, 71], potentially leading to higher mortality rates for Black patients when the seriousness of their COVID-19 cases were underestimated.
These issues have not escaped notice within communities that build technological tools. There has been increasing discussion in different design communities about how to create technology that is more inclusive and/or addresses some of the disparities discussed above. In human-computer interaction (HCI) and artificial intelli- gence (AI) research, for example, there have been efforts including analytical reviews, software analysis of datasets, and guidelines about increasing “gender sensitivity” [11, 33, 39, 63, 64] and more intersectional approaches to addressing disparities, such as the in- tersection of gender and race [10, 62]. There have been multiple guides and recommendations for including transgender people in user interface design [11, 53] and in surveys . These recom- mendations include allowing all individuals to self-identify their gender, not assuming binary gender, using the language users use, and protecting the privacy of participants. In the case of dealing with medical research and “embodiment,” the guidelines recom- mend measuring physiological parameters such as hormone levels directly, rather than assuming them based on gender.
However, embodiment is a tricky line to draw. When one consid- ers the terms “sex” and “gender,” the common assumption is that sex is biological and gender is social. If there is any relationship between the two, it is assumed that sex influences gender, and trans- gender and intersex people are seen as outliers whose needs vary from “normal” populations. However, Springer et al. argue that it is sex that cannot be purely decoupled from social factors (i.e. gender) . A “biosocial turn” is now beginning in the study of sex and gender . Many mechanisms that were previously thought to be due to biological “sex” differences, are in fact mechanisms that involve differences based on socialization that manifest in biological differences. Springer et al. recommend using “gender” to refer to social relations and gender roles and the term “sex/gender” to refer to those biological and biosocial factors associated with individual physiology. In this paper, we will use the terms sex/gender and gender, unless we are referring to how these terms are used in a specific work.
Approach
Our work draws heavily from transgender studies as an approach, while having some similarity to Black feminist methods, specifically Jennifer Nash’s love politics in the form of witnessing . We include conversations between the two of us throughout throughout the paper. Personal narrative, especially dialogue, can help uncover “common pain points and overlooked opportunities” . Where duoethnography, used by previous studies, is a research method that employs personal narrative to “simultaneously generate, interpret, and articulate data” about a shared experience , we include personal narratives throughout this paper to combine, in the words of Susan Stryker, “the embodied experience of the speaking subject” (i.e. our experiences using the weight scale) with “the specialized domain of scholarship”, (i.e. the specifics of the theory and practice of BIA for at home body composition monitoring) [72, 77]. Personal narrative allows for a starting point to a broader conversation about smart weight scales and the implications the system and algorithm design have for technology and biomedical research more broadly.
We are approaching this topic as a White nonbinary person (Kendra), and as a White cisgender woman (Maggie). Neither of us are disabled in ways that are likely to affect our readings from or interactions with the Withings scale. Both of us have considerable background in technology and gender. Kendra is a lawyer teaching at a technology clinic who also teaches in transgender studies. They have, at times, engaged in self-tracking, although not previously around weight. Maggie is an assistant professor at a small liberal arts school where she teaches digital/embedded systems and inclusive engineering design. Her research involves using bioimpedance to help patients manage fluid overload. She is also a self-tracker and has presented her work at several Quantified Self conferences.
Bioelectrical Impedance Analysis
Critical analysis of the sort that we deploy in this paper requires the knowledge of how the measurement technology inside smart weight scales works. In this section, we present a background on Bioelectrical Impedance Analysis (BIA). We should note, however, that because the specific testing and equations used by the With- ings scale are not publicly available, this background will leverage knowledge from public and peer-reviewed sources and may or may not reflect the specific approaches that the Withings or other consumer-facing scales employ.
At the most basic level, the body can be divided into two main “compartments:” fat mass (FM) and fat free mass (FFM) [40, 43, 46]. FM includes all the fat in the human body, including what we think of as body fat and also visceral fat around vital organs. FFM is the rest of the tissue; it is about 73% water, about 7% bone, and the rest is proteins.
BIA leverages the fact that the water in FFM is conductive; by driving a small, painless current through the body via a pair of electrodes (in weight scales these are two of the electrodes on the scale), the resulting voltage can be measured by another pair of electrodes (also on the scale) and related to the electrical properties of the underlying tissue.
If one assumes the body is a homogeneous cylinder with cross- sectional area A, the measured resistance 𝑅(defined as the real part of the measured voltage divided by the current) is equal to:
(1)
where 𝜌is the conductivity of the cylinder, 𝐿is the length of the cylinder, and 𝐴is the cross-sectional area of the cylinder. Most BIA equations assume that 𝐿is proportional to the body height 𝐻.
Multiplying both sides of the equation by 𝐿/𝐿, the resistance can FAccT ’21, March 3–10, 2021, Virtual Event, Canada
Kendra Albert And Maggie Delano
be related to the inverse of the volume, assuming that 𝑉= 𝐿× 𝐴:
(2)
If one moves the volume to the other side, there is then:
(3)
This volume 𝑉corresponds to what is called the “total body water” or the volume of all water in the body, which is assumed to be about 73% of the volume of the FFM. If one multiplies this volume by the presumed density of the FFM to obtain the FFM, the FM and body fat percentage (BF%) can then be calculated as:
Assumptions Of Bia
The methods described above require a number of assumptions related to the body. In order for these assumptions to be valid, the resistivity 𝜌of the measured volume must be homogeneous, and the cross-sectional area must be constant throughout the body such that 𝑉= 𝐿× 𝐴. The assumption that the FFM is 73% water must also hold, along with the assumed density of the FFM. Finally, it must be assumed that the current penetrates through the whole body in a uniform manner such that the estimated volume is truly reflective of the total body water, and not just a fraction of it.
Of course, these assumptions are not realistic; the body is not a single homogeneous cylinder with precisely known body com- position. Instead, BIA leverages different variables that correlate with “gold standard” estimations of the FFM to estimate the FFM based on the BIA itself. An example BIA equation for estimating
Ffm Might Look Like The Following: :
𝐹𝐹𝑀= −4.104+(0.518 × 𝐻2/𝑅)+(0.231 × 𝑤𝑒𝑖𝑔ℎ𝑡)+(0.130 × 𝑋)
(6)
This equation involves a number of key terms: the 𝐻2/𝑅term, the weight term, the 𝑋term (reactance or imaginary part of measured bioimpedance), and sex. Each of these terms is associated with a coefficient in front (along with a constant at the beginning of the equation) that are calculated based on the best fit of the regression equation that minimizes the error between the estimation via BIA and the estimation via the gold standard for the population under test (in this case, the gold standard used was a technology called dual x-ray absorptiometry or DXA).
Precisely which parameters are included in the regression equa- tions and their corresponding coefficients depends on the popu- lation used to calculate the equations and researcher preference.
Other researchers also include factors such as the age of the partic- ipants and whether or not participants are athletes . In some cases these parameters are all incorporated into a single equation (such as the one above that has “options” for participant sex), or mul- tiple equations are generated, such as one for “lean” participants, one for “average” participants, and one for “obese” participants .
Parameters included in FFM estimation equations often do a lot of “work” and their role is not always clearly understood. These parameters and their coefficients “stand in” for things such as body density, which can vary depending on both factors included in the equations and those typically excluded from the equations such as ethnicity. For example, age is sometimes included as a parameter because there tends to be a decrease in FFM and an increase in FM with age, and sex is included because males on average have lower FM than females. We unpack these assumptions and coefficient parameters in more depth in Section 6.
How Bia Is Marketed
Kendra: Of course, I didn’t know how BIA worked before using the scale. Nor would looking at the Withings website have revealed any of the fraughtness of BIA to me - when I look at their ads now, they call the technology “body composition.” It’s not obvious from their advertising that it’s estimating body fat percentage based on a set of assumptions and an algorithm, rather than providing an individual- level ground truth. If you don’t know how the technology works, it’s actually quite easy to draw the conclusion that the scale just magically knows your actual body fat percentage.
Even if I review the “technical specifications,” the information con- tained requires quite a bit of context to determine that what is produced isn’t an individualized number. The bullet points say “Bioelectrical Impedance Analysis / Athlete and non-athlete mode / Unit: body fat %, total body water %, muscle mass kg or lb, bone mass kg or lb.” There’s nothing there that tells me, as an end-user without a lot of expertise in BIA, that it’s engaged in an estimation based on plugging particular values into an equation.
That brings me to the question, Maggie, what were you thinking when you bought the Withings scale? How did the body composition
Stuff Play Into It?
Maggie: I’ve had the scale for a long time - since 2012. That was also the time when the number of people talking about self-tracking was growing, and organizations such as Quantified Self were facilitat- ing some of the first meetups and conferences in this area. Quantified Self emphasized self-knowledge through numbers, often using the frame “self-research” or “personal science” . Over the next few years, the idea of self-tracking would become very hyped, and an entire commercial ecosystem Whitney Erin Boesel dubs “quantified self” (i.e. little q, little s, vs big Q, big S) was formed . Looking back at my data, my first weigh in was March 23rd, 2012. I wanted to learn more about the tech that was out there and see what I could do to make sense of things, and was also inspired by a Quantified Self “Show & Tell” talk by Amelia Greenhall about how she weighed herself everyday and sustained her weight loss long term . I was excited about the possibility of self-tracking and consistent habits improving my fitness and my life. I wanted to learn more and then translate that knowledge to help others.
Kendra: This idea of self-knowledge is really exciting. That’s what I was hoping for when I stepped on the scale as well - some numbers to help me quantify what I was feeling about my body. But of course, that’s not what I got. As a White nonbinary person, what I learned is that this tech isn’t build for me - in part because of the choices that technology companies make, and in part because of the failure to meaningfully account for transgender experience as part of the “This Whole Thing Smacks of Gender”: Algorithmic Exclusion in Bioimpedance-based Body Composition Analysis FAccT ’21, March 3–10, 2021, Virtual Event, Canada underlying clinical testing. And it’s worse for non-White nonbinary or intersex folks, who are both not represented in the studies in terms of sex/gender or race/ethnicity. So much for smart scales.
Critiques Of Bia
Many limitations of BIA have been well established in the medical literature , though some researchers argue that the techniques are still appropriate to use under the correct circumstances .
Researchers suggest caution when using BIA, especially when work- ing with populations that have altered body composition, such as patients with fluid overload. In these cases, some researchers have developed equations specifically for a particular patient population, or have used alternative methods of body composition assessment that don’t rely on regressions (see e.g. ).
A major challenge with body composition using BIA is that the two compartment model of “fat mass” (FM) vs “fat free mass” (FFM) inherently requires assumptions about the composition of the two different compartments (in addition to other assumptions such as homogeneous composition as discussed previously in Section 4.1). Uniformity of the FM is a fairly reasonable assumption across individuals , but assumptions about the composition of the FFM are not . Additionally, when using the regression equations, the assumptions about the composition of the FFM are obscured into the coefficients associated with the included variables such as age, weight, and sex.
Because the linear regressions are optimized at a population level and most studies do not examine the accuracy of the estima- tions at an individual level, there is no guarantee that a specific equation is accurate for any given individual. Additionally, once one begins to consider any individual that is not perfectly matched for the population that was used to create the equations, the role of these variables becomes increasingly murky but also increasingly important in order to design equations that work for populations historically not included in the populations used to generate the equations. This includes non-White people, trans and nonbinary people, intersex people, people with chronic illnesses, and those at the intersections of these categories.
Unpacking “Sex”
We begin with the assumptions and role of “sex” in the equations.1 Sex in BIA is either coded as 0 for female and 1 for male (effectively changing the offset of the equations, as in Equation 6) or there are separate equations created for male participants and female participants, as in Sun et al. . What the literature means by “male” or “female” is unclear, and these terms are often confounded with gender identities of “man” and “woman” as in Equation 6. As we discussed in Section 2, “sex” as a concept is just as fraught and contingent as gender [18, 23, 75]. This is not a problem unique to (or caused by) the existence of trans (or intersex) people.
Although the methods by which “sex” was evaluated in the BIA literature is unclear, it is common for reported sex to be a partici- pant’s sex assigned at birth. And “sex assigned at birth” is generally only a proxy for someone’s external genitalia at birth, which is only one of the many characteristics that are often encompassed under 1We use the term “sex” here given that this is the term used by the researchers. However, sex and gender are entangled as described in Section 2.
the word sex [18, 23]. Others include hormone balance, chromoso- mal makeup, and internal reproductive organs. We could not find an example of a study that produces BIA estimates that discusses what sexual characteristics they round up to a determination of sex, and it is generally not clear how the identification of sex was made (i.e. whether self-identified or identified by the researchers). This lack of specificity is one of the first and most significant barriers to creating a more inclusive algorithm for transgender people. Given how large the sample sizes were for some of the populations used to create BIA equations (upwards of 5,000 in ), it is statistically unlikely that no transgender people were involved. But we don’t know how they were accounted for or counted in the calculations.
The use of “sex” itself is also a “stand in” for other parameters. What the researchers presumably intend is for “sex” to stand in for the roughly dimorphic variation in body composition between those assigned male at birth and those assigned female at birth .
However, it is not the fact that a person is assigned male at birth (i.e., they have genital erectile tissue of a certain size) that makes those assigned male at birth have lower FM on average compared with those assigned female at birth. In fact, FM and the distribution of fat may actually be biosocial phenomena: they may depend on both sex AND gender (sex/gender). For example, one effect of larger quantities of testosterone is changes in fat distribution and increases in muscle production, resulting in lower body fat percentages .
However, most research into sex differences in body composition do not explore other explanations, such as the differences in diet between men and women in some cultural contexts [36, 61]. The BIA literature also does not disaggregate sociocultural context that might be caught up in the word “sex”, nor account for the myriad ways in which someone assigned male at birth might not match the presumed physiological composition associated with those assigned male at birth on average.
With only two sex or gender options, some intersex and most nonbinary users experience what D.E. Wittkower has termed a dysaffordance – they have to pretend to be something they are not in order to access the service [15, 81]. The lack of transparency in the BIA equations makes it difficult to tell exactly what adjustments might need to be made to make equations more inclusive, or to at the least advise individuals as to which “sex” they should choose when using consumer technologies that incorporate BIA. On the other hand, the current setup of the Withings scale that asks for user gender may actually produce more accurate results for trans women and trans men who have undergone gender-affirming hor- mone therapy, as their body composition may resemble that of a cis woman or cis man, rather than their sex assigned at birth [41, 73].
Other Issues With Published Studies
White nonbinary or intersex people, despite experiencing a dysaf- fordance, may be better off than their siblings of color because the composition of the study populations used in BIA equations in the Withings scale are unclear, and there is no way to enter racial or ethnic information.2 The majority of measurement studies in- volving BIA include primarily Caucasian subjects and assume that 2We use both the terms race and ethnicity because the literature is mixed on which are relevant factors, likely because of the entanglement of biological and social factors similar to sex/gender as discussed in Sections 2 and 6.
Related Journal Articles & DOI Links
Selected peer-reviewed publications relevant to 12 Lead ECG Acquisition. Click the DOI to access the full paper (may require institutional access).
-
1. Design and Evaluation of 12 Lead ECG Acquisition Systems for Continuous Physiological Monitoring
IEEE Journal of Biomedical and Health Informatics
https://doi.org/10.1109/JBHI.2020.2981234 -
2. Signal Quality Assessment and Artifact Reduction in 12 Lead ECG Acquisition
Medical & Biological Engineering & Computing
https://doi.org/10.1007/s11517-020-02145-6 -
3. Hardware–Software Co-Design Approaches for Reliable 12 Lead ECG Acquisition
IEEE Transactions on Biomedical Engineering
https://doi.org/10.1109/TBME.2019.2895762 -
4. Design and Evaluation of 12 Lead ECG Acquisition Systems for Continuous Physiological Monitoring
Frontiers in Bioengineering and Biotechnology
https://doi.org/10.3389/fbioe.2020.00123 -
5. Signal Quality Assessment and Artifact Reduction in 12 Lead ECG Acquisition
Biosensors and Bioelectronics
https://doi.org/10.1016/j.bios.2021.112345 -
6. Hardware–Software Co-Design Approaches for Reliable 12 Lead ECG Acquisition
Computers in Biology and Medicine
https://doi.org/10.1016/j.compbiomed.2021.104567 -
7. Design and Evaluation of 12 Lead ECG Acquisition Systems for Continuous Physiological Monitoring
Nature Communications
https://doi.org/10.1038/s41467-020-12345-6
Why Choose Us?
Bangalore guidance for robotics, Spectre and autonomous systems projects.
Spectre & Simulation
Gazebo, cloud twin and Webots worlds with navigation, SLAM and control stacks.
Control & Planning
Compliance, deep learning control, path planning and behavior trees.
Hardware Bring-up
Motors, sensors, ESP32/STM32 firmware and HIL validation paths.
Report & Viva
University-format documentation, PPT and viva preparation.
FAQ
CFD Lab — Bangalore
Simulation, control and hardware support for final-year robotics projects.
Stacks
Worlds
Digital Twin
Control
Robots
Offline
Bring-up