Abstract— Objective: Muscle contractions are commonly detected by performing EMG measurements. The major disadvantage of this technique is that mechanical disturbances to the electrodes are in the same frequency and magnitude range as the desired signal. In this work we propose an approach and a realized measurement system to combine EMG and bioimpedance measurements for higher reliabilities of muscle contraction detections. Methods: We propose the development of a modular four-channel measurement system, whereat each channel is capable of acquiring EMG, the bioimpedance magnitude and phase, simultaneously. The modules are synchronized by an additional interface board, which communicates with a PC. A graphical user interface enables to control the bioimpedance excitation current in a range from 100 µA to 1 mA in a frequency range from 50 kHz to 333 kHz. Results: A system characterization demonstrated that bioimpedance magnitude changes of less than 250 ppm and phase changes below 0.05° can be detected reliably.
Measurements from a subject have shown the timing relationship between EMG and bioimpedance signals as well as their robustness against mechanical disturbances. A measurement of five exemplary hand gestures has demonstrated the increase of usable information for detecting muscle contractions. Conclusion:
Useful
information about contractions. Furthermore, the usage of a known high-frequency excitation current enables a reliable differentiation between the actual information and disturbances.
Bioimpedance
measurements, muscle contractions can be detected much more reliably. This setup can be adopted to prostheses and many other human-computer interfaces.
Index Terms—Bioimpedance measurements, electrode-skin contact, electromyography, human-computer interaction, I/Q- demodulation, motion artifacts, multi-channel, muscle contractions, prosthesis control.
I. Introduction
N the past several years the detection of muscle contractions
Has Become An Important Technique In Biomedical
engineering. It can either be acquired at a single position of the body to analyze the state of a single muscle (group) or it is acquired at different positions simultaneously. The gathered information is commonly used to control computer systems, Manuscript received xxx xx, 201x; revised xxx xx, 201x and xxx xx, 201x; accepted xxx xx, 201x. Date of publication xxx xx, 201x; date of current version xxx xx, 201x. This work was supported by the German Federal Ministry of Education and Research (BMBF) under the project INOPRO (FKZ16SV7666).
robots, exoskeletons or prostheses , , . Especially for the last example, a high reliability is important to avoid misinterpretations of the signals, which could cause dangerous situations to the user.
The commonly used measurement technique to detect muscle contractions is the Electromyography (EMG) . This method is based on acquiring the action potentials of the contracted muscles . Typically, these signals result in differential voltages in millivolt ranges at the body surface and can be acquired using surface electrodes . Since the most dominant signal frequency range is from 10 Hz up to 100 Hz , the electrical measurement instrumentation can be very elementary.
Further methods to detect muscle contractions are the mechanomyography (MMG) and optical setups . Algorithms to combine a set of several signals to get information about movements are often machine-learning based .
One of the most challenging problems are motion artifacts, since the fixation of optical, ultrasound or acceleration sensors to the human body is problematic. But also the most commonly acquired EMG signal is very sensitive to motion artifacts .
Especially, forces to the electrode-skin interfaces result in significant signal disturbances . Since these disturbances are in a similar frequency range like the actual EMG signal, it is difficult to differentiate between both of them.
A promising measurement technique which might be more robust towards these disturbances is the electrical impedance myography (EIM). This technique is based on measuring the changes of the muscles’ electrical bioimpedance, which occur during muscle contractions, caused by geometrical changes , . The major advantage of this measurement method is that muscle contraction information is modulated onto an excitation current of much higher frequency than that of motion artifacts. Therefore, the subsequent filtering of motion artifacts is very simple. Obviously, it is also advantageous to extend the EMG information by the two additional dimensions of information, the magnitude and the phase of the bioimpedance (BioZ).
In this work, we propose a measurement method to acquire *R. Kusche and M. Ryschka are with the Laboratory of Medical Electronics
I
This is the author's version of an article that has been published in this journal. Changes were made to this version by the publisher prior to publication.
Http://Dx.Doi.Org/10.1109/Jsen.2019.2936171
EMG signals as well as bioimpedance signals simultaneously from the human body to increase the reliability of muscle contraction detections. After explaining the measurement approach, we describe the development of a four-channel measurement system, capable of acquiring the EMG signal and the magnitude as well as the phase of the bioimpedance at four different positions of the human body. The developed system is focused, but not limited to the usage in combination with upper limb prostheses.
After a system characterization, measurements from a human subject demonstrate the behavior of EIM signals in comparison to EMG signals. Additionally, the robustness towards motion artifacts of both the methods is shown. Finally, all four channels are used to measure five common hand gestures and to compare the resulting signals. For comparison purposes, this measurement is repeated for two isometric hand gestures.
Ii. Measurement Approach
Although, the EMG as well as the EIM signals contain information about the muscle state, the origins of both the signals are different. The EMG signal, acquired by means of surface electrodes, is the summation of single fiber potentials of a muscle . Activating the muscle results in measureable voltage amplitudes of up to 2 mV in the frequency range below 100 Hz .
The EIM is based on the fact, that geometrical changes during muscle contractions cause changes in the electrical impedance of the observed muscle. Since the muscle is a very anisotropic conductor, this effect depends on the positioning of the electrodes .
The major difference between both the signals is, that EMG detects muscle activations, whereas EIM detects actual muscle contractions.
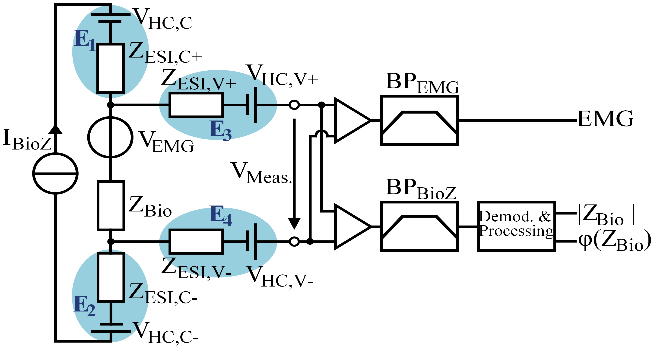
The approach of measuring both signals simultaneously is depicted in Fig. 1, in which the EMG signal is modelled as a voltage source VEMG and the bioimpedance is represented by an impedance ZBio. Via the electrodes E1 and E2, a small known AC current IBioZ with a frequency in kHz range is applied to the tissue under test. This current flows through the EMG voltage source and the bioimpedance. Two additional electrodes (E3 and E4) are used do acquire the occurring voltage drop. Because of the significant influence of the electrode-skin interfaces , the electrodes are modelled as serial circuits consisting of electrode-skin impedances (ZESI) and DC voltage sources (VHC), representing the occurring half-cell voltages. Assuming the input impedance of the differential amplifiers to be infinity, this model leads to the actual measurable addition of voltages with different frequencies, as shown in equation 1.
𝑉𝑉𝑀𝑀𝑀𝑀𝑀𝑀𝑀𝑀. = 𝑉𝑉𝐸𝐸𝐸𝐸𝐸𝐸+ 𝑍𝑍𝐵𝐵𝐵𝐵𝐵𝐵⋅𝐼𝐼𝐵𝐵𝐵𝐵𝐵𝐵𝐵𝐵+ 𝑉𝑉𝐻𝐻𝐶𝐶,𝑉𝑉+ −𝑉𝑉𝐻𝐻𝐻𝐻,𝑉𝑉− (1) Two different paths of signal processing, each beginning with amplification, are applied for the EMG and bioimpedance signal extraction, respectively.
For obtaining the EMG signal and removing high frequency disturbances as generated by the EIM, a band pass filter (BPEMG) is used. When VHC,V+ and VHC,V- are DC voltages, the band pass filter attenuates also these signal components.
However, if mechanical forces, applied to the electrodes, change the half-cell voltages quickly over time, the occurring AC voltages are not removed anymore.
The bioimpedance path includes a band pass filter (BPBioZ) for removing undesirable frequency components as well. The
Bioimpedance
measurements is much higher than that of typical motion artifacts , . Therefore, the lower cut-off frequency of the filter is much higher than the frequency range of the occurring disturbances. To calculate the bioimpedance magnitude |ZBio| and phase ϕ(ZBio), the signal is demodulated by an IQ (In-phase and Quadrature)-demodulation in combination with low pass filters. Since this demodulation technique utilizes the knowledge about the excitation frequency of the current source (IBioZ), other frequency components are cancelled out.
Iii. System Development
To allow a high flexibility regarding the number of channels, a modular four-channel measurement system was designed. Significant requirements were the synchronicity of EMG and Fig. 1. Illustration of the simplified measurement approach. The blue ellipses represent the electrical behavior of the electrode-skin interfaces. The current source IBioZ is part of the electrical circuitry, whereas the voltage source VEMG symbolizes the EMG signal source of the muscle.
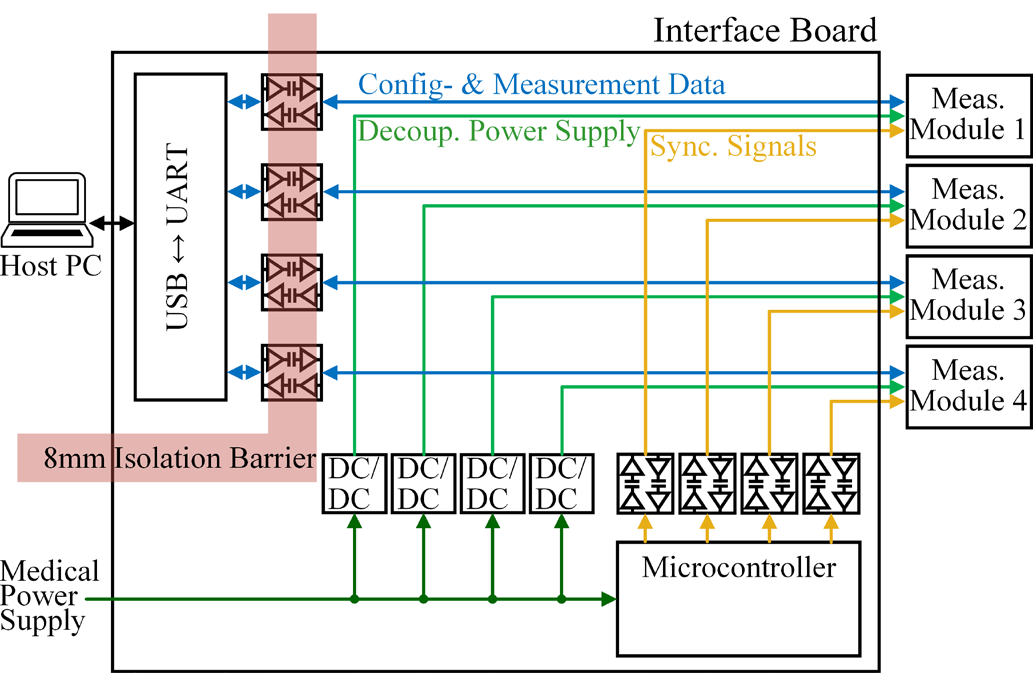
Fig. 2. Block diagram of the whole developed measurement system with a focus on the interface board, which connects a host PC with the four measurement modules. The red bar illustrates the galvanic isolation barrier of 8 mm width to fulfill the IEC60601-1. The blue arrows indicate the exchange of data and the green arrows represent the power supply connections, which decouple the modules electrically from each other. For the same reason, the yellow synchronization connections are interrupted by digital isolators as well.
This is the author's version of an article that has been published in this journal. Changes were made to this version by the publisher prior to publication.
Http://Dx.Doi.Org/10.1109/Jsen.2019.2936171
EIM measurements as well as the medical electrical safety. Since the device is intended to measure bioimpedances at several points of the subject simultaneously, a galvanic decoupling of all channels had to be implemented .
After an overview of the whole system, the developed measurement modules are explained more detailed. Finally, the realization of the device is presented.
A. Concept
In Fig. 2, the block diagram of the developed measurement system is depicted. It consists mainly of an interface board and four measurement modules. The interface board is intended to convert the USB interface of a linked host PC to four UART connections for the measurement modules. In accordance with the safety requirements for medical electrical devices (IEC 60601-1) the measurement modules together with their connection on the interface board are regarded as Applied Parts, which need to be isolated. The isolation for data transport is accomplished by digital isolators (ISO7721, Texas Instruments, Dallas, TX, US) which realize an 8 mm isolation gap. For powering the measurement system, an external 5 VDC medical power supply is used (MPU31-102, SINPRO Electronics, Pingtung City, TW). To decouple the measurement channels from each other, necessary ±5 VDC supply voltages are
Converters
(MTU2D0505, Murata Power Solutions, Westborough, MA,
Synchronizing All Boards Is Realized By A Common
synchronization clock, which is generated by a microcontroller (ATSAM4S16C, Microchip Technology, Chandler, AZ, US) and transmitted via digital isolators (MAX14930, Maxim Integrated, San Jose, CA, US) to the measurement modules.
B. Measurement Modules
Each measurement module is intended to acquire an EMG signal and the complex bioimpedance from a human subject simultaneously. Since the modules are also intended to be used in combination with other devices like prostheses, the data interface is desired to be simple.
The EMG signal characteristic is well known and has already been described above. However, the exact impedance behavior of the muscle during contractions is difficult to predict. In literature, impedance changes in the range from about 1 % to 5 % have been reported . These values can vary widely and depend on the specific measurement setup and the used excitation frequency. Therefore, the EIM circuitry has to be flexible regarding excitation frequency and impedance range.
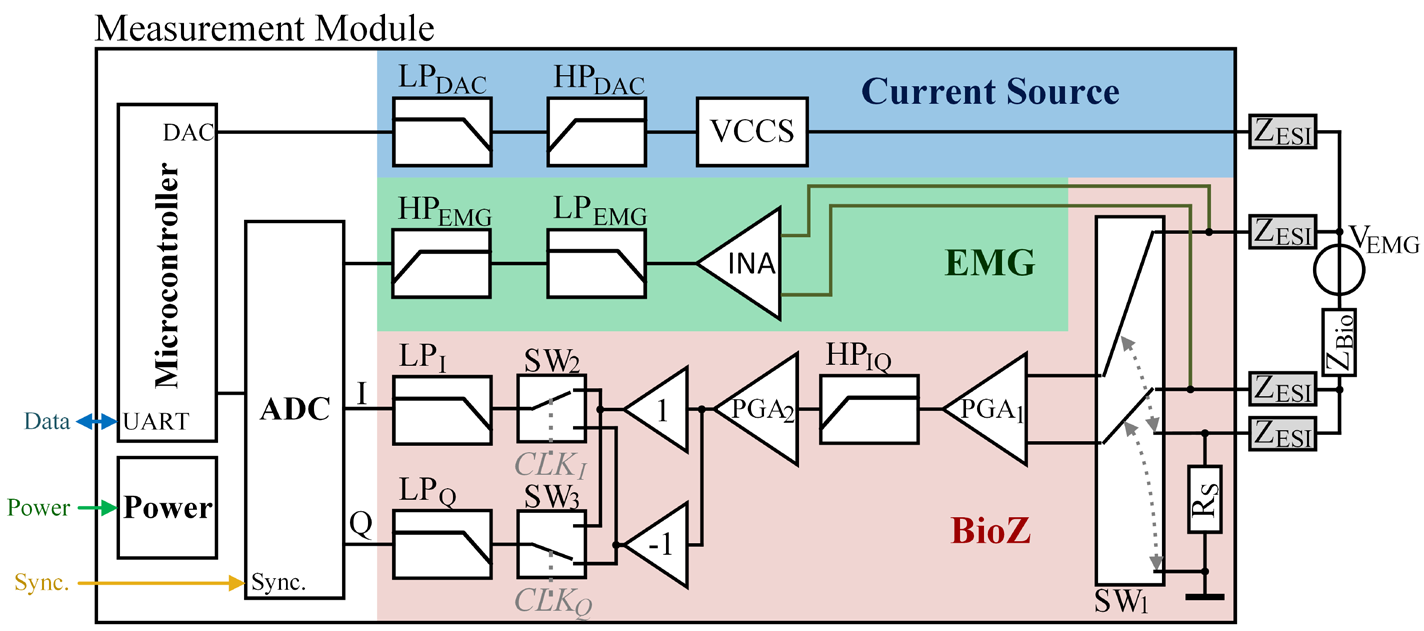
Based on these requirements, the measurement modules were developed. In Fig. 3, the block diagram of a measurement module is shown. After receiving the configuration data from the previously described interface board, the microcontroller’s (ATSAM4S16C, Microchip Technology, Chandler, AZ, US) digital-to-analog converter (DAC) generates a sinusoidal voltage in the frequency range from 50 kHz to 333 kHz with a sampling rate of 1 MSPS. In this band, the bioimpedance is very sensitive against frequency changes . An active low-pass filter (LPDAC, N=4, fc=350 kHz) attenuates the DAC artifacts and a passive high-pass filter (HPDAC, N=1, fc=200 Hz) removes the DC component. Utilizing a voltage-controlled current source (VCCS) circuit , , this AC voltage is converted into an AC current. This current flows via electrodes through the examined bioimpedance (ZBio) and a known shunt resistor
(Rs).
The occurring voltage drop over the bioimpedance, caused by the excitation current, as well as the superposition of the EMG voltage, is detected by two additional inner electrodes.
Fig. 3. Detailed block diagram of a measurement module. On the left side there are the connections to the previously described interface board. On the right side the connected measurement subject, which is connected via electrodes, is drawn. The measurement module consists of a microcontroller, a power section, an analog-to-digital converter and three major analog electronics blocks. The blue block marks the current source circuit, the green rectangle illustrates the EMG circuit and the red area indicates the bioimpedance measurement circuit, which is based on an IQ-demodulation.
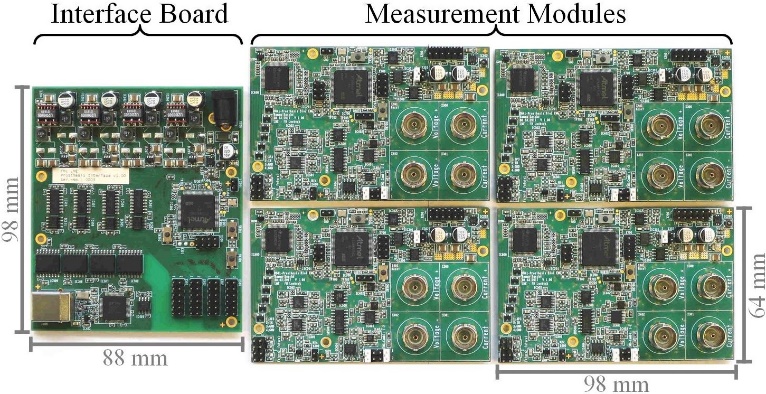
Fig. 4. Photograph of the interface board and four measurement modules. The interface board consists of about 200 components and has dimensions of 98 x 88 mm. On the measurement modules about 300 components are populated and its dimensions are 98 x 64 mm.
This is the author's version of an article that has been published in this journal. Changes were made to this version by the publisher prior to publication.
Http://Dx.Doi.Org/10.1109/Jsen.2019.2936171
The processing of this differential voltage signal is split into two different paths. The green colored block indicates the EMG signal processing and the red block the bioimpedance measurement circuitry.
In the green EMG block, the differential voltage is pre- amplified and converted into a single-ended signal by an instrumentational amplifier (INA, INA126, Texas Instruments, Dallas, TX, US, G=11). To remove the high frequency signal components, caused by the bioimpedance measurement, the signal is filtered by an active low-pass filter (LPEMG, N=2, fc=100 Hz, G=5). Afterwards, the DC voltage component is removed by a passive high-pass filter (HPEMG, N=1, fc=3 Hz) and the signal is transmitted to the analog-to-digital converter (ADC, ADS131E06, Texas Instruments, Dallas, TX, US).
In the red BioZ block, the acquired differential voltage is connected to an analog switch (SW1, ADG1236, Analog Devices, Norwood, MA, US), which can be used to choose between measuring the voltage drop over the bioimpedance or over the shunt resistor to determine the actual measurement current. The selected signal is amplified by a programmable gain amplifier (PGA1, AD8250, Analog Devices, Norwood, MA, US, G={1, 2, 5, 10}) and high-pass-filtered (HPIQ, N=1 fc=1 kHz) to attenuate low-frequency noise and the DC voltage, caused by the electrodes’ half-cells. Afterwards, the signal is amplified by the PGA2 (AD8250). For the IQ-demodulation, the signal’s In-phase (I) and Quadrature (Q) components have to be determined . Therefore, the signal passes two separate paths. In both the paths, analog switches (SW2, SW3, MAX4523, Maxim Integrated, San Jose, CA, US) alternate between the original and the inverted signal, clocked by the microcontroller with the current excitation signal frequency.
The clock signals (CLKI, CLKQ) are phase shifted by 90° to realize the IQ-demodulation method . Since only the occurring time dependent DC components of both the switching outputs contains the useful information, the signals are low pass filtered (LPI, LPQ, N=6, fc=1 kHz) before digitization.
The analog processed EMG, the I-component as well as the Q-component signals are digitized synchronously by the 6- channels ADC with a sampling rate of 1000 SPS and a resolution of 24 bits. The remaining three ADC channels are prepared for future use purposes. Via a serial peripheral interface (SPI), the ADC transmits the digitized data to the microcontroller.
C. Implementation
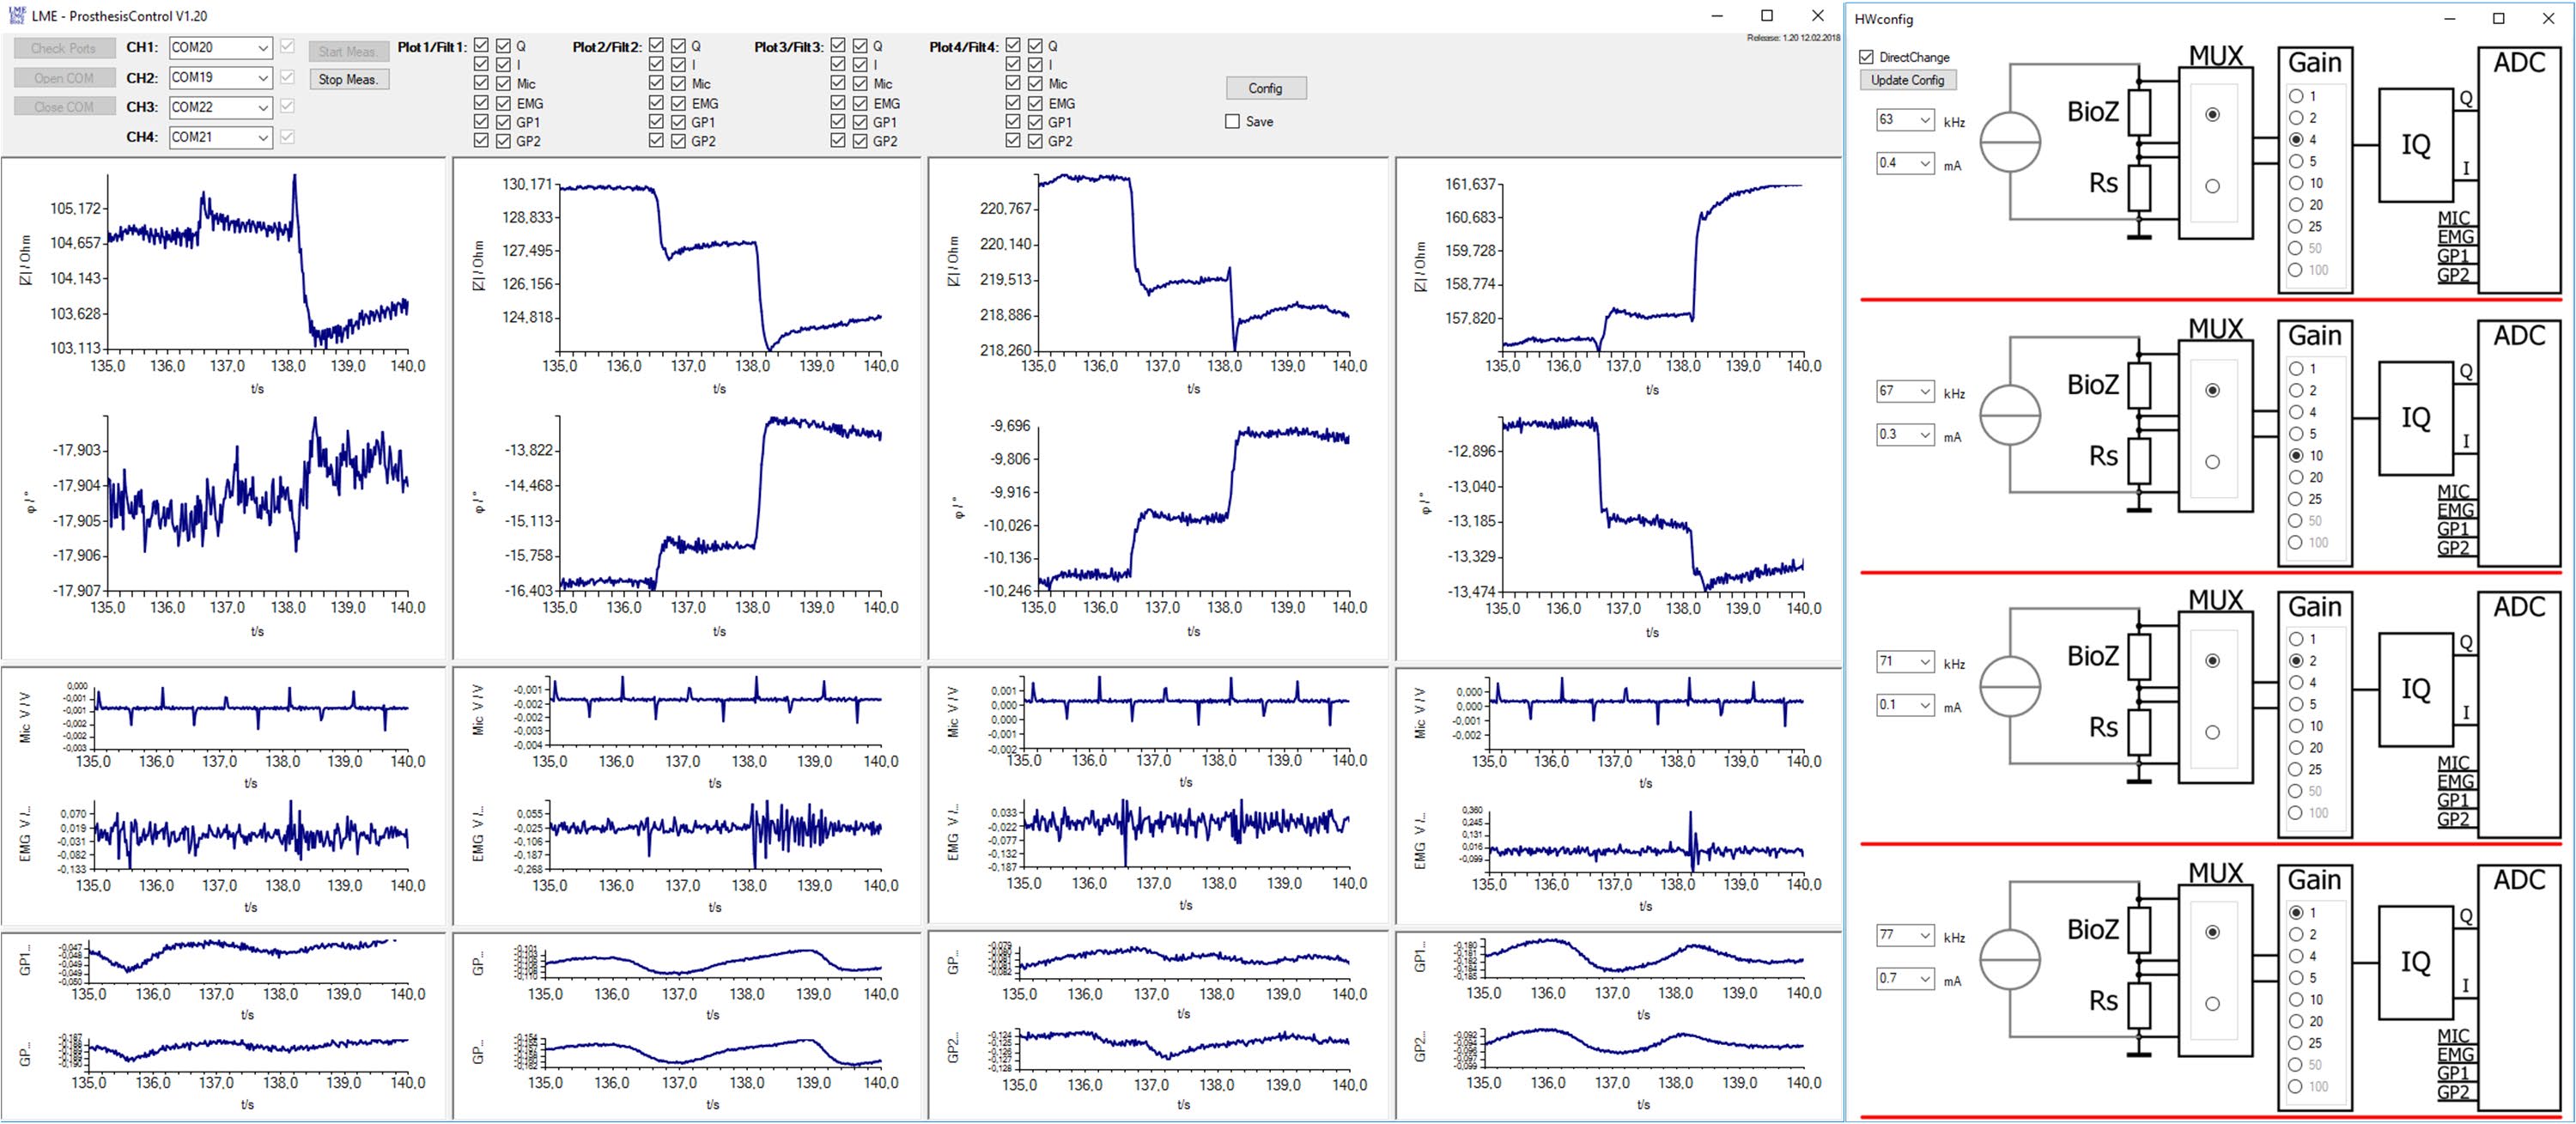
To realize the interface board as well as the measurement modules, 4-layers printed circuit boards (PCB) have been developed, as shown in the photograph in Fig. 4. To control the device and to display the measured data in real-time, a graphical user interface (GUI) has been programmed in C# language. A screenshot is depicted in Fig. 5. Since it is assumed, that during a measurement the applied excitation current is stable, the GUI automatically measures the current just once at the end of a measurement procedure. For that purpose, it changes the position of SW1 to the shunt resistor.
The excitation frequency of each measurement module can be chosen from 17 discrete values in the range from 50 kHz to 333 kHz. To keep the occurring voltage drops over the bioimpedances in the range of typical EMG signals as well as for electrical safety purposes, the excitation current amplitudes are limited and can be chosen from 11 discrete values in the range from 100 µA to 1 mA. Selectable total PGA gains for the voltage measurement are G=1; 2; 4; 5; 10; 25; 50; 100.
The total power consumption with all four active channels is about 5.5 W, whereas each measurement module consumes about 1 W.
Iv. System Performance
Before performing measurements on subjects, the system
Performance Has To Be Analyzed. This Includes The
determination of measurement errors such as systematic, statistical as well as the system’s long-term drift errors. Finally, the synchronicity of all measurement channels is verified.
Fig. 5. Screenshot of the GUI to control the measurement system and to display the acquired data in real-time. Each column shows the six digitized signals of a measurement module. On the right side, the configuration window is shown. It can be used to change the frequency and amplitude of the excitation current as well as for configuring the gain of the programmable gain amplifiers.
This is the author's version of an article that has been published in this journal. Changes were made to this version by the publisher prior to publication.
A. Systematic Errors
Since especially the impedance changes over time are of interest, in many bioimpedance measurement applications the systematic error is not as important as the statistical error.
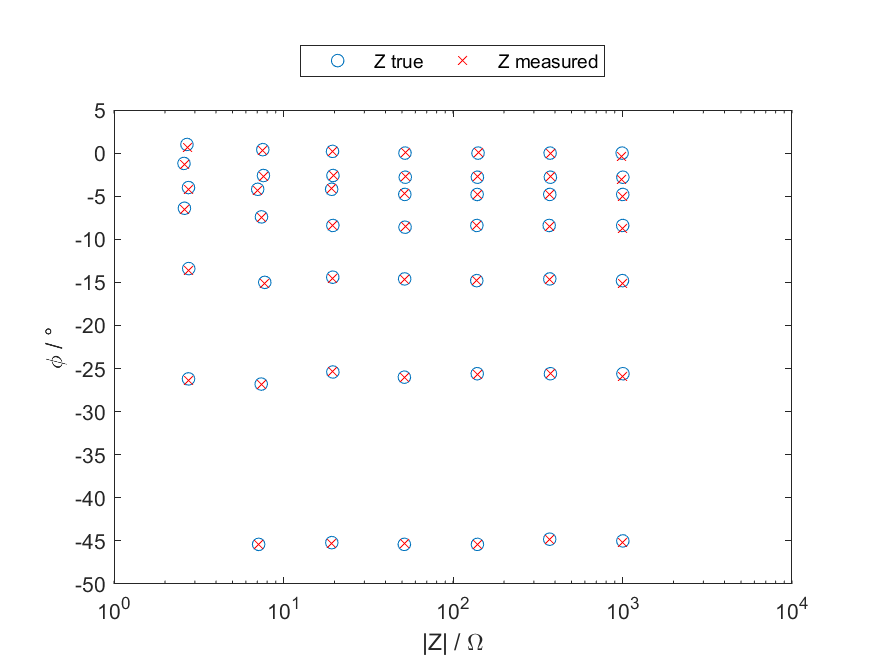
Nevertheless, the system’s systematic errors were analyzed by measuring known impedances in the range from magnitudes |Z|=2.7Ω to 1000 Ω and from phase shifts ϕ=0° to ϕ=-45°. The tolerances of the used impedances are 0.1 % and 0.1°, respectively. To eliminate the influence of the statistical errors during this process, each impedance was measured for a duration of 1 s, corresponding to 1000 samples and then averaged. Since in this work the system cannot be characterized for all possible configurations, only one combination of excitation current and frequency was used. The excitation signal was chosen to be I=1 mA with a frequency of f=100 kHz.
In Fig. 6 the true impedances as well as the measured values are plotted. To analyze if the actual magnitude or phase of the impedance under test has an influence to the systematic error, both were varied. Table I summarizes the obtained values of the absolute and relative systematic measurement errors under the variation of the magnitude and the phase.
The relative magnitude errors were measured to be lower than 2 ‰ and the phase errors are below 0.2° in the range from 7.3 Ω to 373.6 Ω. These values are in the range of the tolerances of the used test impedances. The observed systematic errors are sufficient for the intended application.
B. Statistical Errors
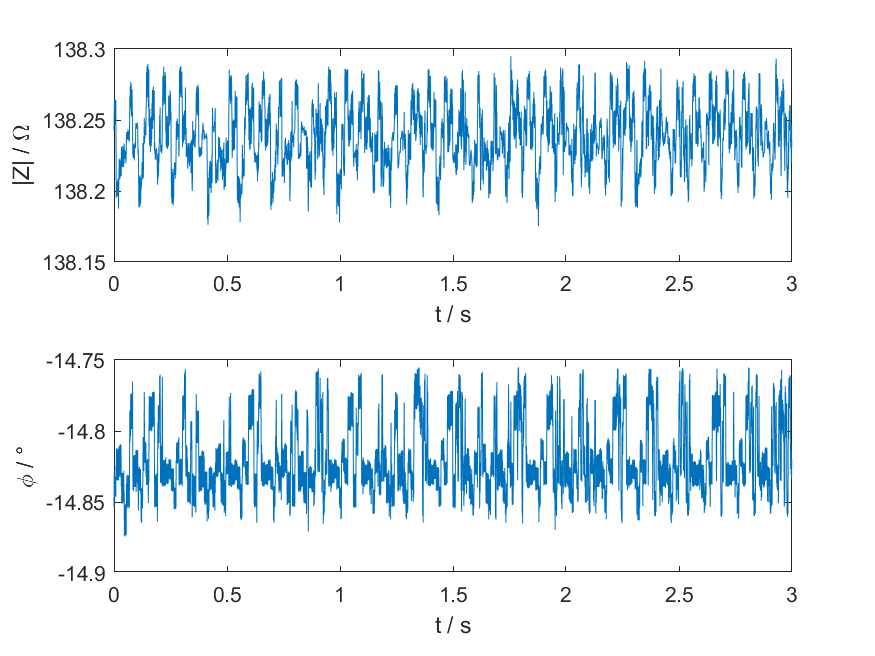
Especially for detecting the expected impedance changes reliably, it is important to determine the statistical errors of the system. For this purpose, the known test impedances are measured similarly as for the systematic error measurement but with a focus on statistical errors. In Fig. 7, an exemplary measurement with a duration of 3 s of one of these impedances is shown.
For calculating the standard deviations (STD) of the magnitudes and phases, measurements with durations of 1 s are used.
In Table II, the obtained values are again shown under variation of the impedance’s magnitude and phase. Since it is assumed that muscle contractions cause impedance changes in Ω-ranges , the standard deviation of maximum 202 mΩ is sufficiently small. The standard deviation of the phase measurement for all setups is lower than 0.03°. The results in the table II also show, that the standard deviations of the magnitude as well as of the phase do not significantly depend on the absolute values of the analyzed impedance.
C. Long-Term Drift
To estimate the long-term drift of the device, a measurement of a 7.3 Ω test impedance with a phase of -25.7° was performed for a duration of 20 minutes. The absolute drift during this time period was determined to be lower than 0.5 mΩ according to Fig. 6. Plot of 48 actual impedance values (blue circles) and measured values (red crosses). Each value was measured for a duration of 1 s and averaged. The excitation current was chosen to be 1 mA with a frequency of 100 kHz.
Fig. 7. Exemplary measurement of a complex impedance over 3 s, 3000 samples respectively. The true values are |Z|=138.1 Ω; ϕ(Z)=-14.8°. The standard deviations of this measurement were calculated to be 20 mΩ and 0.024°.
0.01
This is the author's version of an article that has been published in this journal. Changes were made to this version by the publisher prior to publication.
Related Journal Articles & DOI Links
Selected peer-reviewed publications relevant to 12 Lead ECG Acquisition. Click the DOI to access the full paper (may require institutional access).
-
1. Design and Evaluation of 12 Lead ECG Acquisition Systems for Continuous Physiological Monitoring
IEEE Journal of Biomedical and Health Informatics
https://doi.org/10.1109/JBHI.2020.2981234 -
2. Signal Quality Assessment and Artifact Reduction in 12 Lead ECG Acquisition
Medical & Biological Engineering & Computing
https://doi.org/10.1007/s11517-020-02145-6 -
3. Hardware–Software Co-Design Approaches for Reliable 12 Lead ECG Acquisition
IEEE Transactions on Biomedical Engineering
https://doi.org/10.1109/TBME.2019.2895762 -
4. Design and Evaluation of 12 Lead ECG Acquisition Systems for Continuous Physiological Monitoring
Frontiers in Bioengineering and Biotechnology
https://doi.org/10.3389/fbioe.2020.00123 -
5. Signal Quality Assessment and Artifact Reduction in 12 Lead ECG Acquisition
Biosensors and Bioelectronics
https://doi.org/10.1016/j.bios.2021.112345 -
6. Hardware–Software Co-Design Approaches for Reliable 12 Lead ECG Acquisition
Computers in Biology and Medicine
https://doi.org/10.1016/j.compbiomed.2021.104567 -
7. Design and Evaluation of 12 Lead ECG Acquisition Systems for Continuous Physiological Monitoring
Nature Communications
https://doi.org/10.1038/s41467-020-12345-6
Why Choose Us?
Bangalore guidance for robotics, Spectre and autonomous systems projects.
Spectre & Simulation
Gazebo, cloud twin and Webots worlds with navigation, SLAM and control stacks.
Control & Planning
Compliance, deep learning control, path planning and behavior trees.
Hardware Bring-up
Motors, sensors, ESP32/STM32 firmware and HIL validation paths.
Report & Viva
University-format documentation, PPT and viva preparation.
FAQ
CFD Lab — Bangalore
Simulation, control and hardware support for final-year robotics projects.
Stacks
Worlds
Digital Twin
Control
Robots
Offline
Bring-up