Procedures
Po-Jen Shih1, I-Jong Wang2, Wen-Feng Cai1 & Jia-Yush Yen3 Recent advances in the analysis of corneal biomechanical properties remain difficult to predict the structural stability before and after refractive surgery. In this regard, we applied the finite element method (FEM) to determine the roles of the Bowman’s membrane, stroma, and Descemet’s membrane in the hoop stresses of cornea, under tension (physiological) and bending (nonphysiological), for patients who undergo radial keratotomy (RK), photorefractive keratectomy (PRK), laser-assisted in situ keratomileusis (LASIK), or small incision lenticule extraction (SMILE). The stress concentration maps, potential creak zones, and potential errors in intraocular pressure (IOP) measurements were further determined. Our results confirmed that the Bowman’s membrane and Descemet’s membrane accounted for 20% of the bending rigidity of the cornea, and became the force pair dominating the bending behaviour of the cornea, the high stress in the distribution map, and a stretch to avoid structural failure. In addition, PRK broke the central linking of hoop stresses and concentrated stress on the edge of the Bowman’s membrane around ablation, which posed considerable risk of potential creaks. Compared with SMILE, LASIK had a higher risk of developing creaks around the ablation in the stroma layer. Our FEM models also predicted the postoperative IOPs precisely in a conditional manner.

From the viewpoint of biomechanics and safety, corneas undergoing refractive surgery must maintain a stable shape and avoid postsurgical biomechanical decompensation, which may result in an unsatisfactory visual recov- ery and complications1,2. The progress of refractive surgery from radial keratotomy (RK) using a diamond knife3 to automated lamellar keratoplasty using a mircrokeratome, photorefractive keratectomy (PRK), laser-assisted subepithelial keratectomy (LASEK), laser-assisted in situ keratomileusis (LASIK), refractive lenticule extraction, and small incision lenticule extraction (SMILE) using excimer lasers or femtosecond lasers has increased the pre- cision and safety of the method1. In addition, the increasing knowledge of corneal biomechanics has contributed to both promising results and increasing postsurgical safety. However, iatrogenic corneal ectasia remains the most feared scenario that can occur after an uneventful corneal laser surgery, although a reduction in its incidence from 4% to 2.8% has been reported following LASIK, PRK, or other corneal refractive procedures4. Risk factors for iatrogenic corneal ectasia include thin corneas (<500 µm), a pathological corneal topography, a residual stro- mal bed of <300 µm, high myopia of <−8 D, age of <25 years (in females), atopic dermatitis, allergies, family history for keratoconus and collagen diseases, and retreatments5. In severe cases, a penetrating keratoplasty or a deep anterior lamellar graft is necessary6.
For safety, ideal refractive surgery aims to maintain a stable response of central flattening and peripheral steep- ening in a stiff cornea preoperatively and postoperatively7. Therefore, corneal biomechanics must be measured correctly to prevent adverse events after surgery. Currently, two devices are available for measuring some biome- chanical properties and providing a clinical assessment of corneal deformation response, namely the Corvis®
2
ST (Oculus Inc., Berlin, Germany) and ocular response analyser (ORA; Reichert Inc., Depew, NY). However, both these devices cannot accurately predict the possibility of iatrogenic ectasia before surgery7,8. Furthermore, modern laser refractive surgical procedures alter the corneal lamellae or collagen fibres by laser ablation or dis- ruption. These procedures differ from the incisions in corneas made during RK; thus, different responses of corneal biomechanics result from modern laser refractive surgical procedures. Accordingly, complaints of glare, halo effect, fluctuating vision, corneal fragility during trauma, and a progressive hyperopic change might differ among these surgical procedures when assessed in a long-term follow-up after surgery9. A preoperative study of corneal biomechanics is necessary for preventing complications and iatrogenic ectasia. Furthermore, the bio- mechanical parameters of the cornea include a function of the intraocular pressure (IOP) and the stiffness of the sclera10 because IOP measurements with applanation tonometry are not valid once the corneal structure is altered7,11. Furthermore, patient-specific numerical determination12 is a crucial safety concern for patients who seek surgery. Ariza-Gracia et al. reported that the noncontact tonometry test is not sufficient to evaluate the individual mechanical properties and a complete in vivo characterization of the preoperative cornea, in which the anterior cornea presents compression in a range of 0–0.4 MPa individually13. Other ex vivo measurements with a numerical-experimental protocol, which include biaxial tension and bending experiments, should be used to cal- ibrate corneal mechanical properties individually14,15. Furthermore, measuring the entire shape of the cornea16,17 instead of the apical displacements, with an in vivo biomechanical analyser is indispensable for this purpose18, because the limbus stiffness is 47.3% lower than that of the central cornea.
In current study, we applied the finite element method13,19,20 (FEM) and the Goldmann applanation principle21 to simulate the biomechanical responses in corneal layer structures having undergone RK, PRK, LASIK22,23, and SMILE24. The material behaviours of corneas were regarded as nearly incompressible anisotropic hyperelastic behaviours, as described in previous constitutive models23,25–27, and the biomechanical behaviours of corneas that underwent refractive surgeries were authenticated through considerations of geometry28,29, boundary con- ditions20,30, and mesh analysis13,31,32. The simulated corneal deformation and created stress maps33,34, when the corneas were subjected to the influence of IOP and applanation pressure (IOPa), were based on the basis of previ- ously reported Young’s moduli of layered corneal structures28. Finally, the analyses of stresses and displacements were compared with previous simulations21,24,35,36 and experiments37–39. Our results indicated that the major hoop stress acts on the circumference and parallel to the length of the cornea, which results in tensile stress in the meridian directions. Different potential creak zones were noted in the layers of corneas that had undergone refractive surgical procedures and had been subjected to eye rubbing conditions.
Results
Corneal shape changes and hoop stress distribution.
Based On Our Fem Models, The Simulations Of
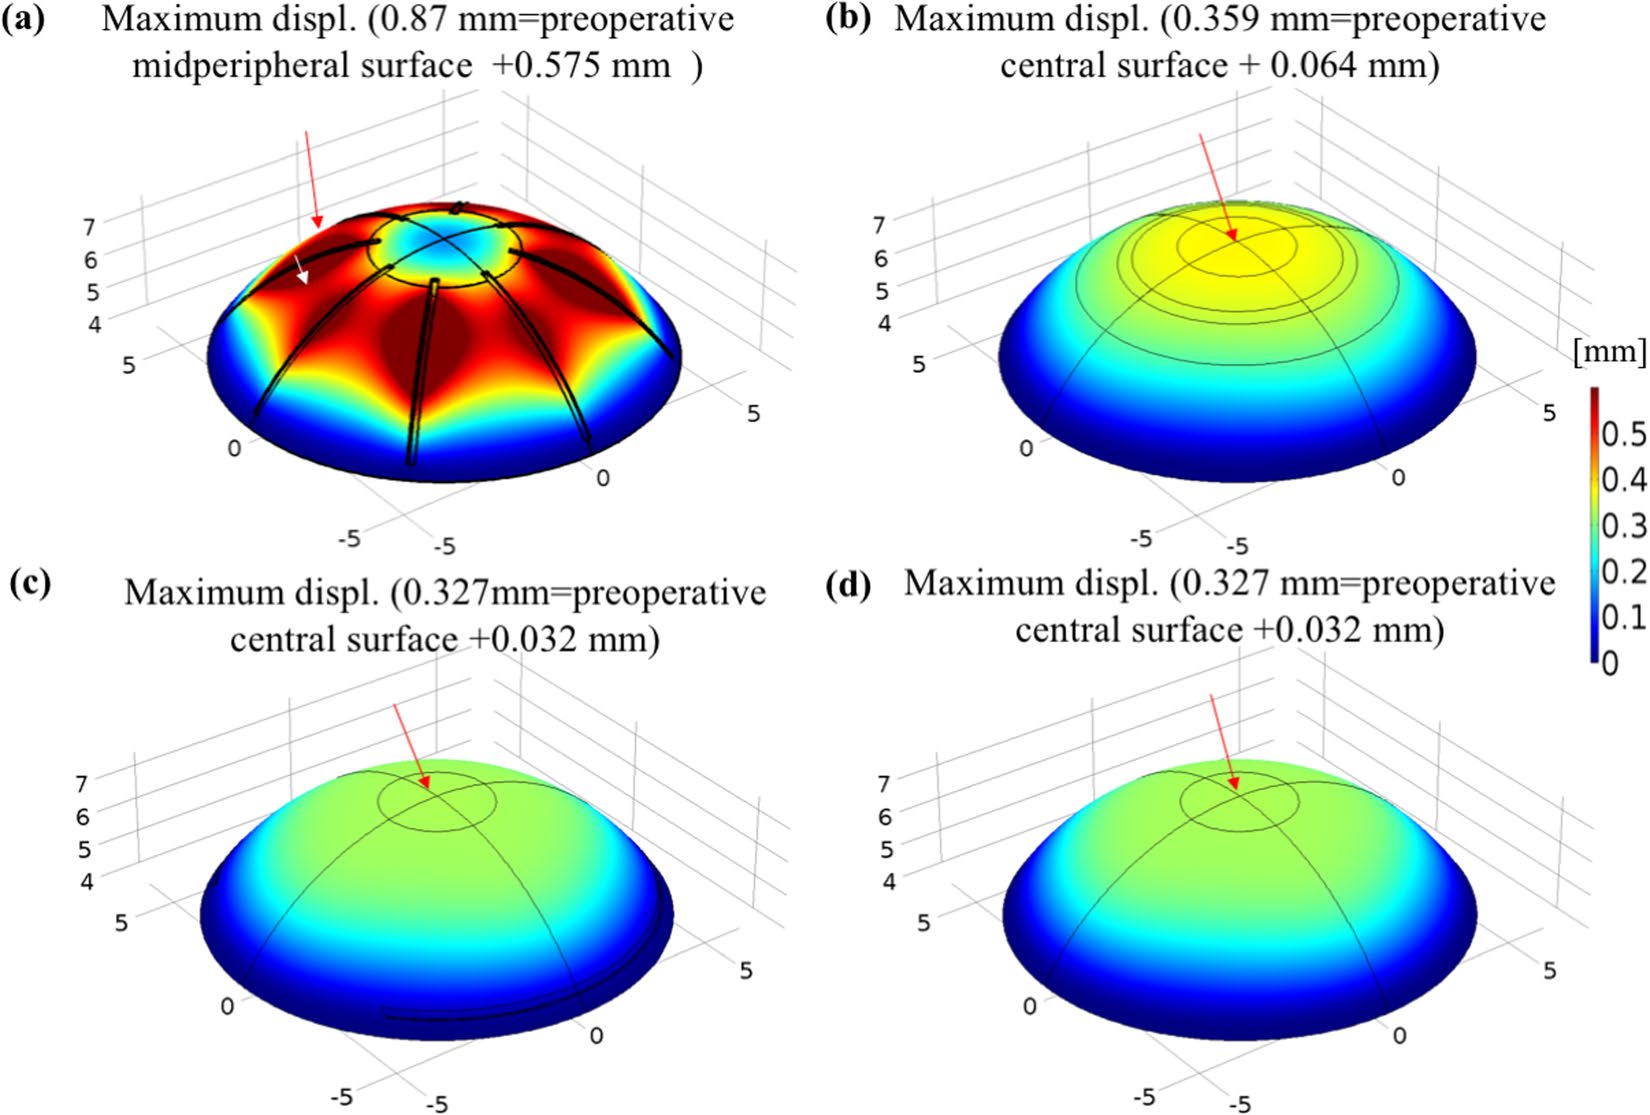
the changes of corneal shape and hoop stress distribution associated with the four refractive surgical procedures (5D) are illustrated in Figs 1 and 2. For RK, because of the combined effects of IOP and the changes in corneal integrity, the midperipheral cornea was deformed outwardly (575 µm elevation from the surface of the preoper- ative cornea) to a greater extent than were other parts of the cornea, as illustrated in Fig. 1a; however, the central cornea showed less displacement. For PRK, because the superficially central stroma and Bowman’s membrane were ablated, the inner pressure pushed the central cornea outwards, as shown in Fig. 1b. The deformation pat- terns observed from LASIK and SMILE models (Fig. 1b and c) were similar to those of PRK (Fig. 1b), and the maximum displacement occurred at the central cornea.
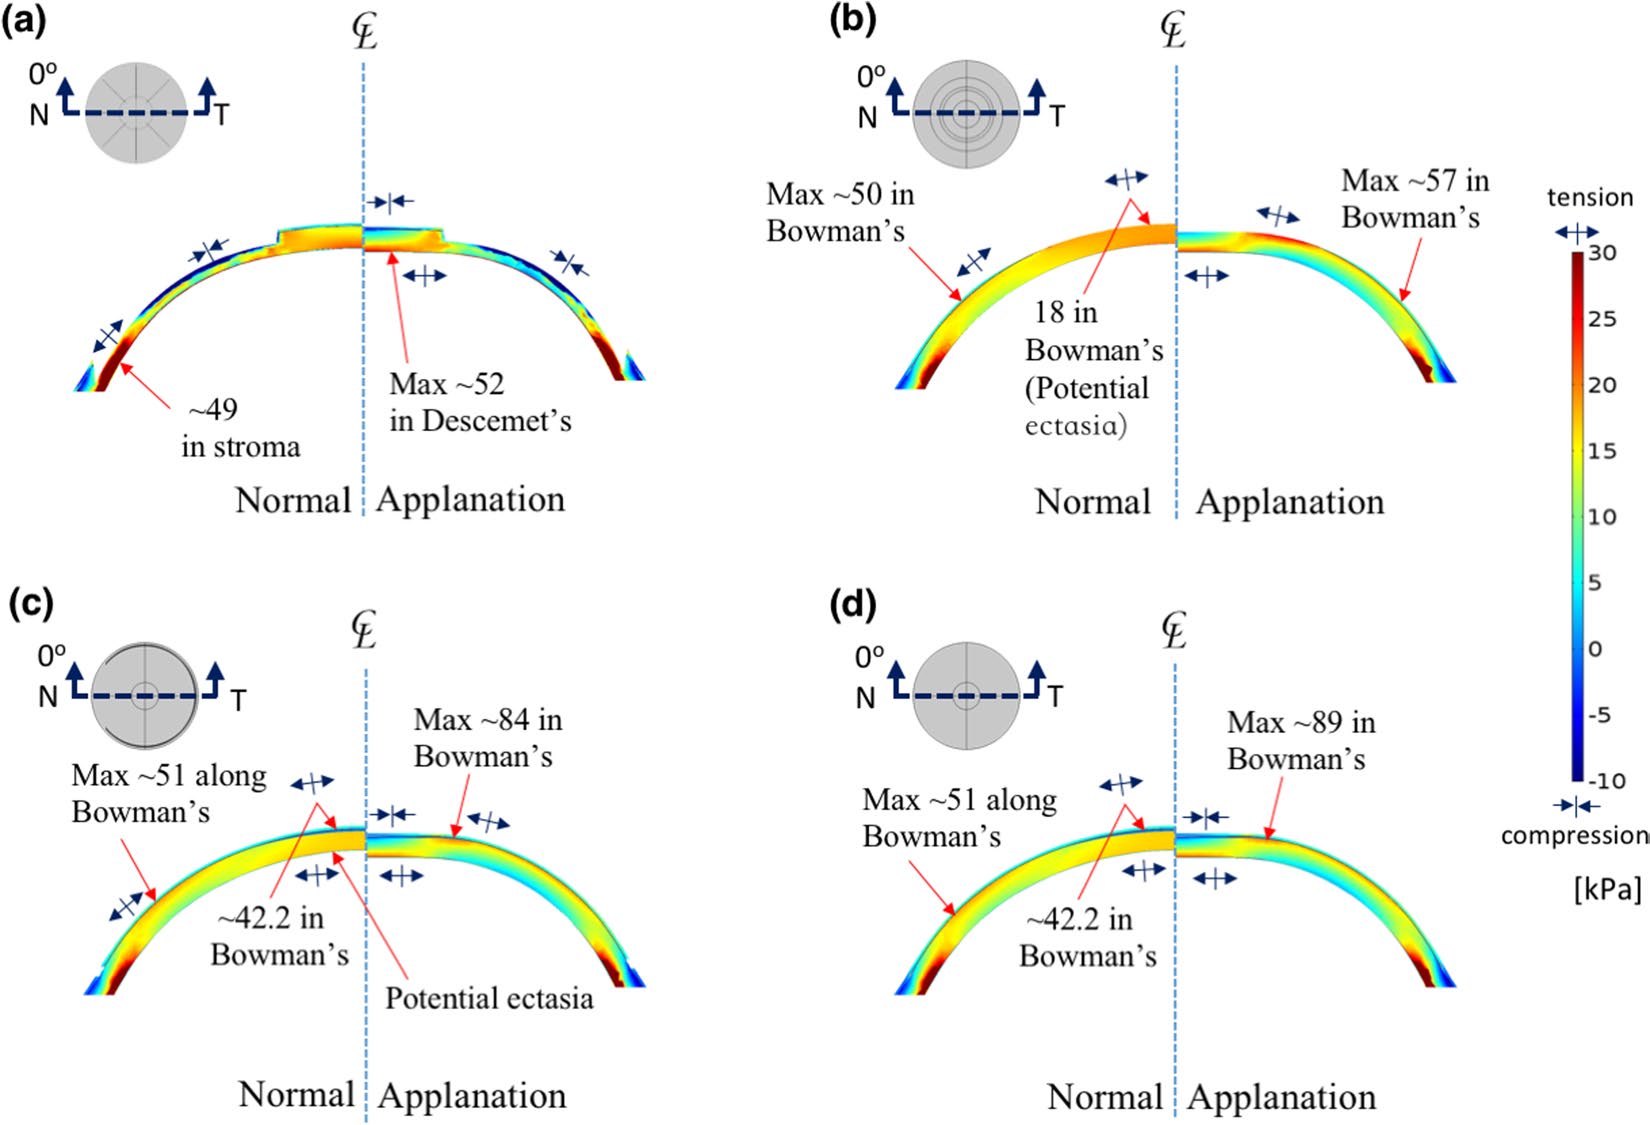
Figures 2 and S1 presents the hoop stress, σφ, on the cornea under normal (left) and applanation (right) con- ditions; the four refractive surgery models with 5D correction are also demonstrated for further analysis. The colour scales in Fig. 2 are identical in these four models. The hoop stress acted on the circumference and parallel to the length of the cornea, describing the tension in the meridian (φ) direction. Since collagen lamellae in the stroma appear to be close to each other in the inferior–superior (I–S) and nasal–temporal (N–T) directions40–43, the incisions of the RK would loosen or break these fibres (−90%). The negative σφ (compression) in Fig. 2a is indicated in the major axis of the midperipheral cornea but positive σφ (tension) is indicated in the minor axes in Figure S1a and e. For the PRK model, the apical stress σφ was 18 kPa, which was slightly less than the 19.62–21.57 kPa stress range from the other simulation model38. The highest σφ was located in the central cornea without applanation, and the area of highest stress was located around the ablated edge under applanation, as depicted in Figs 2b and S1b. For the LASIK model, the highest σφ was located in the stroma and in the Bowman’s membrane around the ablated edge, as shown in Figs 2c and S1c. For the SMILE model shown in Fig. 2d, the apical maxi- mum stress σφ was 42.2 kPa, which was higher than the 35 kPa predicted by the simulation model of Studer et al.24.
The highest σφ was also located near the ablated edge, and was higher than the stress in the LASIK model, which is compatible with the findings of Roy et al.35. We reason that the flap edge of LASIK interrupts the stress in the Bowman’s membrane and decreases the stress in the midperipheral cornea. Thus, the stress is transferred to the minor axis and increases the values as illustrated in Figure S1c. Upon applanation, the hoop stress, σφ, in the cen- tral cornea decreased because the applanation force bent the central cornea inward, thus compressing the top of the central cornea14.
First principal stress (FPS) analysis. The FPS analysis of these four models facilitated the investigation of the maximum stresses in corneas subjected to refractive surgical procedures with or without applanation.
The FPS is the component of the stress tensors when the basis is rotated to reduce the shear stress component to zero44. Once the material properties of the layered cornea, particularly the yielding stress and broken stress, are provided, potential damage under high FPS conditions can be predicted as expected. Thus, the cornea under tension might tear perpendicularly to the FPS direction. Accordingly, Figs 3 and S2 depict the stress distribution associated with a high FPS under normal conditions (left) and under the applanation condition (right). The
3
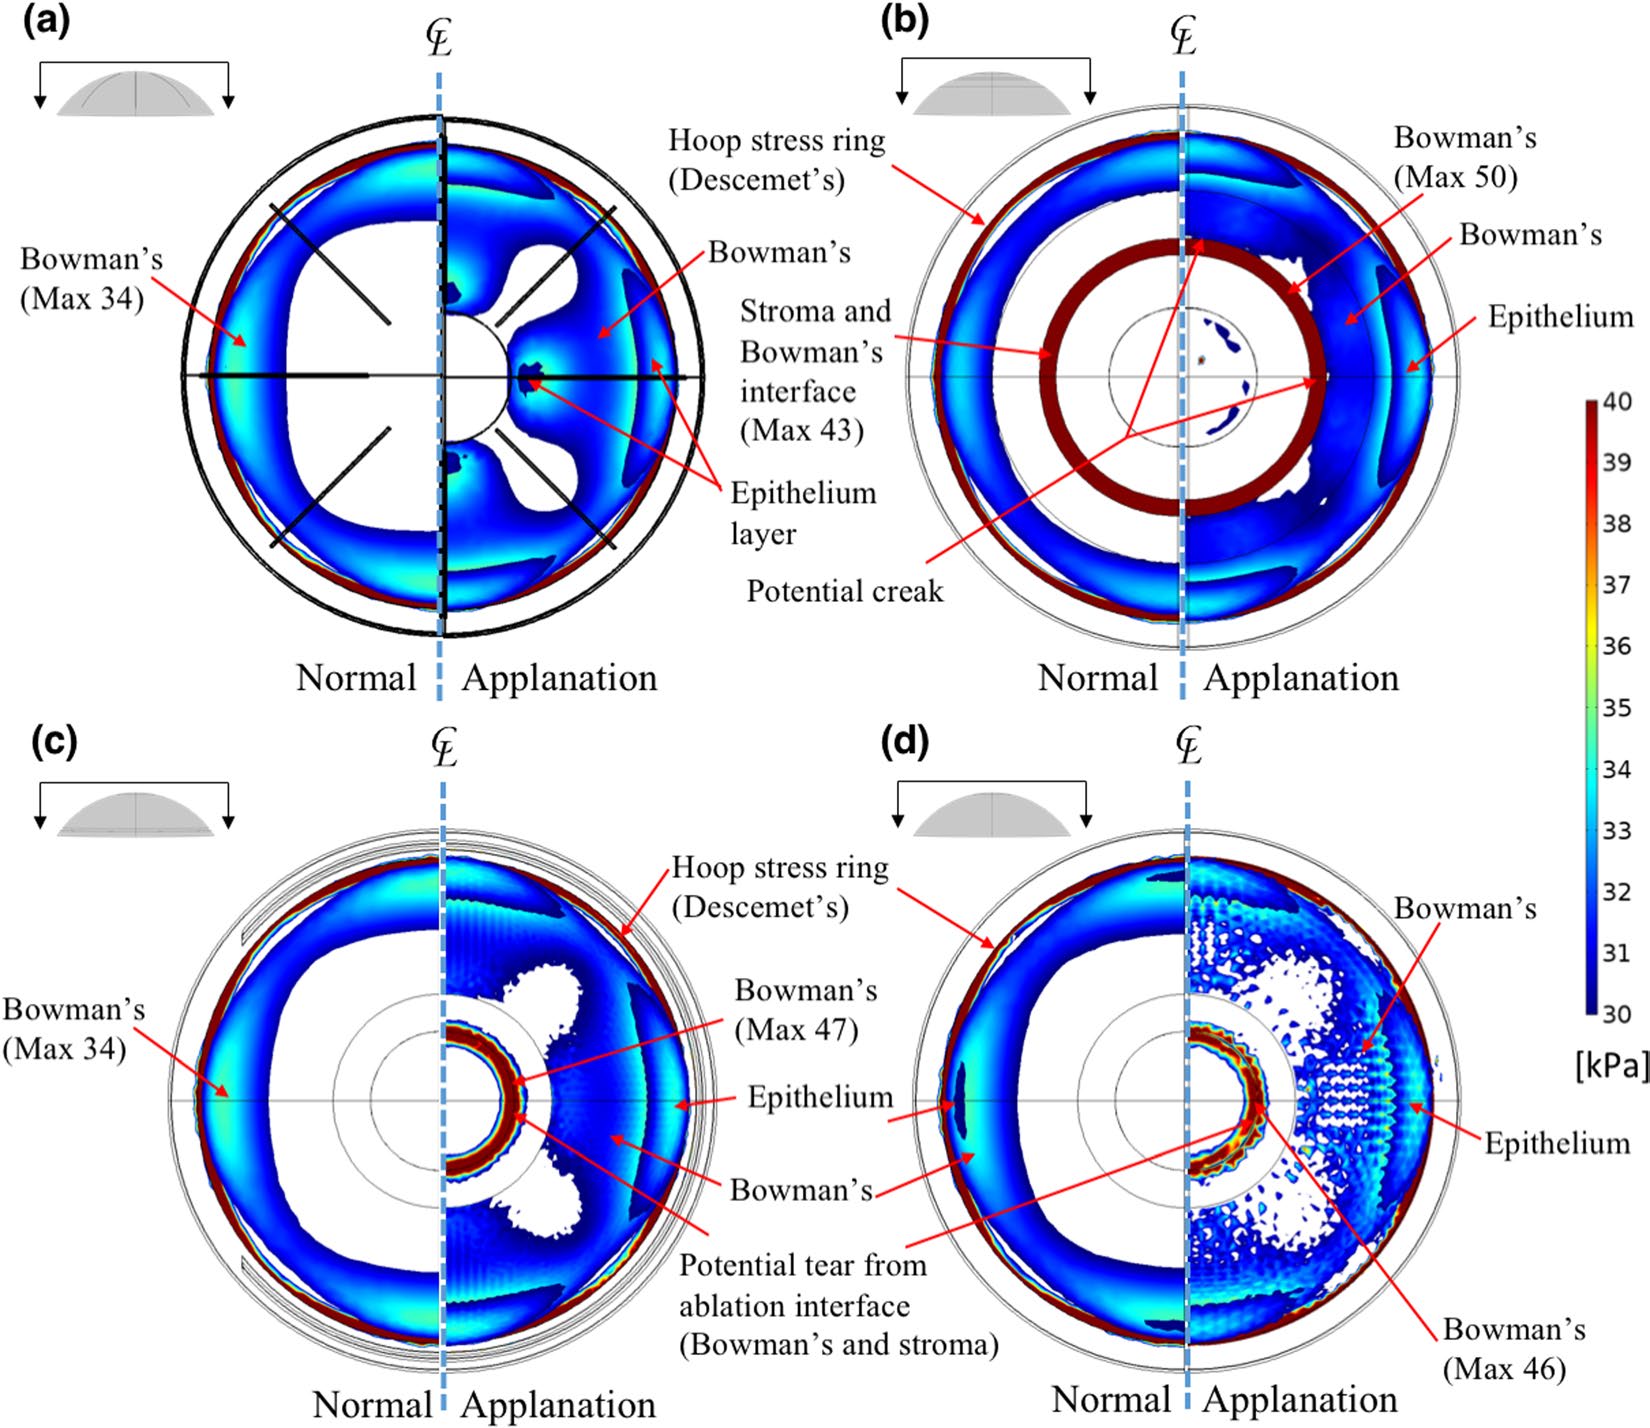
colour scales in Fig. 3 are the same and indicate FPS values exceeding 30 kPa. The PRK model was observed to have a higher FPS than the other models (i.e., FPS = 50 kPa). In the RK model, the potential creak zones may be near the incisions of the Bowman’s membrane as shown in Figures S2a. For the PRK model, potential creaks may be located near the ablated zone, as shown in Fig. 3b. For the LASIK and SMILE models, the high FPS was located in the centre of the ablated zone in the Bowman’s membrane, as shown in Figs 3c,d,S2c, and S2d. Notably, the area of stress distribution of the LASIK model was larger than that of the SMILE model because LASIK involved the creation of a corneal flap. Moreover, the RK stress pattern resembled the LASIK stress pattern because the incisions that were parallel to I–S and N–T directions had little influence on breaking stress and the incisions at 45° exerted effects on the small stress zones.
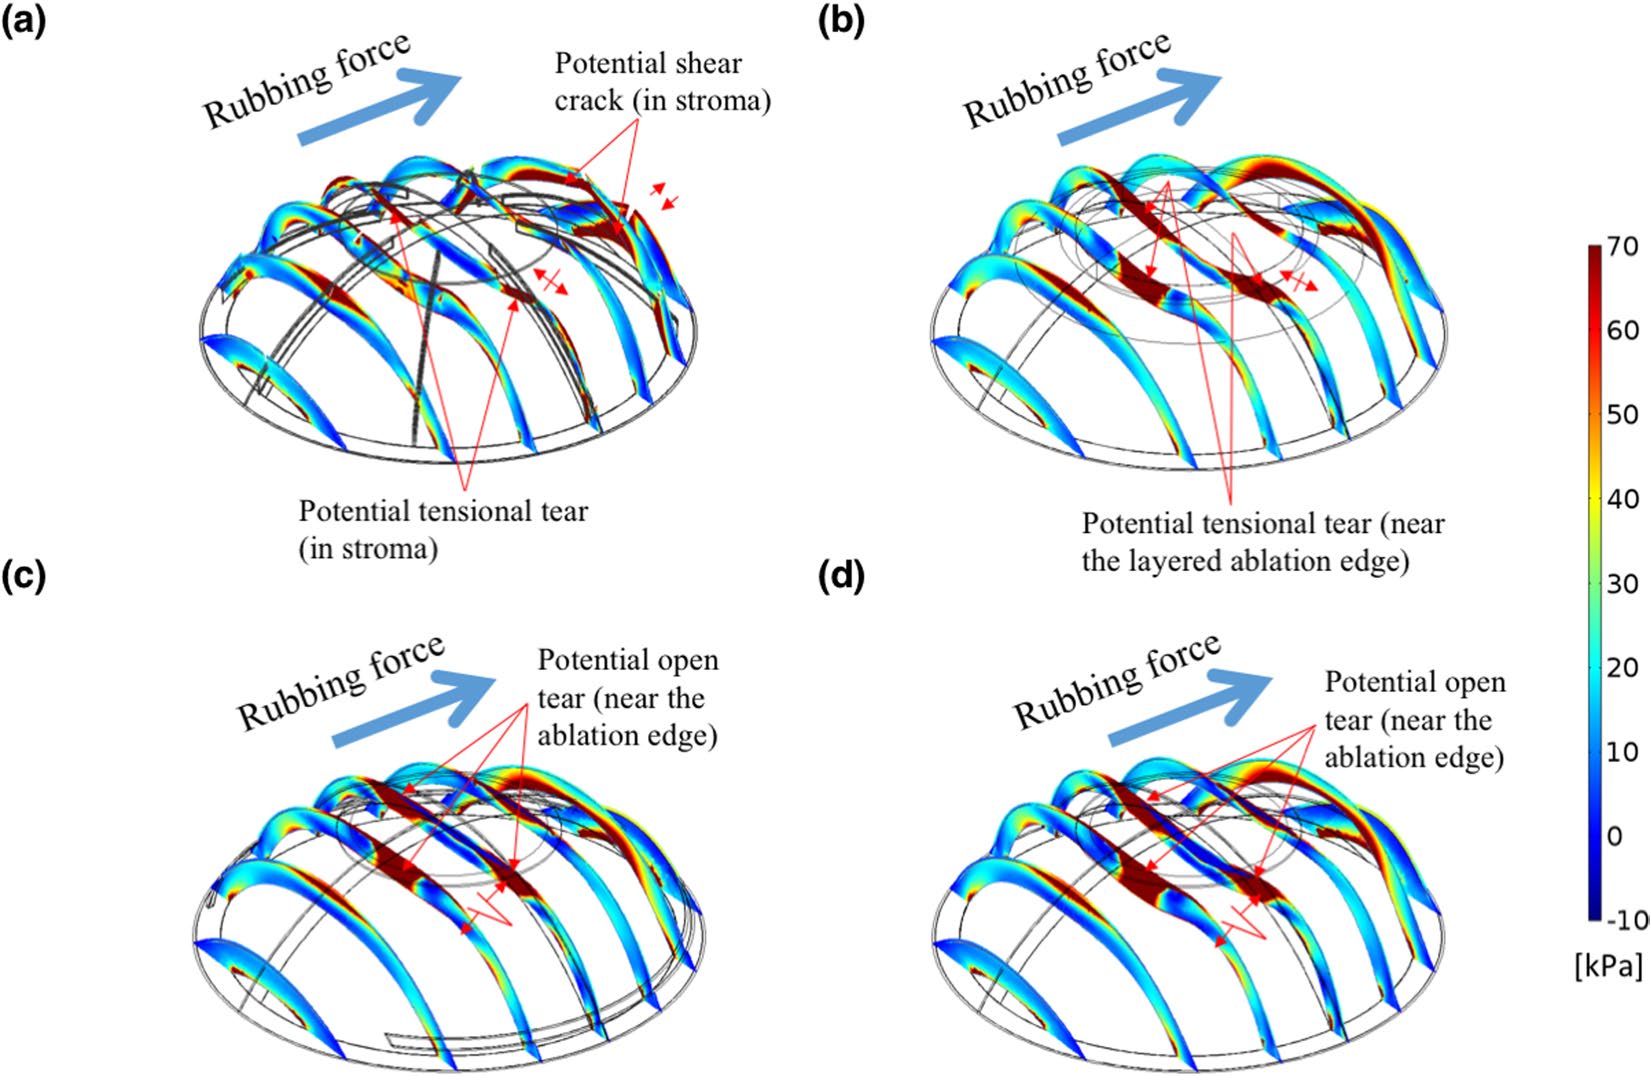
The corneal FPS generated by surface traction was applied to simulate these surgery models under rubbing condition. Normal and shear stresses are simply traction vector components, and they are applied to the corneal surface45. In the simulation, a normal force of 0.122 N and a shear force of 0.08 N were applied. The area of this traction was 22.9 mm2 (5.4 mm in diameter), and the given IOP was 31 mmHg. Figure 4 presents the FPS distri- bution in seven slice sections of the corneas and visualisations of the deformation in these four models. According to the numerical results, the rubbing force increased the corneal FPS values by more than 2.5 times. High FPS areas were observed in the peripheral cornea in the direction of eye rubbing (right side). For RK, a high FPS resulted in a greater deformation around the peripheral incisional ends, as observed on the right side of the model (Fig. 4a). For PRK, LASIK, and SMILE, the highest FPS areas were found around the ablation and extraction areas because the rubbing force reduced the stresses in the central cornea (Fig. 4b–d). Figures S3,S4 and S5 provide the
Detailed Stress Distributions Of Σr, Σφ, And Σφ
r , which clarify the crack and tear patterns in terms of opening tear, tensional tear, and shear style, respectively. Simulated intraocular pressures for different refractive surgeries.
Our Models Could Be Applied To
estimate the difference between an actual IOP and a measured IOP associated with myopia corrections of differ- ent D levels. By definition, the actual IOP equals the applanation pressure (IOPa), according to the Goldmann applanation principle46. For the correction of postoperative IOP measurement by air-puff or Goldmann tonome- ter, a general equation depending on the corneal thickness is given:
∗
.
, Where
CCT is the central corneal thickness47. However, this equation is not appropriate for eyes that have undergone refractive surgical procedures because the uniformity of the corneal thickness and the properties of corneal mate- rial are different from those of eyes without surgery. In the current study, we attempted to determine the IOPa based on our FEM models and the Goldmann applanation principle. Figure 5a presents a flowchart for the esti- mation of the IOPa, and the IOPa is adjusted to satisfy the force balance with the IOP in a recursive calculation Figure 1. Simulated displacements in corneal shape on the surface resulting from the four refractive surgical procedures at a normal IOP of 15 mmHg. The dark-red areas involve maximum displacements (>0.5 mm) outwards (body expansion), and the dark-blue areas involve zero displacement near the constrained boundary of the models. The “preoperative surface” is displacement of the normal cornea (from Fig. 10a). (a) RK: maximum displacements located at middle incisions; (b) PRK: maximum displacement at central cornea; and (c) LASIK and (d) SMILE: maximum displacements located around the central cornea (Unit: mm).
4
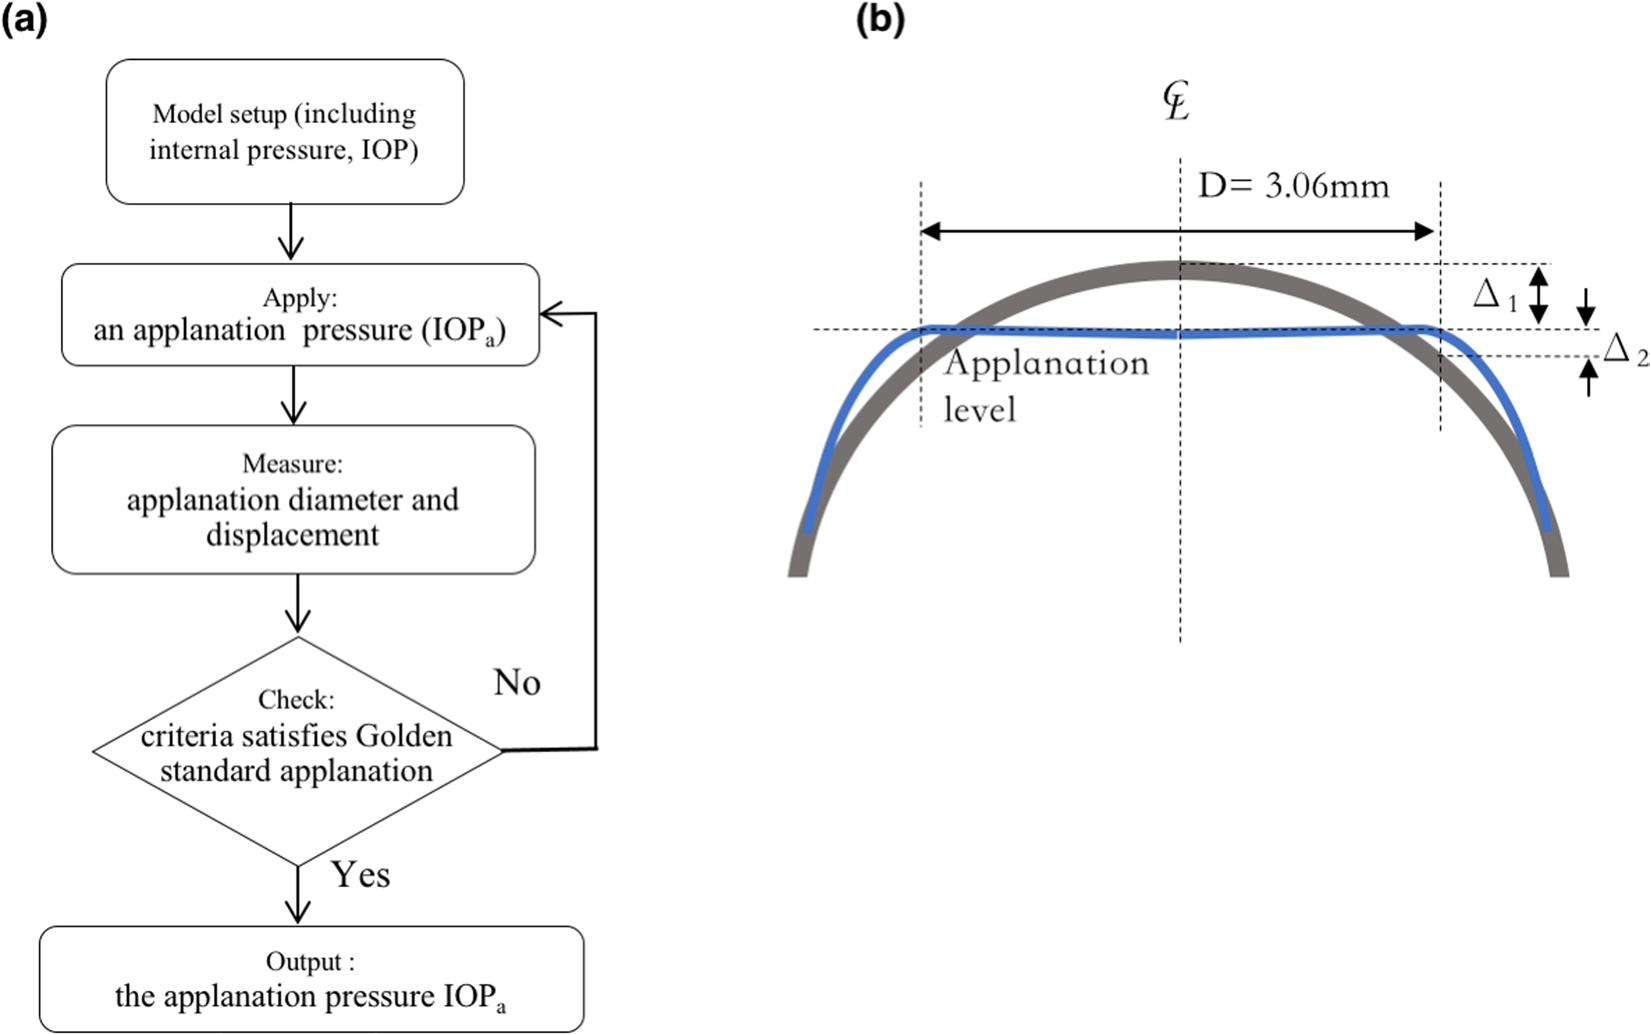
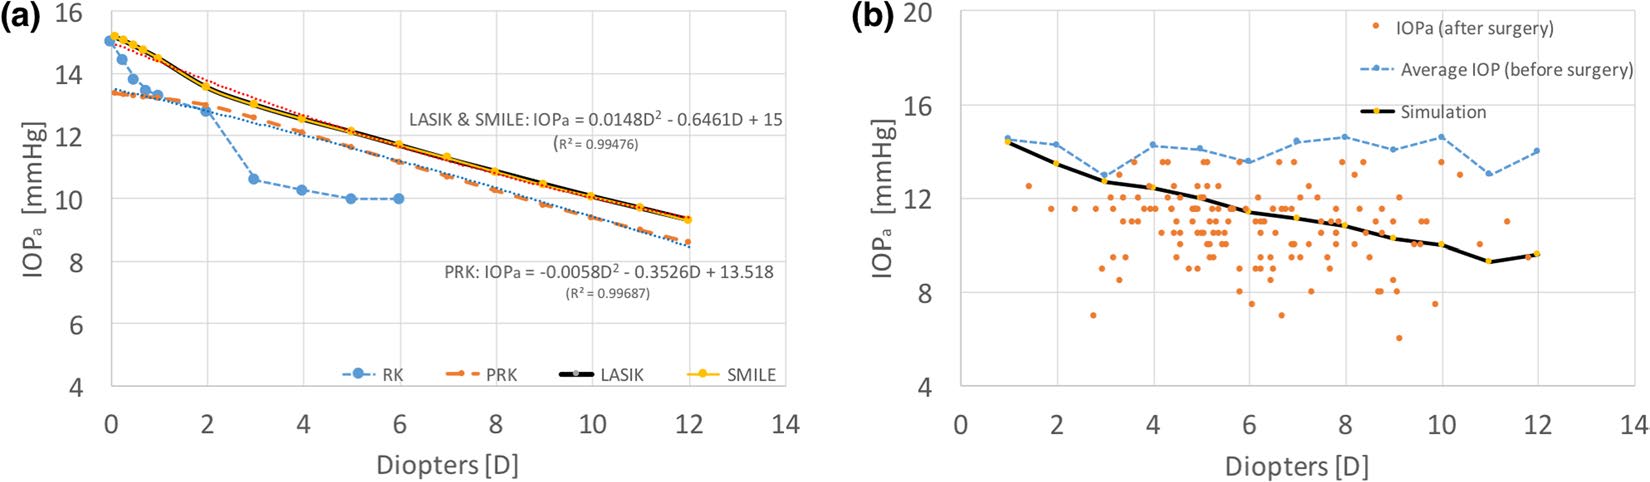
process48. The criterion of the flowchart is that the sum of the scalar displacements at the central point (Δ1 down- ward) and at the edge of the applanation (Δ2 upward) must equal the total height measured from this edge of the applanation to the top central point, as shown in Fig. 5b. Figure 6a illustrates the IOPa curves associated with varying D values at an actual IOP (inside) of 15 mmHg. The post-RK cornea was too soft and easily became flat- tened; hence, the IOPa decreased rapidly and no IOPa could be obtained when myopia of more than 6D was cor- rected. The trend equation for PRK is IOPa = 13.518–0.3526 * D−0.0058 * D2 and the IOP(mmHg)=IOPa + 1.48 2 + 0.3526 * D + 0.0058 * D2. Accordingly, substituting D = 0 into the first equation yielded an IOPa value of 13.518 mmHg; this indicates that PRK reduced the measured IOP by approximately 1.5 mmHg (15– 13.518 = 1.482) initially because the remodelling effect of the Bowman’s membrane in PRK broke the stress con- tinuity at the central cornea. The linear term ‘−0.3526*D’ indicates that the decreasing slope is approximately −0.3526 (assuming that ‘0.0058 *D2’ is small), and this result is less than 0.6, which is the slope of IOPpach (0.05 * 12 μm/D = 0.6/D). The low slope might be attributed to the lack of stiffness of the Bowman’s membrane after PRK. The trends for the LASIK and SMILE models were similar, and the fitting equation is IOPa = 15–0.646 1 * D + 0.0148*D2. Thus, IOP (mmHg) = IOPa + 0.6461 * D − 0.0148*D2. Comparing the intercepts in the LASIK and SMILE models with that in the PRK model, we found that the Bowman’s membrane conforms to a bending rigidity and provides constant and enduring rigidity to oppose the applanation force. We applied the LASIK fit- ting equation and validated our model with the actual and simulated IOPa values from 150 patients who under- went LASIK surgery, as shown in Fig. 6b; these values agreed with our model. However, we did not have any IOPa data from RK, PRK, and SMILE patients because these cohorts were not present in our hospital.
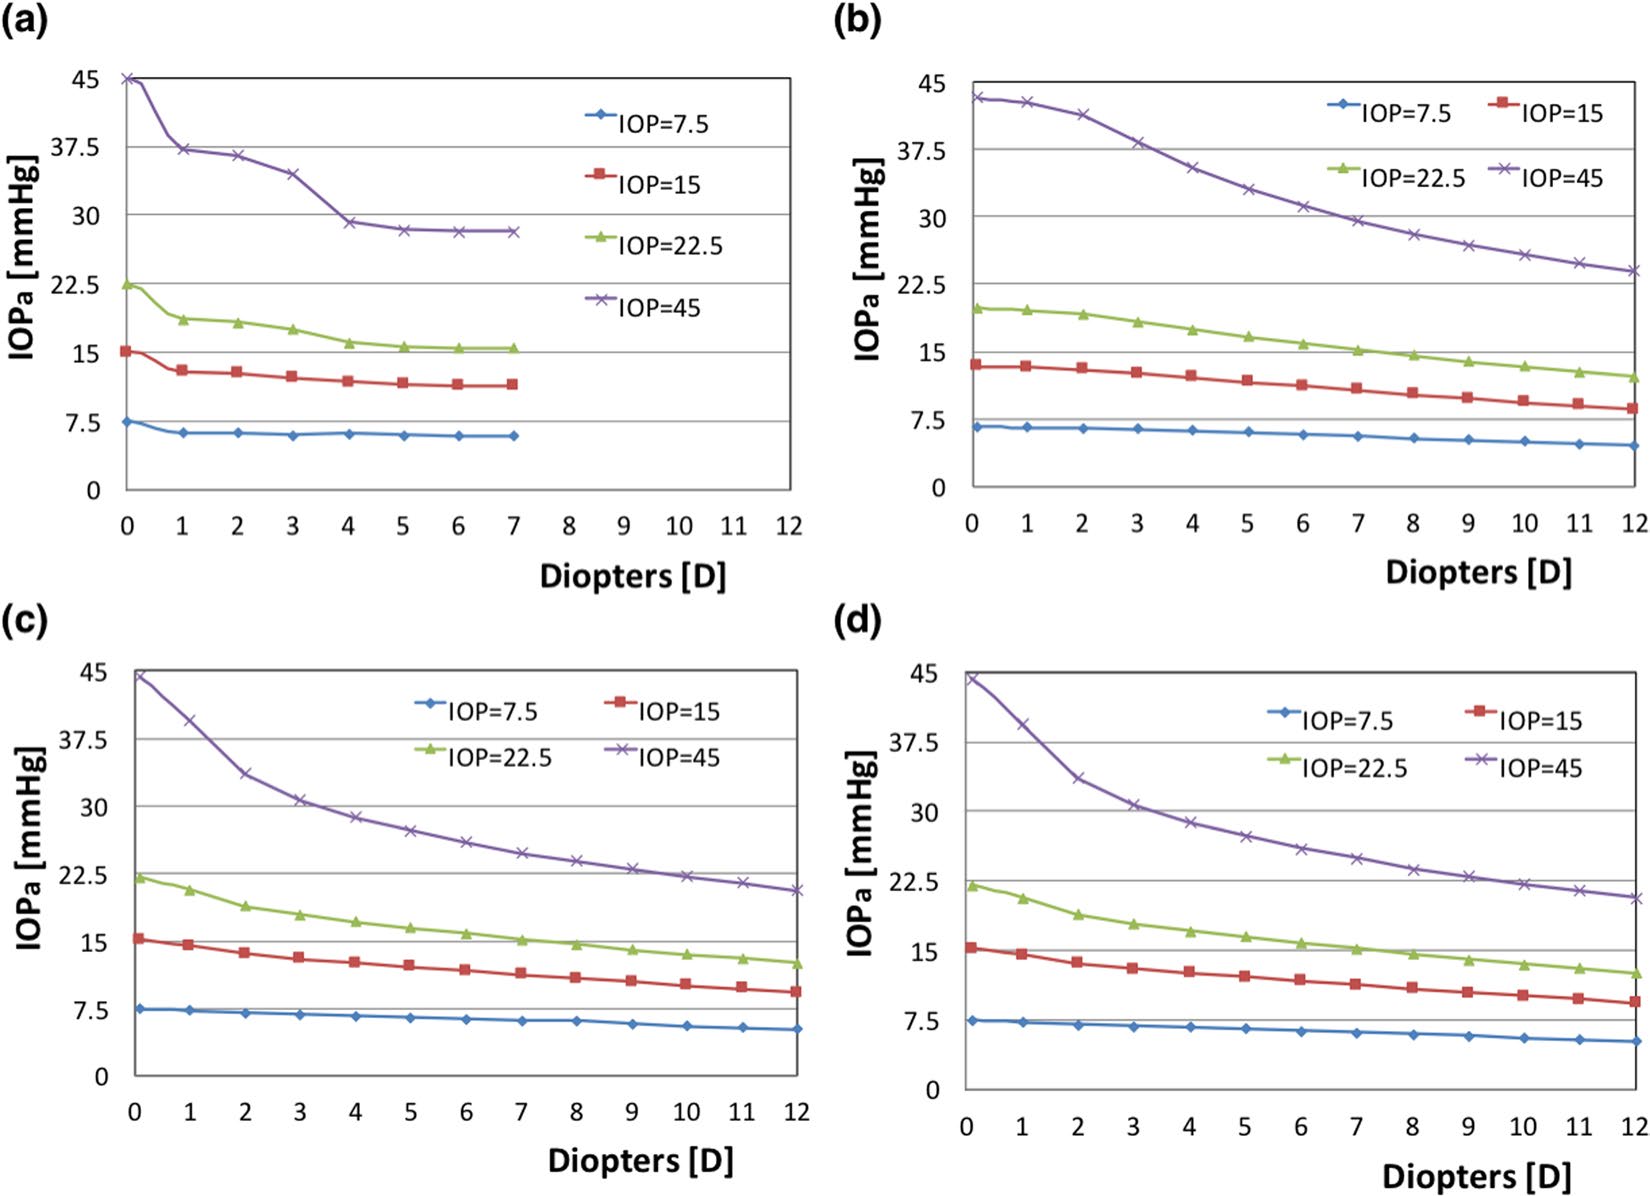
Limitations of the FEM models. The equilibrium condition of our models based on the Goldmann’s applanation principle was not satisfied at very low and very high IOPs. Under these two conditions, the observed IOPa became less positively correlated with the actual IOP. Figure 7 shows the relationship between the corrected D and IOPa under various IOP conditions, with the actual IOP values inside being assumed to be 7.5, 15, 22.5, and 45 mmHg. The curve corresponding to the low IOP value (7.5 mmHg) demonstrates a nearly constant IOPa in these models, indicating the rigidity of the structural system providing a considerably greater opposing force than the force obtained from the actual IOP14. By contrast, a high IOP could bend the peripheral cornea outwards and flatten the central cornea, resulting in a low IOPa upon applanation. In all models, the three curves associated with the IOP values of 7.5, 15, and 22.5 mmHg reveal similar trends, but in the RK model, the force balance upon applanation cannot be obtained when the myopia correction is greater than 7D. Furthermore, when the IOP was 45 mmHg, the midperipheral cornea deformed more outwardly and the applanation pressure only bent the Figure 2. Hoop stress distribution, σφ, represents circumferential tension in the tangential direction along the cornea, on the N–T slices of the corneas of the four models under normal (left) and applanation (right) conditions. (a) RK: the zone with the negative stress is the compression zone located around the middle of the incision; (b) PRK: the highest tension is near the edge of the ablation and the central bottom area; (c) LASIK: the highest stresses are near the edge of ablation (the compression zone is found on the top surface of the ablation, and the zone with the highest tension is near the ablation edge); (d) SMILE: the potential ectasia zone is the same as that of LASIK (value of the legend shows tension; unit: kPa).
5
ablated cornea in the LASIK and the SMILE models. Thus, the soft cornea after ablation had a low IOPa, which resulted in a large reduction in the measured IOP. In addition, the outer corneal radius was assumed to be 7.4 mm without applying any IOP, and when the IOP was increased in these models, the eyeball inflated, thus changing the central corneal radius. In the proposed model, we assumed this radial change was too small and could be neglected (approximately 0.295 mm, which was approximately 2% of the diameter; that small radial change had a negligible effect on the stress distribution). However, because of this assumption, the central cornea became slightly steeper (reducing radius), which resulted in an increase of the applanation depth (approximately 28%), as shown in Figure S6a.
Discussion
To maintain the corneal shape with or without refractive surgical procedures, the Bowman membrane and Descemet’s membrane provide the major bending rigidity, and they resist bending stresses to prevent concave and convex deformations upon applanation, during which the stresses are transferred from the Bowman’s mem- brane to the Descemet’s membrane before and after applanation. High FPS areas were found around the incisions produced by RK (Figure S2a), and the stress concentrations resulted in small cracks when the applied stress increased. In the PRK model, the stress concentration was at the superficial stroma and the ablated edge of the Bowman’s membrane (Fig. 3b), and the central cornea was displaced outwards, as shown in Fig. 1b. In the LASIK and the SMILE models, the ablations and extraction in the stromal layer did not break the stress continuity in the Bowman’s membrane, and this is advantageous for these models. However, their potential creak zones were at the edge of the ablation around the Bowman’s membrane, as shown in Fig. 3c and d. Tensional stresses were concen- trated on the RK incisions around Descemet’s membrane upon eye rubbing. By contrast, the other three models showed stress concentrations near the ablation around the Bowman’s membrane (Fig. 4).
As mentioned, the most crucial structure to maintain the corneal shape and to resist stress is the Bowman’s membrane. For the cornea, we investigated the axial rigidity, which refers to the major resistance of a mate- rial against tensile deformation. Mathematically, we could further multiply the Young’s moduli (E) with the Figure 3. High FPS areas (top view showing FPS >30 kPa) of the four models without (left) and with (right) applanation conditions. (a) RK: the zones with the highest stress are associated with the directions of fibres and incisions; (b) PRK: the potential creak zone is near the edges of ablation; (c) LASIK: the potential creak zone is near the edge of ablation and 45° cracks in radial directions; (d) SMILE: the potential creak zone is the same as that of LASIK but the maximum stress is less than that in LASIK (unit: kPa).
6
thicknesses (h) of the Bowman’s membrane, stromal layer, and Descemet’s membrane, and the corresponding the axial stiffness (Eh) values could be derived to be 5.15, 61.44, and 2.34 [Nt/m], respectively, for a unit width at IOP = 15 and the stromal E is estimated by 128 [kPa] (0.3 times of the Bowman’s membrane28). These results indicate that the stromal layer contributed the major rigidity (i.e., approximately 89.1% of the axial rigidity).
Figure 4. FPS on seven slices of the four models subjected to a certain rubbing force. (a) FPS in the RK model, showing the potential fractures occurring at the bottom of the incision with a tensional concentration; (b) FPS in the PRK model, showing the zone of the potentially tensional tear surrounding the ablation; (c) FPS in the LASIK model and (d) FPS in the SMILE model. (c,d) Indicate the high stresses found around the midperipheral cornea and potentially opening creak zones surrounding the ablation.
Figure 5. (a) Flowchart for the calculation of the IOPa and (b) criteria of the applanation in the numerical calculation.
7
Numerical validation of the inflation test was shown in Figure S7a. We further investigated the bending rigidity, which is the resistance of a material against bending deformation49. The area moment of inertia is the geometrical property of an area associated with the rotation of an object with stiffness50. We calculated the area moments of inertia (I = bh3/12 + bh * y2 where y is the distance from the inner side of the cornea and b = 1) of the Bowman’s membrane, stromal layer, and Descemet’s membrane, and the calculated values were 2.976 × 10⁻¹², 3.97 × 10⁻¹¹, and 5.76 × 10⁻¹⁶[m4], respectively. The neutral axial was assumed to pass through the inner side of the cor- nea for the applanation condition. In addition, the bending rigidities (EI) were 1.28 × 10⁻⁶, 5.08 × 10⁻⁶, and 1.12 × 10⁻¹⁰[Nt-m2] respectively; these results also indicate that the Bowman’s membrane and Descemet’s mem- brane, as a pair of forces, provided approximately 20% of the rigidity against bending, despite their extremely small thicknesses. A numerical validation of the bending test is illustrated in Figure S7b. Figure S7a plots the stress-strain curves of our models, which were compatible with Elsheikh’s findings15.
Refractive surgical procedures change the corneal geometry and integrity, break the stress continuity of the corneal structural system, and alter the original equilibrium upon applanation, according to the Goldmann appla- nation principle. Figure 8 depicts the principle stress directions and free-body diagrams of corneas subjected to PRK and LASIK under applanation conditions; the stresses were obtained from the models in Fig. 2b and c. The Figure 6. (a) Applanation pressure, IOPa, associated with myopia corrections of different D levels in the four models at an actual IOP of 15 mmHg and (b) applanation pressure, IOPa, associated with myopia corrections of different D values from 150 subjects who had undergone LASIK surgery; myopia results were compared to those obtained from simulation with various D levels at the average IOP.
Figure 7. Applanation pressure, IOPa, associated with myopia corrections of different D levels at IOPs of 7.5, 15, 22.5, and 45 mmHg: (a) RK model, (b) PRK model, (c) LASIK model, and (d) SMILE model.
Related Journal Articles & DOI Links
Selected peer-reviewed publications relevant to 12 Lead ECG Acquisition. Click the DOI to access the full paper (may require institutional access).
-
1. Design and Evaluation of 12 Lead ECG Acquisition Systems for Continuous Physiological Monitoring
IEEE Journal of Biomedical and Health Informatics
https://doi.org/10.1109/JBHI.2020.2981234 -
2. Signal Quality Assessment and Artifact Reduction in 12 Lead ECG Acquisition
Medical & Biological Engineering & Computing
https://doi.org/10.1007/s11517-020-02145-6 -
3. Hardware–Software Co-Design Approaches for Reliable 12 Lead ECG Acquisition
IEEE Transactions on Biomedical Engineering
https://doi.org/10.1109/TBME.2019.2895762 -
4. Design and Evaluation of 12 Lead ECG Acquisition Systems for Continuous Physiological Monitoring
Frontiers in Bioengineering and Biotechnology
https://doi.org/10.3389/fbioe.2020.00123 -
5. Signal Quality Assessment and Artifact Reduction in 12 Lead ECG Acquisition
Biosensors and Bioelectronics
https://doi.org/10.1016/j.bios.2021.112345 -
6. Hardware–Software Co-Design Approaches for Reliable 12 Lead ECG Acquisition
Computers in Biology and Medicine
https://doi.org/10.1016/j.compbiomed.2021.104567 -
7. Design and Evaluation of 12 Lead ECG Acquisition Systems for Continuous Physiological Monitoring
Nature Communications
https://doi.org/10.1038/s41467-020-12345-6
Why Choose Us?
Bangalore guidance for robotics, Spectre and autonomous systems projects.
Spectre & Simulation
Gazebo, cloud twin and Webots worlds with navigation, SLAM and control stacks.
Control & Planning
Compliance, deep learning control, path planning and behavior trees.
Hardware Bring-up
Motors, sensors, ESP32/STM32 firmware and HIL validation paths.
Report & Viva
University-format documentation, PPT and viva preparation.
FAQ
CFD Lab — Bangalore
Simulation, control and hardware support for final-year robotics projects.
Stacks
Worlds
Digital Twin
Control
Robots
Offline
Bring-up