1
Seamless Integration and Implementation of Distributed
Contact And Contactless Vital Sign Monitoring
Dingding Liang1,†, Yang Chen1,†,*, Jiawei Gao1, Taixia Shi1, and Jianping Yao2,* 1 Shanghai Key Laboratory of Multidimensional Information Processing, School of Communication and 2 Microwave Photonic Research Laboratory, School of Electrical Engineering and Computer Science, †These authors contributed equally to this work.
Abstract
Real-time vital sign monitoring is gaining immense significance not only in the medical field but also in personal health management. Facing the needs of different application scenarios of the smart and healthy city in the future, the low-cost, large-scale, scalable, and distributed vital sign monitoring system is of great significance. In this work, a seamlessly integrated contact and contactless vital sign monitoring system, which can simultaneously implement respiration and heartbeat monitoring, is proposed. In contact vital sign monitoring, the chest wall movement due to respiration and heartbeat is translated into changes in the optical output intensity of a fiber Bragg grating (FBG). The FBG is also an important part of radar signal generation for contactless vital sign monitoring, in which the chest wall movement is translated into phase changes of the radar de-chirped signal. By analyzing the intensity of the FBG output and phase of the radar de-chirped signal, real-time respiration and heartbeat monitoring are realized. In addition, due to the distributed structure of the system and its good integration with the wavelength-division multiplexing optical network, it can be massively scaled by employing more wavelengths. A proof-of-concept experiment is carried out. Contact and contactless respiration and heartbeat monitoring of three people are simultaneously realized. During a monitoring time of 60 s, the maximum absolute measurement errors of respiration and heartbeat rates are 1.6 respirations per minute and 2.3 beats per minute, respectively. The measurement error does not have an obvious change even when the monitoring time is decreased to 5 s.
1. Introduction
Vital signs, including respiration rate, heartbeat rate, blood pressure, body temperature, etc., are a crucial set of indicators for evaluating one’s physical state1. Abnormal respiration and heartbeat rates are often early indicators of various illnesses or health problems such as lung disease, cardiovascular disorders, and epileptic seizures2‒4. Real-time monitoring of respiration and heartbeat can facilitate early intervention, help individuals adjust their lifestyle, and improve diet and exercise habits, which are important for the health of modern humans and are receiving increasing attention. Respiration and heartbeat monitoring typically fall into two categories: contact and contactless. Conventional contact respiration or heartbeat monitoring devices, including the electrocardiograph (ECG)5, the photoplethysmography (PPG)6, the stethoscope, Chinese medicine pulse diagnosis, and the smartwatch7, face several issues. For instance, ECG and PPG require long- term placement of probes on the skin, the stethoscope and Chinese medicine pulse diagnosis methods are extremely labor-intensive, and the accuracy of heartbeat rate measurement by smartwatches needs to be improved. Camera-based and radar-based monitoring are two commonly employed contactless methods for monitoring respiration and heartbeat8‒11. Camera-based monitoring is not only sensitive to lighting conditions but also raises privacy concerns12. Radar-based monitoring transmits large-bandwidth radar signals to achieve high-precision range measurement and then uses various algorithms to extract respiration and heartbeat rates13‒16. Since the accuracy of radar-based monitoring is closely related to the radar signal bandwidth, to achieve high accuracy, it is necessary to use a large-bandwidth radar signal. Regrettably, broadband radar signal generation and processing are inherently limited by electronic bottlenecks17.
To address the limitations of conventional contact monitoring devices, a range of optical fiber sensing systems have been proposed for physical state monitoring, taking advantage of their favorable attributes such as compact size, lightweight design, and high sensitivity3,18‒20. A wearable optical fiber sensing system combines fiber Bragg grating (FBG) and a fiber laser sensor to measure multiple physiological parameters
2
of the human body21. The optical fiber sensing system has a simple structure and can monitor the physical state in real-time. In ref. 22, different respiration patterns such as exhalation and inhalation are identified accurately by a tiled FBG, whose grating planes are inclined relative to the axis of the fiber. In ref. 23, a helical long-period fiber grating sensor system is established for simultaneously monitoring respiration and heartbeat rates. The maximum absolute measurement errors of respiration and heartbeat rates of four healthy subjects are 2 respirations per minute (rpm) and 3 beats per minute (bpm), respectively. In ref. 24, an FBG-based wearable sensor is constructed with a high sensitivity to simultaneously monitor respiration and heartbeat activities. The respiration and heartbeat rates of five participants are obtained in different positions, such as standing, sitting, and supine. Compared with conventional contact respiration or heartbeat monitoring devices, fiber-grating-based contact respiration or heartbeat monitoring systems have simple structures and good monitoring accuracy, can reduce labor consumption, and are more convenient and comfortable for long-term monitoring21‒24.
In contactless respiration and heartbeat monitoring, radar-based monitoring not only achieves all-time human physiological parameters monitoring but also has stronger privacy protection than the camera-based vital sign monitoring approach25. To escape from the electronic bottlenecks, microwave photonic radar has been widely studied to generate and receive broadband radar signals26‒29. In the transmitter, high-frequency and broadband radar signals are generated by photonic frequency multiplication30,31, photonic frequency conversion32, optical injection33,34, photonic digital-to-analog converter35, or acoustic-optic frequency shifting loops36,37. In the receiver, the photonic de-chirping process is employed to convert high-frequency and broadband linearly frequency-modulated (LFM) signals into low-frequency and narrowband electrical signals26,32. At present, the research of microwave photonic radar is mainly focused on high-accuracy target ranging and imaging, and its application to vital sign monitoring is relatively rare. In 2023, a microwave photonic radar for contactless vital sign monitoring is proposed to monitor the respiration of the simulators and a cane toad37. The synthesized stepped frequency signal with a bandwidth of 10 GHz is generated by using an acoustic-optical frequency shifter, and the photonic de-chirping process is utilized to extract the respiration rate. The chest wall movements of the two breathing simulators are successfully extracted, and the corresponding respiration rates are 12 rpm and 16.5 rpm, respectively. The cross-correlation coefficient between the cane toad’s radar and camera measurements is 0.746.
In medical monitoring, contact respiration and heartbeat monitoring are more popular, but in some cases, contactless vital sign monitoring may be more suitable for patients who require long-term monitoring such as premature infants and burn patients38. In addition, contactless vital sign monitoring is more convenient and faster for some people who perform routine inspections39. Therefore, both contact and contactless vital sign monitoring play an important role. With the steady growth of population aging and the increasing awareness of physical health, large hospitals, nursing homes, and smart communities all urgently need vital sign monitoring systems to detect the vital signs of patients, the elderly, and everyone in the community, so as to quickly and accurately obtain vital sign information for different types of patients, help continuously monitor the health state of the elderly and everyone in the community, and maintain their physical health40.
Typically, contact and contactless vital sign monitoring systems are developed independently, with limited research exploring their potential for integration. However, regardless of whether it is contact, contactless, or integrated, installing a set of vital sign monitoring equipment in every consulting room and ward of the hospital, every room of the nursing home, or every family in the community is very expensive. In response to the needs of future smart and healthy cities, there is a strong desire for a technology that can integrate contact and contactless vital sign monitoring, and achieve low-cost, large-scale deployment, thereby meeting the requirements of different application scenarios, user groups, and deployment locations in the future.
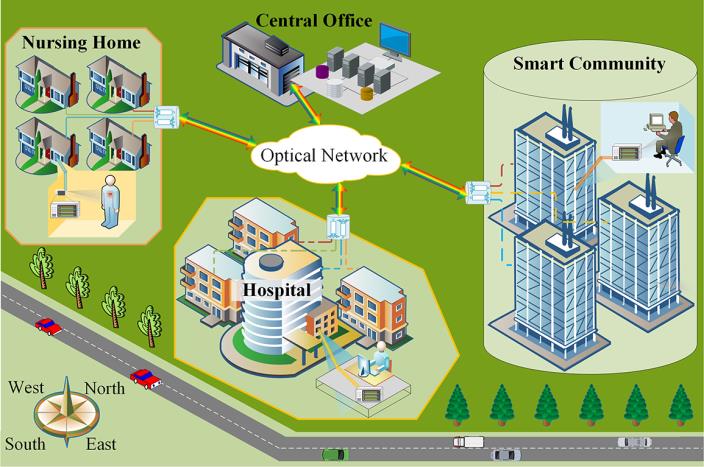
The microwave photonic technology used to realize the above-mentioned microwave photonic radar is a technique that combines microwave engineering and photonic technology to take advantage of the wide bandwidth offered by photonics for microwave signal generation and processing41‒43. It is possible to fulfill the needs by combining microwave photonic technology with the existing sophisticated wavelength-division multiplexing (WDM) optical network infrastructure and radio-over-fiber (ROF) technique44. In this article, for the first time, we propose a seamlessly integrated contact and contactless vital sign monitoring system that utilizes microwave photonics and achieves the distribution of optical vital sign monitoring signals in a WDM optical network through ROF technology, enabling simultaneous distributed respiration and heartbeat monitoring. Figure 1 shows the application scenario of the proposed vital sign monitoring system in future smart and healthy cities. Large hospitals, nursing homes, smart communities, and the central office are connected through a WDM optical network. Each user terminal of hospitals, nursing homes, and smart communities has been equipped with contact and contactless vital sign monitoring functions. The optical vital sign monitoring signal distributed in the WDM optical network is used for both contact and contactless
3
respiration and heartbeat monitoring. In contact respiration and heartbeat monitoring, the chest wall movement is translated into changes in the optical intensity of the carrier of the optical vital sign monitoring signal, via an FBG. The optical vital sign monitoring signal output by the FBG is subjected to optical filtering and an optical-to-electrical converter to generate a frequency-quadrupled LFM signal as the broadband radar signal for contactless monitoring, in which the chest wall movement is translated into phase changes of the radar de-chirped signal. By analyzing the intensity of the FBG output and phase of the radar de-chirped signal, contact and contactless respiration and heartbeat information can be obtained simultaneously. Due to the complex and expensive equipment, such as light sources and wideband radio frequency sources, being centralized at the central office, the cost for each user accessing via the WDM optical network is significantly reduced, and the number of users supported by the proposed system can be greatly expanded by increasing the number of optical wavelengths. A proof-of-concept experiment shows that contact and contactless vital sign monitoring of three people are simultaneously realized. During a monitoring time of 60 s, the maximum absolute measurement errors of respiration and heartbeat rates are 1.6 rpm and 2.3 bpm, respectively. The measurement error does not have an obvious change even when the monitoring time is decreased to 5 s.
Fig. 1 Application scenario of the vital sign monitoring in future smart and healthy cities.
2. Principle And System
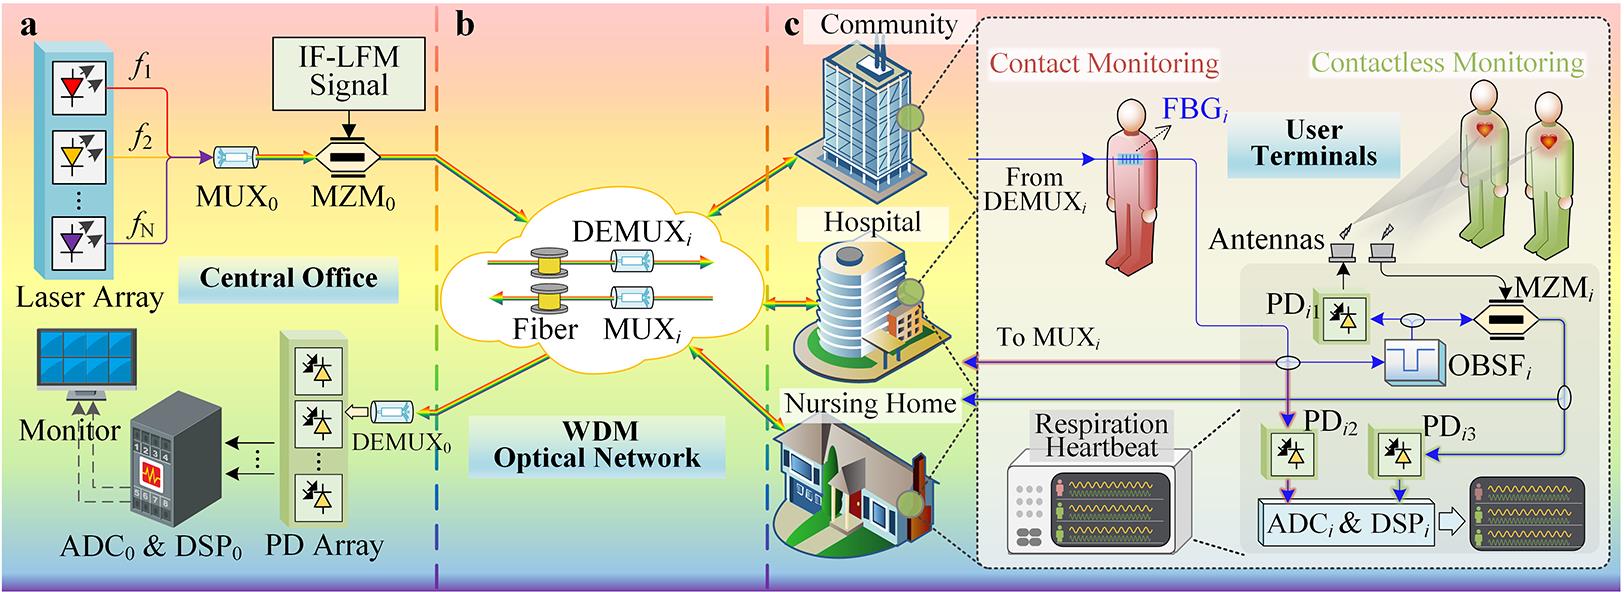
Figure 2 shows the schematic diagram of the proposed seamlessly integrated contact and contactless vital sign monitoring system with ROF assistance incorporated into a WDM optical network. The vital sign monitoring system mainly consists of a central office and multiple user terminals connected by the WDM optical network. Each user terminal is equipped with one or both functions of FBG-based contact respiration and heartbeat monitoring and radar-based contactless respiration and heartbeat monitoring. Different respiration and heartbeat monitoring methods can be selected according to the application scenario and the user state.
Fig. 2 Schematic diagram of the proposed seamlessly integrated contact and contactless vital sign monitoring system with ROF assistance incorporated in a WDM optical network. a Central office. b WDM optical network. c User terminals. MUX optical multiplexer, MZM Mach–Zehnder modulator, DEMUX optical demultiplexer, FBG fiber Bragg grating, OBSF optical band-stop filter, PD photodetector, ADC analog-to-digital converter, DSP digital signal processing.
4
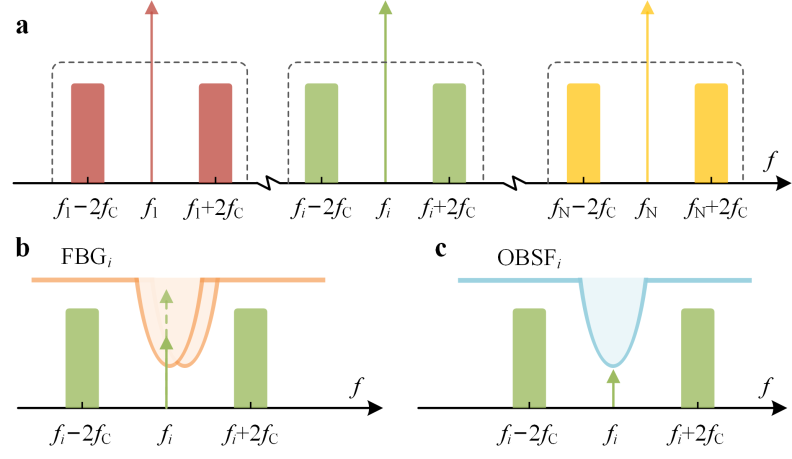
In the central office, as shown in Fig. 2a, multiple optical carriers (f1, f2, ∙∙∙, fN), in accordance with ITU WDM wavelength standards, are generated from a laser array and then injected into a Mach–Zehnder modulator (MZM0) after wavelength multiplexing in an optical multiplexer (MUX0). In MZM0, each optical carrier is modulated independently by an intermediate frequency (IF)-LFM signal. The instantaneous frequency of the IF-LFM signal is denoted as fIF(t) = fC ‒ 0.5fB + kt, where fC, fB, and k are the center frequency, bandwidth, and chirp rate of the IF-LFM signal, respectively. MZM0 is biased at the maximum transmission point (MATP) so that each optical carrier is modulated to produce only the even-order optical sidebands of the IF-LFM signal. Under the small-signal modulation condition, only the original optical carriers and their ±2nd-order optical sidebands are taken into consideration, as displayed in Fig. 3a. The multiple optical carriers after modulation in MZM0 are transmitted in an optical fiber to different operational locations, such as hospitals, nursing homes, and smart communities. In each operational location, an optical demultiplexer (DEMUX) is used to separate the different WDM channels, as shown in Fig. 2b. Based on the specific requirements of each user terminal for respiration and heartbeat monitoring, one or more wavelengths are transmitted to the user terminal through short optical fibers. The user terminal can be a consulting room or ward in a hospital, a bedroom or activity room in a nursing home, or a house or apartment in a smart community. After this short-distance fiber distribution, at least one optical carrier centered at fi and its two ±2nd-order optical sidebands fi ± (2fC ‒ fB + 2kt) are deployed in one user terminal.
Fig. 3 Diagrams of key nodes in the proposed vital sign monitoring system. a Optical spectrum of the IF-LFM-modulated signal from MZM0. b Optical spectrum of FBGi output signal. c Optical spectrum of OBSFi output signal. In a user terminal, as shown in Fig. 2c, the assigned optical wavelength from DEMUXi, as well as its two optical sidebands, is connected to FBGi, which is used as a contact sensor and taped to the human chest to measure respiration and heartbeat. To implement contact monitoring, the optical carrier is placed at a falling edge of FBGi transmission notch, as illustrated in Fig. 3b. The chest wall movement caused by respiration and heartbeat introduces the Bragg wavelength shift of FBGi. Note that FBGi used here should have a narrow transmission notch, which should be no more than 2fC. In this way, only the optical carrier is within the transmission notch, while the two 2nd-order optical sidebands of the IF-LFM signal are outside the transmission notch. Under these circumstances, the Bragg wavelength shift introduced by the chest wall movement will directly affect the intensity of the optical signal passing through FBGi. Then, one part of the optical signal passing through FBGi is converted into an electrical signal in a low-speed photodetector (PDi2) to monitor the optical signal intensity that is changed with respiration and heartbeat. By processing the electrical signal from PDi2, one’s respiration and heartbeat rates can be obtained. At the same time, another part of the optical signal can be transmitted back to the central office via the WDM optical network, so that the optical signal carrying the respiration and heartbeat information from different user terminals can also be processed and monitored centrally.
The last part of the optical signal from FBGi is sent to an optical band-stop filter (OBSFi) to suppress the optical carrier, as shown in Fig. 3c. To reduce the cost, the OBSFi can also be a narrowband FBG. The optical signal from the OBSFi with carrier suppressed is split into two parts: One part is beaten in a high-speed PDi1 to generate a frequency-quadrupled LFM signal; The other part is used as an optical reference for radar de- chirping. The instantaneous frequency of the generated frequency-quadrupled LFM signal is expressed as fT(t) = 4fC ‒ 2fB + 4kt. The LFM signal is sent to the free space through an antenna to achieve contactless vital sign monitoring. The echo signal reflected by the human chest is collected by the receiving antenna with a time delay ∆τ = 2(R0 + x(t))/c, where R0 is the range between the radar antenna and the center of the human
5
chest, x(t) is the chest wall movement produced by respiration and heartbeat, and c is the speed of light. The echo signal is sent to MZMi, which is biased at the quadrature transmission point (QTP) and modulates the optical reference from the OBSFi. The optical signal after modulation is beaten in another low-speed PDi3 to generate the radar de-chirped signal in the user terminal or transmitted to the center station after fiber distribution. The de-chirped signal can be expressed as EIF(t) ≈ E0cos(8πk∙∆τ∙t + 4π(R0 + x(t))/λc), where λc = c/(4fC ‒ 2fB), E0 is the amplitude of the de-chirped signal. The frequency and phase of the de-chirped signal are denoted as fIF ≈ 4k∆τ and φIF = 4π(R0 + x(t))/λc. As can be seen, the chest wall movement of the human body is converted into phase changes of the radar de-chirped signal that can be written as ∆φIF = 4π∙∆x(t)/λc.
Therefore, the human’s position can be determined by the frequency of the de-chirped signal, and the respiration and heartbeat information can be extracted from the phase of the radar de-chirped signal.
3.1 Experimental Setup
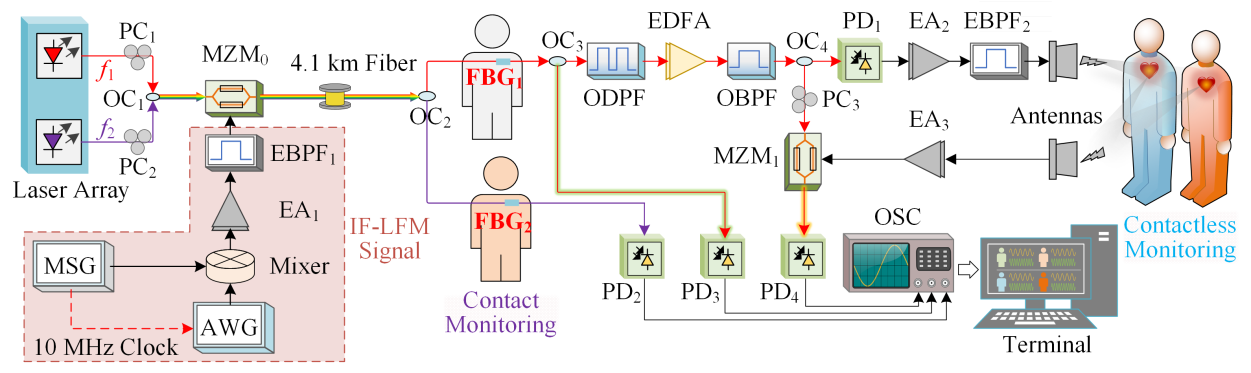
To demonstrate the proposed seamlessly integrated contact and contactless vital sign monitoring system, a proof-of-concept experiment is carried out based on the setup shown in Fig. 4. Two wavelengths are employed in the experiment: One for contact respiration and heartbeat monitoring and the other for simultaneous contact and contactless respiration and heartbeat monitoring. Two continuous-wave (CW) laser sources (ID Photonics, CoBriteDX1-1-C-H01-FA and CoBriteDX1-1-HC1-FA) centered at 1549.36 nm and 1549.92 nm, respectively, are employed. Due to the accuracy of FBG fabrication, in the proof-of-concept experiment, the optical wavelengths we selected do not strictly conform to the optical wavelength and wavelength spacing of ITU WDM standard, but it will not affect the verification of the method and concept in Fig. 2 through this experiment. The two optical wavelengths are combined in an optical coupler (OC1) after passing through two polarization controllers (PC1 and PC2), which are utilized to adjust their polarization states. Here, the function of OC1 is similar to that of the MUX in Fig. 2. Since there is a lack of suitable MUX in the laboratory, OC1 is used as a substitute. The combined optical signal from OC1 is injected into MZM0 (Fujitsu FTM7938EZ). MZM0 is driven by an IF-LFM signal with a 6.6-GHz center frequency and a 1-GHz bandwidth. The IF-LFM signal is generated from a microwave up-conversion module, which includes an arbitrary waveform generator (AWG, Keysight M8190A), a microwave signal source (MSG, Agilent 83752B), a mixer (MITEQ M30), EA1 (CTT ALM/145-5023-293), and EBPF1 (KGL YA353-2).
The optical signal after modulation in MZM0 is transmitted through a 4.1-km optical fiber and then divided into two parts by OC2. Here, the function of OC2 is expected to be similar to that of the DEMUX in Fig. 2. Since OC2 does not have the filtering and wavelength selection functions of the DEMUX, when the optical signal from it is used to generate radar signals for subsequent contactless respiration and heartbeat monitoring, an additional optical filter is required to select the corresponding wavelength. Nevertheless, for contact respiration and heartbeat monitoring, filtering is not necessary because FBG only operates on its corresponding wavelength.
Fig. 4 Experimental setup of the contact and contactless vital sign monitoring system. PC polarization controller, OC optical coupler, MZM Mach–Zehnder modulator, EBPF electrical band-pass filter, EA electrical amplifier, MSG microwave signal generator, AWG arbitrary waveform generator, FBG fiber Bragg grating, ODPF optical dual-passband filter, EDFA erbium-doped fiber amplifier, OBPF optical band-pass filter, PD photodetector, OSC oscilloscope.
The two outputs of OC2 are sent to FBG1 and FBG2, which are two contact sensors and attached to the human chest for contact respiration and heartbeat monitoring. The transmission outputs of the two FBGs are detected in two low-speed PDs (PD2 and PD3, Beijing Lightsensing Technologies Ltd. BLPD-PFA1-60BR- W7) to convert the optical power change to the electrical domain. By analyzing the power of the FBG output,
6
the respiration and heartbeat monitoring of two people can be achieved at the same time. The output of FBG1 is divided into two parts by OC3: One part is used for the aforementioned contact respiration and heartbeat monitoring; The other part is used for subsequent contactless respiration and heartbeat monitoring.
The optical signal for contactless respiration and heartbeat monitoring from OC3 is connected to an optical dual-passband filter (ODPF, Finisar WaveShaper 4000A). The ODPF not only functions as the DEMUX in Fig. 2 to select the corresponding WDM channel but also serves as the OBSF in Fig. 2 to suppress the optical carrier. Therefore, the ±2nd-order optical sidebands with frequencies of f1 ± (2fC ‒ fB + 2kt) are output by the ODPF, which is then amplified by an erbium-doped fiber amplifier (EDFA, Amonics AEDFA-PA-35-B-FA) with a small signal gain of 35 dB. The amplified optical signal is sent to an optical band-pass filter (OBPF, EXFO XTM-50) to suppress the amplified spontaneous emission (ASE) noise. The output optical signal from the OBPF is split into two paths by OC4: One output of OC4 is injected into MZM1 (Fujitsu FTM7938EZ) as an optical reference for radar de-chirping; The other output of the OC4 is connected to high-speed PD1 (u2t MPRV1331A), where the two ±2nd-order optical sidebands beat each other to generate the frequency- quadrupled LFM signal from 24.4 GHz to 28.4 GHz. EA2 (CENTELLAX OA4MVM2) and EBPF2 (Shanghai AT Microwave AT-BPF-2432) are used to boost the signal power and suppress the interference and noise. Then the frequency-quadrupled LFM signal is radiated through a transmitting antenna for contactless respiration and heartbeat monitoring. The echo signal reflected by the human chest is collected through a receiving antenna and then amplified by EA3 (CENTELLAX OA4MVM3) with a gain of 27 dB.
The optical reference is modulated by the amplified echo signal at MZM1. After detection in low-speed PD4 (Nortel PP-10G), microwave photonic de-chirping is implemented. The radar de-chirped signal from PD4 and the aforementioned electrical signals from PD2 and PD3 are sampled by a real-time oscilloscope (OSC, Rohde & Schwarz RTO2032). By analyzing the phase of the radar de-chirped signal in Matlab, contactless respiration and heartbeat monitoring for multiple people can be achieved simultaneously.
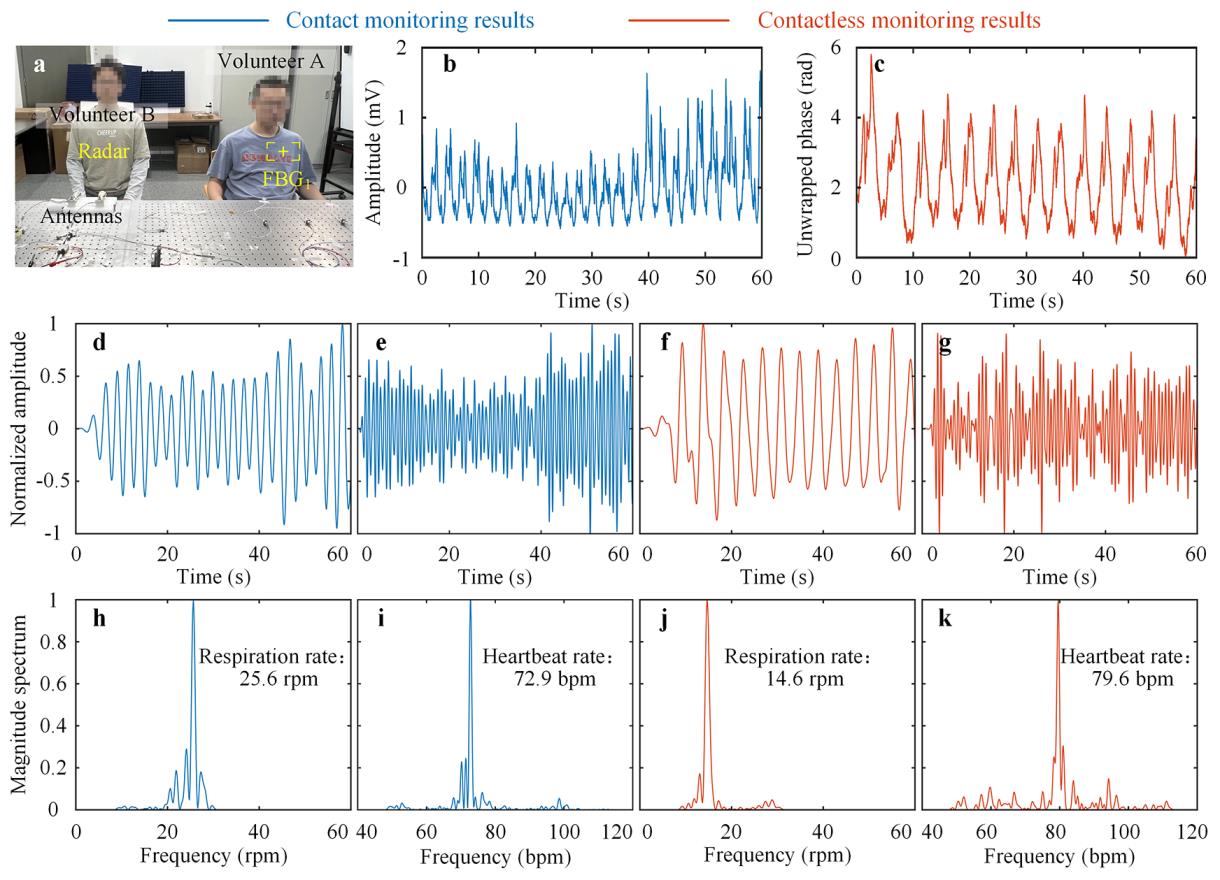
3.2 Simultaneously contact and contactless vital sign monitoring using one channel Fig. 5 Results of simultaneous contact and contactless vital sign monitoring using one channel. a Two volunteers for contact and contactless vital sign monitoring. b FBG-based contact respiration and heartbeat signal from PD3. c Radar-based contactless respiration and heartbeat signal from PD4 after using arctangent demodulation algorithm. d and h Contact respiration waveform and spectrum. e and i Contact heartbeat waveform and spectrum. f and j Contactless respiration waveform and spectrum. g and k Contactless heartbeat waveform and spectrum.
7
Figure 5a shows a photograph of the respiration and heartbeat monitoring experiment. In this experiment, only the channel corresponding to 1549.36 nm is used for both contact and contactless vital sign monitoring. Two volunteers are invited: One for contact monitoring and the other for contactless monitoring. FBG1 is pasted on the chest of Volunteer A, and Volunteer B is 0.88 m away from the radar transmitting antenna. As the chest wall movements stretch and compress FBG1, the shifts in the Bragg wavelength are translated into variations in the optical intensity of the FBG1 output, which is measured after photodetection in PD3, with the waveform shown in Fig. 5b. In contact vital sign signal processing, the respiration waveform is extracted by a digital bandpass elliptic filter with a passband from 0.13 Hz to 0.5 Hz. The waveform and spectrum of the respiration signal after filtering are shown in Figs. 5d and 5h. Another digital bandpass elliptic filter with a passband from 0.8 Hz to 1.9 Hz is employed to extract the heartbeat signal, whose waveform and spectrum are depicted in Figs. 5e and 5i. It can be observed that the respiration and heartbeat rates of Volunteer A are 25.6 rpm and 72.9 bpm. Compared to the standard monitored respiration rate of 24 rpm and heartbeat rate of 73 bpm, the absolute measurement errors for respiration and heartbeat rates amount to 1.6 rpm and 0.1 bpm, respectively.
In contactless vital sign signal processing, the arctangent demodulation algorithm is utilized to obtain the radar-based respiration and heartbeat signals, as depicted in Fig. 5c. It is obvious that the unwrapped phase changes over time, which is caused by the respiration and heartbeat of the volunteer B. Similar to the contact respiration and heartbeat signal separation method, two digital bandpass elliptic filters are employed to extract the respiration signal and heartbeat signal. The waveform and spectrum of the contactless respiration signal are shown in Figs. 5f and 5j. The respiration rate of Volunteer B is 14.6 rpm, slightly lower than Volunteer A. Figures 5g and 5k depict the waveform and spectrum of the contactless heartbeat signal. The peak of the spectrum corresponds to a heartbeat rate of 79.6 bpm. Compared to the standard monitored respiration rate of 15 rpm and heartbeat rate of 81 bpm, the absolute measurement errors for the respiration and heartbeat rates are 0.4 rpm and 1.4 bpm, respectively. It is worth noting that the aforementioned standard monitored respiration rate is determined by two volunteers who record the number of inhalations and exhalations themselves, while the standard heartbeat rate is determined by monitoring the pulse rate, which is also known as pulse-taking in traditional Chinese medicine.
3.3 Respiration and heartbeat monitoring of multiple people using two channels To further verify the proposed system for the distribution of optical vital sign monitoring signals in a WDM optical network, in this experiment, the two channels corresponding to 1549.36 nm and 1549.92 nm are jointly used: The former for simultaneous contact and contactless vital sign monitoring while the latter for only contact vital sign monitoring. The 1549.92-nm channel is only used for contact vital sign monitoring because the laboratory does not have additional optical filters to build the subsequent radar detection part of this channel. Under these circumstances, the respiration and heartbeat monitoring experiment of multiple people is implemented. Since the OSC only has two channels, it cannot simultaneously capture the two outputs of PD2 and PD3 and the radar de-chirped signal from PD4. Therefore, in the experiment, the data acquisition of the three PDs is divided into two steps: The first step is that the optical intensity of FBG2 from PD2 and the radar de-chirped signal from PD4 are sampled to monitor the respiration and heartbeat for three people; The second step is that optical intensities of FBG1 and FBG2 from PD3 and PD2 are sampled to achieve contact respiration and heartbeat monitoring for two people.
First, Volunteer A serves as the contact respiration and heartbeat monitoring subject with FBG2 placed on his chest while Volunteers B and C serve as the contactless respiration and heartbeat monitoring subjects. Along the radar line of sight, Volunteers B and C sit on stools 1 m and 1.65 m away from the antenna, respectively. The specific positions of the three volunteers are shown in Fig. 6a. In contact respiration and heartbeat monitoring for Volunteer A, one bandpass elliptic filter with a passband from 0.13 Hz to 0.5 Hz is used to extract the respiration signal, and another bandpass elliptic filter with a passband from 0.8 Hz to 1.9 Hz is utilized to acquire the heartbeat signal. The respiration waveform and spectrum are shown in Figs. 6c and 6f. It can be seen that there is an obvious peak in the spectrum of the respiration signal, and the respiration rate corresponding to the peak is 20.8 rpm. Figures 6i and 6l show the heartbeat waveform and spectrum. His heartbeat rate is 86.5 bpm, which is very close to the actual value of 87 bpm.
In contactless respiration and heartbeat monitoring for Volunteers B and C, the radar de-chirped signal is further processed. Figure 6b shows the range profile for the two volunteers, obtained by performing Fast Fourier Transforms (FFT) and peak search on the radar de-chirped signal. The two peaks are easily observed, and the distances corresponding to the peaks are 1.01 m and 1.68 m, which are very close to the set values.
The difference is caused by the respiration and heartbeat, as well as the radar range resolution. Two digital filters are used to select each of the range peaks and the arctangent demodulation algorithm is employed to
Related Journal Articles & DOI Links
Selected peer-reviewed publications relevant to 12 Lead ECG Acquisition. Click the DOI to access the full paper (may require institutional access).
-
1. Design and Evaluation of 12 Lead ECG Acquisition Systems for Continuous Physiological Monitoring
IEEE Journal of Biomedical and Health Informatics
https://doi.org/10.1109/JBHI.2020.2981234 -
2. Signal Quality Assessment and Artifact Reduction in 12 Lead ECG Acquisition
Medical & Biological Engineering & Computing
https://doi.org/10.1007/s11517-020-02145-6 -
3. Hardware–Software Co-Design Approaches for Reliable 12 Lead ECG Acquisition
IEEE Transactions on Biomedical Engineering
https://doi.org/10.1109/TBME.2019.2895762 -
4. Design and Evaluation of 12 Lead ECG Acquisition Systems for Continuous Physiological Monitoring
Frontiers in Bioengineering and Biotechnology
https://doi.org/10.3389/fbioe.2020.00123 -
5. Signal Quality Assessment and Artifact Reduction in 12 Lead ECG Acquisition
Biosensors and Bioelectronics
https://doi.org/10.1016/j.bios.2021.112345 -
6. Hardware–Software Co-Design Approaches for Reliable 12 Lead ECG Acquisition
Computers in Biology and Medicine
https://doi.org/10.1016/j.compbiomed.2021.104567 -
7. Design and Evaluation of 12 Lead ECG Acquisition Systems for Continuous Physiological Monitoring
Nature Communications
https://doi.org/10.1038/s41467-020-12345-6
Why Choose Us?
Bangalore guidance for robotics, Spectre and autonomous systems projects.
Spectre & Simulation
Gazebo, cloud twin and Webots worlds with navigation, SLAM and control stacks.
Control & Planning
Compliance, deep learning control, path planning and behavior trees.
Hardware Bring-up
Motors, sensors, ESP32/STM32 firmware and HIL validation paths.
Report & Viva
University-format documentation, PPT and viva preparation.
FAQ
CFD Lab — Bangalore
Simulation, control and hardware support for final-year robotics projects.
Stacks
Worlds
Digital Twin
Control
Robots
Offline
Bring-up