32
Patient Specific Congestive Heart Failure Detection From Raw ECG signal Yakup KUTLU1 , Apdullah YAYIK2, Esen YILDIRIM1 , Mustafa YENİAD1 ,Serdar
Abstract
In this study; in order to diagnose congestive heart failure (CHF) patients, non-linear second- order difference plot (SODP) obtained from raw 256 Hz sampled frequency and windowed record with different time of ECG records are used. All of the data rows are labelled with their belongings to classify much more realistically. SODPs are divided into different radius of quadrant regions and numbers of the points fall in the quadrants are computed in order to extract feature vectors. Fisher's linear discriminant, Naive Bayes, and artificial neural network are used as classifier. The results are considered in two step validation methods as general k- fold cross-validation and patient based cross-validation. As a result, it is shown that using neural network classifier with features obtained from SODP, the constructed system could distinguish normal and CHF patients with 100% accuracy rate.

Keywords:
Congestive heart failure, ECG, Second-Order Difference Plot, classification, patient based cross-validation.
Article History:
Received 22 January 2016, Accepted 02 February 2016, Available online 03 February 2016
Introduction
Heart failure is a stage when the heart unable to pump sufficient amount of blood that tissues need or just able to perform this with high filling pressures (Braunwald E, Zipes DP, Libby P 2004). Heart failure is a worldwide common disease affecting approximately 15 million people in the world. Its incidence increases with age. While there is 1-2% incidence between 50 and 60 year age group, it reaches 10% over the age of 75. Average 80% of all congestive heart failure (CHF) are seen in people over 65 years. 0.3% of men and 0.2% of women aged between 50 and 59 and 2.7% of man and 2.2% of women aged between 80 and 89 are exposed to CHF. The male / female ratio is calculated as 1 / 3. Each year in the United
33
States, causes of approximately 45000 patients death are declared as heart failure, and with each passing year, this number is increasing due to population aging and rising rates of cardiovascular disease-free survival. In addition, both medical expenses and loss of manpower negatively impacts on the economy (Topol & Califf 2007; Yayla 2010). Heart failure is a disease that could not be assessed easily in clinically. Early diagnosis and effective treatment of heart failure are obviously important for patients, and reduce the percentage of mortality and morbidity (Yayla 2010; Işler & Kuntalp 2007). Due to the fact that, appropriate way for treatment is possible if congestive heart failure disease is early diagnosed, automatic determination of CHF disease from ECG recordings is clinically very important. This study is an accomplished attempt to distinguish normal and CHF patients with a reliable classification system. Heart disease analysis is performed by Physical examination. However, definitive diagnosis of CHF could not be performed with Physical examination. So, in patients with suspected congestive heart failure, one or more diagnostic tests such as echocardiography, angiography, electrocardiography, chest X-ray film, brain (B-type) natriuretic peptide and stylistic trailblazer hormone, the N-terminal fragment, MR imaging are applied before making a decision (Yayla 2010; Işler & Kuntalp 2007; Kamath 2012a). In the literature, recently, by applying different signal processing and analysis methods, it is tried to advance effective computer-aided diagnosis methods (Işler & Kuntalp 2007; Kamath 2012b; Kannathal et al.
2006; Thuraisingham 2010; Karmakar et al. 2009; D. 2009; Engin 2007; Maurice E.Cohen 1996; Dabanloo et al. 2010; Işler Y n.d.). Some of them considered Heart Rate Variability (HRV) of ECG signals (Işler & Kuntalp 2007; Kamath 2012b; Işler Y n.d.; Kannathal et al.
2006; Thuraisingham 2010). In both cases, hidden important information (such as wavelet, eigenvector methods, Poincare, RR interval, etc.) in the ECG record are revealed and used as feature vectors for detecting CHF patients. Işler and Kuntalp (Işler & Kuntalp 2007) used HRV to analyse CHF disease and they used many techniques to extract features such as time frequency domain features, frequency domain features, point care plot features, and patient information. Kamath (Kamath 2012b) reported the central tendency measure of the R-R interval and showed the efficacy of redial distance of the Teager energy scatter plot to distinguish CHF from normal subjects. A measure of complex correlation to quantify temporal variability in the Poincare plot was introduced by Karmakar et al. (Karmakar et al.
2009). Thuraisingham (Thuraisingham 2010) used RR interval to analyse SODP of RR intervals. And he introduced a classification system which employs a statistical procedure. Cohen et al. (Maurice E.Cohen 1996) analysed SODPs and Central tendency measure using CHF and HRV data. Some of them considered beat based methods (Kannathal et al. 2006; Karmakar et al. 2009; D. 2009; Engin 2007). Furthermore, different methods (such as expert system, KNN, fuzzy, neuro-fuzzy, etc.) have been used as classifier. Poincare plot and the SODP are commonly used methods as non-linear analysis of the components in biomedical signals (Işler Y n.d.; Thuraisingham 2010; Karmakar et al. 2009; Maurice E.Cohen 1996; Dabanloo et al. 2010). It is also known that poincare plot is an example of chaotic system (Maurice E.Cohen 1996). While poincare map reveals the relations of the consecutive point with each other, SODP reveals the relationship of consecutive difference values with each other (Kamath 2012b; Thuraisingham 2010; Maurice E.Cohen 1996). When researcher used RR interval series to obtain features, they constructed the system by using R-R interval obtained holter record. It was long-term record. Therefore many researchers still try to increase their success and reliability by developing new approaches. They try to find less computational complexity and much useful system needed less data information. In this study, the goal is to construct a system that could be worked in real time and fast and high performance. So, whole new meaningful features are tried to extract from SODP measurement using raw ECG record in order to distinguish CHF and normal patients. And it
34
is focused two objectives that to show reliability of sampling frequency and window size of pattern in analysis. In present study, the ECG pattern with CHF and normal ECG records are achieved from the Physiobank database. Neural Network, Naive Bayes, and Linear Discriminant algorithm are used to construct classification system. Then the results are considered in two step validation methods as general k-fold cross-validation and patient based cross-validation.
In the following section, the data acquisition, pre-processing steps, method of feature extraction, the classifiers and performance measures of classifier are presented. In Section 3, the results and discussion are given. The conclusion of the study is presented in Section 4.
Material And Methods
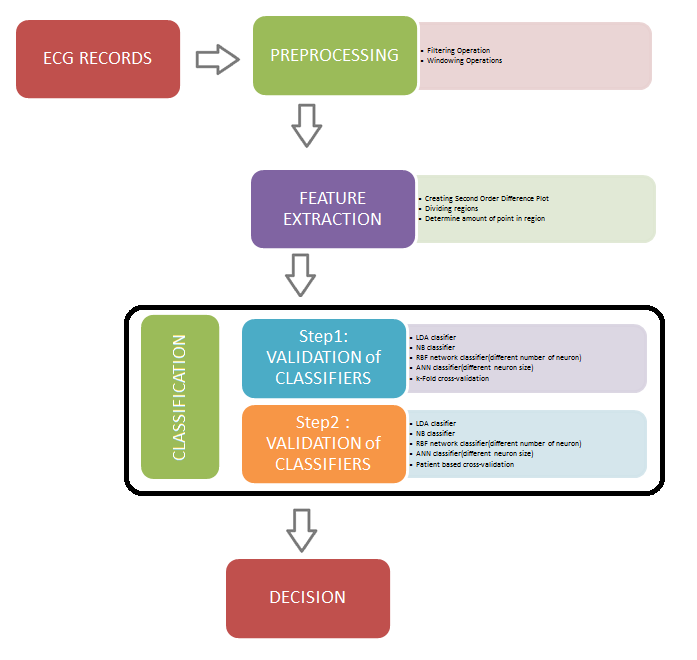
This section introduced the data acquisition, process of data preparation and feature extraction methods used in the proposed recognition system. Figure 1 shows the general block diagram of the constructed system.
Figure 1. Block diagram of the proposed system.
Data Acquisition
ECG data are obtained freely from PhysioNet web site as free of charge (A.L. Goldberger and coworkers 2000). In this study, CHF Database and Normal Sinus Rhythm Database are used. CHF database are 24 hour ECG records, obtained from 256 Hz sampling rate and received from 15 patients changing between 22 and 71 years old. Normal sinus rhythm database are 24 hour ECG records, obtained from 256 Hz sampling rate and received from 18 non-patient volunteers changing between 20 and 50 years old. ECG records have Power line interference
35
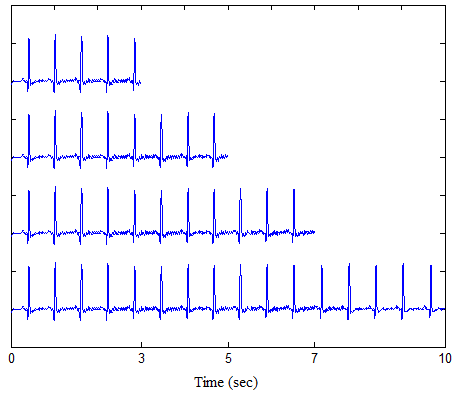
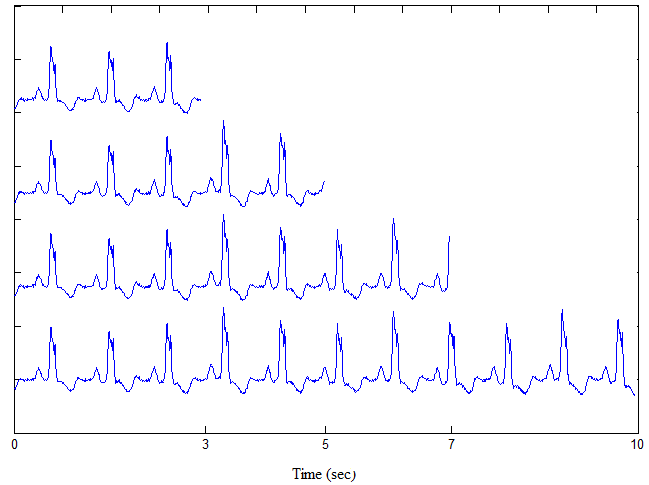
and Baseline wander effects because of respiration. Baseline wander and Power line interference consist of low frequency components and high frequency components, respectively. The records are filtered with two median filters to eliminate the baseline wander and with a notch filter to eliminate power-line frequency (Suri et al. 2007). In all other processing, the filtered signals are used. In order to examine amount of information in a window time, the records are divided into four different window time that are 10 sec, 7 sec, 5 sec and 3 sec. for 10 sec of window time, 150 windowed sample are extracted from record.
Total of 4950 windowed samples are extracted for analyse. Similarly, for other window time, windowed samples are extracted from record. The samples of windowed records are shown in Figure 2. The normalization process is applied by dividing each beat to absolute maximum value (Duda & Hart n.d.; Bishop & others 1995) for each sample, before extracting features from raw ECG data records.
Second-Order Difference Plot (Sodp)
SODP is a feature extraction method that obtains form time domain information. Implementation of SODP is very easy. The method of SODP is used both to provide independent feature extraction tools and to be used as complementary method to verify the frequency domain results (Thuraisingham 2010; Maurice E.Cohen 1996) . SODP has meaningful information about ECG (Kamath 2012b; Thuraisingham 2010). If X(t) is the ECG signal, SODP is formed by [X (t+1)-X (t)], and [X (t+2)-X (t+1)] points on the plot. In other words, SODP includes scattering of consecutive difference values of points in ECG signal.
Thus, the statistical situation of consecutive differences can be observed. Figure 3 shows the Second-order difference plot of CHF and Normal ECG signals.
(B)
Figure 2. The windowed records (respectively, 10 sec, 7 sec, 5 sec and 3 sec) a)Normal ECG
(B)
Figure 3. A sample of the Second-order difference plot for (a) CHF and (b) Normal ECG
Feature Extraction
Feature is information of the pattern. Therefore, the information is tried to extract from second-order difference plot of the CHF and Normal ECG record. The SODP is used to extract information about signals. The SODP is a figure of two-dimensional Cartesian system.
The axes of a two-dimensional Cartesian system divide the quadrants which are four infinite regions numbered from 1st to 4th, each bounded by two half-axes. The region number and two coordinates sings are I ( + , + ), II ( − , + ), III ( − , − ) and IV ( + , − ). In the studies, SODPs are divided into different radius of circle regions in order to extract features (Thuraisingham 2010; Kamath 2012b). Second-order difference plot's four regions of a quadrant are shown below (Figure 4). It shows the region divided by circles centered at the origin. There are four quadrants of a Cartesian coordinate system. Each quadrant has four region divided circle. Each region shows the increasing number of points in SODP. There are sixteen different regions (four regions of four quadrants). The numbers of points are calculated for each region and used as a feature vectors. All quadrant regions contain valuable information to classify SODP points. In the second region ( − , + ) and the fourth region ( + , − ) represent balanced increasing and decreasing, the first region ( + , + ) and the third Region ( − , − ) represent the continuous increasing and decreasing (Kamath 2012b).
Performance Measurements
In this study, total of 33 ECG records (15 CHF and 18 normal ECG) is used. The records are windowed as 3 sec, 5 sec, 7 sec, 10 sec. 150 windowed record are used for each record. 16 features are extracted from each window. Total of 4950 feature vectors are extracted for each window. Performances are evaluated by using LDA, NB, network, ANN classifiers. The performances are validated by two methods: general k-fold cross-validation and patient based cross-validation.
General K-Fold Cross-Validation
Cross-validation is also known rotation estimation. It is a method to determine how the results of a statistical analysis will generalize to a new data set. In this method, all data set is randomly separated k equal subsets. One subset is used as validation and all other subsets are
Related Journal Articles & DOI Links
Selected peer-reviewed publications relevant to 12 Lead ECG Acquisition. Click the DOI to access the full paper (may require institutional access).
-
1. Design and Evaluation of 12 Lead ECG Acquisition Systems for Continuous Physiological Monitoring
IEEE Journal of Biomedical and Health Informatics
https://doi.org/10.1109/JBHI.2020.2981234 -
2. Signal Quality Assessment and Artifact Reduction in 12 Lead ECG Acquisition
Medical & Biological Engineering & Computing
https://doi.org/10.1007/s11517-020-02145-6 -
3. Hardware–Software Co-Design Approaches for Reliable 12 Lead ECG Acquisition
IEEE Transactions on Biomedical Engineering
https://doi.org/10.1109/TBME.2019.2895762 -
4. Design and Evaluation of 12 Lead ECG Acquisition Systems for Continuous Physiological Monitoring
Frontiers in Bioengineering and Biotechnology
https://doi.org/10.3389/fbioe.2020.00123 -
5. Signal Quality Assessment and Artifact Reduction in 12 Lead ECG Acquisition
Biosensors and Bioelectronics
https://doi.org/10.1016/j.bios.2021.112345 -
6. Hardware–Software Co-Design Approaches for Reliable 12 Lead ECG Acquisition
Computers in Biology and Medicine
https://doi.org/10.1016/j.compbiomed.2021.104567 -
7. Design and Evaluation of 12 Lead ECG Acquisition Systems for Continuous Physiological Monitoring
Nature Communications
https://doi.org/10.1038/s41467-020-12345-6
Why Choose Us?
Bangalore guidance for robotics, Spectre and autonomous systems projects.
Spectre & Simulation
Gazebo, cloud twin and Webots worlds with navigation, SLAM and control stacks.
Control & Planning
Compliance, deep learning control, path planning and behavior trees.
Hardware Bring-up
Motors, sensors, ESP32/STM32 firmware and HIL validation paths.
Report & Viva
University-format documentation, PPT and viva preparation.
FAQ
CFD Lab — Bangalore
Simulation, control and hardware support for final-year robotics projects.
Stacks
Worlds
Digital Twin
Control
Robots
Offline
Bring-up