Semantic-based Detection of Segment Outliers and Unusual
Michael Bruenig
CSIRO Computational Informatics, Brisbane, Queensland 4069, Australia
Jane Hunter
Abstract: Environmental scientists have increasingly been deploying wireless sensor networks to capture valuable data that measures and records precise information about our environment. One of the major challenges associated with wireless sensor networks is the quality of the data – and more specifically the detection of segment outliers and unusual events. Most previous research has focused on detecting outliers that are errors that are caused by unreliable sensors and sensor nodes.
However, there is an urgent need for the development of new tools capable of identifying, tagging and visualizing erroneous segment outliers and unusual events from sensor data streams. In this paper, we present a SOUE-Detector (Segment Outlier and Unusual Event-Detector) system for wireless sensor networks that combines statistical analyses using Dynamic Time Warping (DTW) with domain expert knowledge (captured via an ontology and semantic inferencing rules). The resulting Web portal enables scientist to efficiently search across a collection of wireless sensor data streams and identify, retrieve and display segment outliers (both erroneous and genuine) within the data streams. In this paper, we firstly describe the detection algorithms, the implementation details and the functionality of the SOUE-Detector system. Secondly we evaluate our approach using data that comprises sensor observations collected from a sensor network deployed in the Springbrook National Park in Queensland, Australia. The experimental results show that the SOUE-Detector can efficiently detect segment outliers and unusual events with high levels of precision and recall.
Key Words: Dynamic Time Warping, Data Quality, Wireless Sensor Networks, Outlier Detection, Unusual Event Detection, Semantic Web.
1. Introduction
In recent years, wireless sensor networks (WSNs) have been increasingly deployed in environmental monitoring to measure physical and environmental parameters by densely deploying numerous tiny sensors in spatially distributed terrain (Corke et al., 2010, Selavo et al., 2007, Jelicic et al., 2011, Kułakowski et al., 2013, Sreedevi and Sebastian, 2012). Such WSNs have become a valuable tool as they can collect diverse observations ranging from air temperature and leaf wetness to images and acoustic telemetry data at high frequencies - providing detailed data which can be used by scientists, resource managers and policy makers (Wark et al., 2008, Jain et al., 2012). However, wireless sensor networks (WSN) comprising of hundreds of inexpensive and battery-operated sensors frequently suffer from poor data quality. The limited capabilities of low cost sensors (including battery power, memory, computational capacity, communication bandwidth) combined with harsh environmental conditions often generate unreliable and inaccurate data (Chen et al., 2006, Yang et al., 2010, Dereszynski and Dietterich, 2011, Janakiram et al., 2006). Noisy, faulty, missing and redundant data significantly affects the accuracy and reliability of the information inferred from WSN-based applications and its ability to be used in decision-making. Hence, it is essential to develop advanced algorithms and systems to precisely detect outliers within sensor data streams (“segments that significantly deviate from the normal pattern of sensed data”) (Zhang, Meratnia & Havinga 2010) – and to distinguish between those outliers that are errors and those outliers that are “genuine” i.e., correctly measured data streams that represent unusual events.

Early research efforts aimed at detecting outliers have adopted: statistical-based approaches (Weili et al., 2007, Bettencourt et al., 2007); nearest neighbor-based techniques (Branch et al., 2006); clustering-based approaches (Rajasegarar et al., 2006); classification-based approaches (Rajasegarar et al., 2007, Hill et al., 2007, Janakiram et al., 2006) and Semantic Web-based approaches (Calder et al., 2010). However, these previous approaches have a number of shortcomings when applied to the detection of genuine outliers.

Firstly, the majority of previous work assumes that the sensor data is univariate and fails to take into account multivariate data (Yang et al., 2010). Secondly, little effort has focused on handling the dynamic nature, variability and heterogeneity of sensors (the devices that detect or measure a physical property), sensor nodes (the platforms on which multiple sensors can be attached) and sensor networks. For example, in April 2008 the Springbrook Wireless Sensor Network (Wark et al., 2008) installed 9 sensor nodes with sensors measuring leaf wetness, soil moisture, air pressure, air temperature, relative humidity and wind (direction and speed). In April 2009, more sensor nodes were installed and new sensors including rainfall and light were added. In February 2011, an additional 125 sensor nodes were added and a range of new sensors started collecting information on tree growth, carbon dioxide concentrations, cloud cover and fog density. At the same time, the wind direction sensors were removed. Sensor nodes were moved between different locations at different points in time, and were re-configured with different numbers and types of sensors. Our approach will keep track of and update the configuration data of the WSN as it changes. Thirdly, using supervised machine learning algorithms such as Support Vector Machines (Zhang et al., 2013, Rajasegarar et al., 2007) and Bayesian Networks (Janakiram et al., 2006) to classify normal or abnormal data is difficult to achieve because there is no prior knowledge available via a training dataset. We will overcome this by designing new algorithms which take domain expert knowledge into account. Fourthly, correlations among sensor properties have been ignored by most of previous studies, but such correlations are very useful in detecting unusual events and can be captured through domain expert knowledge. Hence, our approach will include a tool to capture domain expert knowledge about correlations between sensor properties (e.g., between temperature, humidity, windspeed trends). Lastly and most importantly, most of the previous studies assume by default that any outliers are errors (Yang et al., 2010). They do not attempt to distinguish between the erroneous outliers and genuine outliers associated with unusual events (Shahid et al., 2012, Yang et al., 2010). Correctly distinguishing between outliers that are errors and outliers that are unusual events is critical for advancing the development and adoption of WSNs to underpin accurate and reliable decision support systems. In this study, an erroneous outlier, also called a true error, is defined as a segment of sensor data stream which refers to noise-related measurements or data generated by a faulty sensor. Such a segment deviates from the usual sensor data streams and is also likely to be spatially unrelated. An unusual event is defined as a particular phenomenon which simultaneously changes the patterns of multiple types of sensor data streams so that they deviate from the normal patterns of the data streams. In addition, the sensor data streams associated with unusual events are likely to be spatially or temporally correlated. Thus in this paper we focus on distinguishing between erroneous outliers and unusual events by making use of spatio- temporal and other types of correlations between sensor properties.

Semantic Web-based approaches, including RDF, ontologies and inferencing rules, have been applied previously to reason about anomalous sensor data (Calder et al., 2010). Specifically, Calder et al provided a framework for validating scientists’ or decision makers’ hypotheses about anomalous sensor data.

However, the identification of anomalous sensor data depends on scientists’ or decision makers’ prior definitions of what constitutes anomalous data (e.g. valid ranges). Compared with this work, we are not recording specific definitions about outliers or events from domain experts but documenting specific correlations between sensor properties to improve the detection of genuine outliers associated with unusual events. Moreover, we are not providing a platform for hypothesis validation but providing an effective approach to automatically detect outliers and unusual events for WSNs which monitor environmental variables. In addition, we provide intuitive user interfaces to enable domain scientists to express their knowledge about relationships or correlations between multiple sensor data streams measuring different properties. Our assumption is that unusual events can be identified by unusual patterns across multiple sensor properties if there is a correlation between those properties.

2. Objectives
The principal aim of this study is to develop a Segment Outlier and Unusual Event (SOUE) Detector to provide solutions to the issues outlined above. The more specific objectives are:
To define a Correlation of Environmental Sensor Properties (CESP) ontology by extending the Semantic Sensor Network (SSN) ontology (Compton et al., 2012) developed by the Semantic Sensor Network Incubator Group to describe correlations between specific sensor properties. For example, air temperature has a correlation with relative humidity since air temperature increases as relative humidity decreases (Valsson and Bharat, 2011) .

To design an algorithm to detect segment outliers and unusual events for WSNs by integrating statistical analysis techniques with Semantic Web technologies and domain expert knowledge about rules/correlations. This algorithm not only takes into account the dynamic nature and variability of sensors, sensor nodes and sensor networks, but also integrates information about other types of correlations apart from spatio-temporal correlations between sensor properties.

To develop a SOUE-Detector system based on the designed algorithm that will validate our proposed methodology by applying it to a real dataset - Springbrook dataset (Wark et al., 2008). The system should enable users to search the Springbrook dataset and retrieve data streams for a particular time period and automatically tag segments as “error” or “unusual event” displayed in a visualization interface.

In the remainder of this paper, we describe the SOUE-Detector system in more detail. Section 3 describes the proposed methodology including the case study, data collection and our approach. Section 4 describes our proposed ontology of Correlated Environmental Sensor Properties (CESP). Section 5 provides the detailed information about our proposed detection algorithm for identifying erroneous outliers and unusual events. Section 6 describes the SOUE-Detector system architecture and Web portal. In Section 7, we evaluate the precision and recall of our proposed semantic-based algorithm. Finally, Section 8 provides a brief conclusion and future work.

3.1 Case Study And Data Collection
The Springbrook Wireless Sensor Network (Wark et al., 2008) project (implemented by CSIRO, Conservation Society) involves the deployment of a WSN in the Springbrook National Park, located about 96km south of Brisbane in the state of Queensland, Australia. It aims to provide a research platform for monitoring how the microclimates and biodiversity of the Springbrook plateau changes over time.

Hundreds of solar-powered sensor nodes have been installed and each sensor node carries several sensing devices to collect different environmental variables. These variables include air temperature, relative humidity, air pressure, leaf wetness, soil moisture, wind speed, wind direction and light. The richness of the Springbrook data set makes it ideal as a testbed for developing and evaluating our approach of detecting outliers and unusual events. For our case study, we acquired 2.5 years’ data (from January 2010 to June 2012) from the Springbrook Wireless Sensor Network project. More specifically, three types of sensor observations (air temperature, relative humidity and air pressure) were collected by Vaisla WXT520 weather transmitter. The sampling rate of each sensor was 1 sample/10 min.

3.2 Approach
Our approach to developing and applying our system to the case study data can be sub-divided into the
Following Five Steps:
1. Development of a PostgreSQL database to store raw sensor data streams collected from the WSNs. Specifically, each sensor observation includes the following metadata: the ID of the sensor node, the ID of the sensor device, the name of the sensor device, the sampling time/date for the observation, the type of sensor property, the observation value and the observation measurement unit. Each sensor node has the following metadata: the ID of the sensor node, its geographical location (latitude and longitude), its installation date/time and removal date/time. In addition, each sensor device has the following metadata: the ID of the sensor, the ID of sensor node that the sensor is connected to, sensor observation property, installation date/time and removal date/time.

2. Development of an ontology of Correlated Environmental Sensor Properties (CESP). This ontology defines concepts that describe different correlation types in terms of strength, direction, shape, space- time, composition and complexity.

3. Design and implementation of the detection algorithm, which comprises: definition of a spatial neighborhood matrix for describing the spatial correlations between sensor nodes; definition of spatial neighborhood matrices for describing the spatial correlations between sensors; detection of suspicious data streams (using Dynamic Time Warping-based similarity computation); development of a user interface for domain experts to define correlation rules; identification of unusual events from suspicious data streams.

4. Development of a Web-based system to enable users to search wireless sensor data streams for a given time period, then to visualize the detected erroneous outliers and unusual events via a Google Earth Map and timeline interface.

5. Evaluation of the performance of the proposed detection algorithm by calculating the precision and recall on two datasets.
Sensor Properties
Most of the sensor properties have one or more correlations with other properties. For example, humidity and barometric pressure are related to air temperature. Capturing the correlations between sensor properties is critical for improving the accuracy and efficiency of detecting genuine outliers and unusual events. Hence, the first step in detecting outliers and events is to develop a Correlated Environmental Sensor Properties (CESP) ontology (https://code.google.com/p/cesp-ontology/source/browse/wiki/cesp- v1.owl) that describes the correlations between environmental sensor properties. The CESP is designed by extending the Semantic Sensor Network Ontology (SSN) that has been developed by the W3C Semantic Sensor Network Incubator Group (Compton et al., 2012) for describing sensors, sensing, the measurement capabilities of sensors and the observations. More specifically, the SSN ontology is a high level ontology that does not describe the low-level properties of a wireless sensor network, such as the relationships between sensor properties. Hence for the work presented in this paper, we have developed the CESP ontology by extending the SSN ontology to precisely describe the specific sensor properties and their relationships within a sensor network.

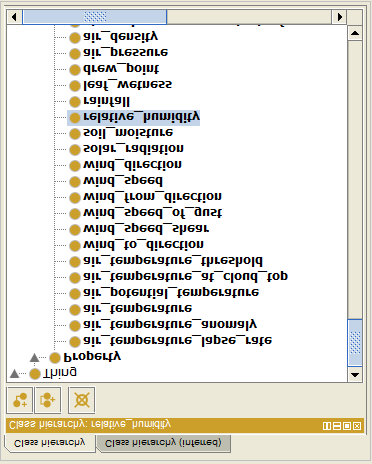
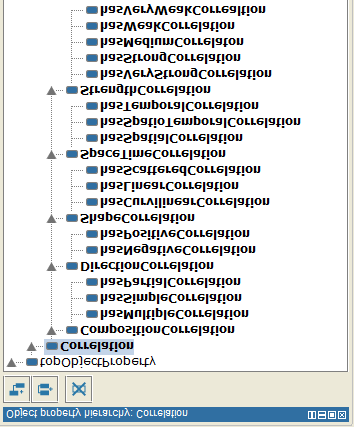
The CESP ontology (See in Fig.1) consists of two components: a sensor property class (ssn:Property) and an object property (cesp:Correlation) which is defined as a relationship between two sensor properties. The subclasses of ssn:Property are derived from the Climate and Forecast (CF) metadata conventions (Eaton et al., 2003) that provide a definitive description of climate and forecast data variables and the spatial and temporal properties of the variables. For example, for each of the CF names (e.g., air_temperature) we created a corresponding class e.g., cesp:air_temperature. A sub-class of ssn:Property (e.g. cesp:air_temperature, cesp:relative_humidity, cesp:air_pressure) must be observed by a sensor. The property cesp:Correlation links one sensor property to another sensor property. In order to accurately describe the correlations between sensor properties, we defined five types of sub-properties of cesp:Correlation (Tutorvista, 2013, Zone, 2013b, Zone, 2013a): 1. Strength – cesp:hasVeryStrongCorrelation, cesp:hasStrongCorrelation, cesp:hasMediumCorrrelation, cesp:hasWeakCorrelation, cesp:hasVeryWeakCorrelation,
Cesp:Hasveryweakcorrelation
2. Direction – cesp:hasPositiveCorrelation, cesp:hasNegativeCorrelation 3. Shape/Form – cesp:hasLinearCorrelation, cesp:hasCurvilinearCorrelation,
Cesp:Hasscatteredcorrelation
4. Space-time – cesp:hasSpatialCorrelation, cesp:hasTemporalCorrelation,
Cesp:Hasspatiotemporalcorrelation
5. Composition – cesp:hasPartialCorrelation, cesp:hasSimpleCorrelation, cesp:hasMultipleCorrelation Fig.1: The CESP ontology consists of an object property cesp:Correlation with a set of sub object properties (left) and a sensor property class ssn:Property with a set of sub classes (right)
5. Detection Algorithms
In this section, we describe the algorithms that used for detecting outliers and unusual events. To begin, we define the terms and notations used in our algorithms, and also describe the similarity computation method which uses Dynamic Time Warping (DTW) to compute the similarity between two windows of data streams. Following this, we describe the five steps in our detection algorithm: 1. We construct a sensor node matrix to document the spatial neighborhood relationships between sensor nodes by defining a threshold value that determines whether two sensor nodes are neighbors or not. If the distance between two sensor nodes is <= the threshold value, then they are neighbors. If the distance between two sensor nodes is > than the threshold value, then they are not neighbors.

2. We construct a matrix for the sensors to document spatial relationships between sensors. Such matrices are built by integrating the sensor node matrix constructed in the first step with sensor node configurations (that define which sensors are attached to which sensor nodes) of a WSN.

3. Next, we detect suspicious data within the sensor data streams by: choosing a sensor type (e.g. temperature) and determining the similarities between neighbouring data streams for each sensor type. The algorithm determines whether the sensor collects suspicious data or not by applying a predefined rule to the calculated similarity results. This is repeated for all sensors in the network.

4. We enable domain experts to input/define correlation rules through a graphical user interface. The user interface enables a user to specify relationships (e.g. very strong, strong, medium, weak, very weak) among sensor properties. The specified relationships are saved and used in the next step.

5. Finally, we combine the domain expert rules (from the previous step) with the detected suspicious results to determine whether a suspicious segment data stream is a true error or an unusual event.
The I-Th Type Of Sensor Employed In The Wsn,
ijs indicates the i-th type of sensor installed on the j-th
J
sn , and n is the total number of sensor nodes deployed in the WSN. For instance,
1S Denotes
all the relative humidity sensors deployed in the WSN and
O
where g is the total number of collected sensor observations. The complete set of sensor
O
O
O
O
. 5.2 Dynamic Time Warping based Similarity Computation We use Dynamic Time Warping (DTW) (Sakoe and Chiba, 1990, Keogh, 2002, Matuschek et al., 2008) to compute the similarity between two sensor observation data streams, as it is a well-established and widely used algorithm for comparing similarity between two discrete sequences of continuous values.

Iks
both respectively collected u sensor observations:
T
T
t ) are the timestamps at when sensor observations are collected, and
O ,O ,
,o are the corresponding captured sensor observations. In order to efficiently compute the
V
). Eventually, these two sensor observation data sets are respectively transformed to two sets of vector
.
A,B Can Be Computed By
Euclidean Distance between the end points of the two vectors or the angle ( 0 ) between two vectors (Toshniwal and Joshi, 2005). However, the Euclidean Distance is not able to handle vertical shift existing between the vectors under comparison. Compared with the Euclidean Distance, the angle not only considers the direction of the vectors, but also handles the vertical shift between the vectors. Thus, in this work we adopt the angle between two vectors (e.g.

B
v ) to compute the degree of similarity.
. For Each W , It Must Satisfy Three
constraints: Boundary condition, Continuity condition and Monotonic condition (Sakoe and Chiba, 1990, Al-Naymat et al., 2009, Ongwattanakul and Srisai, 2009). In fact, many possible monotonical alignment
can be generated to meet the three constraints. To determine an optimal
D a,b , we use the following equation to calculate the similarity between
(4)
5.3 Construction of Spatial Neighbourhood Matrix for Sensor Nodes In this section, we describe our approach for constructing a matrix U that documents the spatial neighbourhood relationship among sensor nodes deployed in the WSN. Formally, U can be expressed as:
J
sn (each located at a precise latitude and longitude:
J
D(sn ,sn ) and is a predefined neighbourhood threshold value. To build
is the diameter of the earth in meters according to WSG84 system and b is defined
(8)
5.4 Construction of Spatial Neighbourhood Matrices for Sensors In this section, we detail our algorithm for constructing spatial neighbourhood matrices for sensors. For i-
A
will be constructed. There are m types of sensors in total, thus m matrices
) describes the spatial neighbourhood relationship between two sensors
J
sn did not have an i-th type of sensor installed on. 5.5 DTW-based Similarity Matrices Construction and Suspicious Data Detection Given that m types of sensors deployed in the WSN have collected a set of sensor observations
O
. To detect suspicious data, firstly we need to construct DTW-based similarity
I
SM is a matrix describing all the similarity relationships between
( G Is The Number Of Sensor Observations And
is an even integer denotes the predefined size of a sliding window). In addition, each window contains an
2
observations between consecutive windows. Finally, the
O
O
.
Sm
is obtained, it can be readily used to detect suspicious data. To detect suspicious data,
(19)
where is the predefined similarity threshold value. The rationale for choosing the function in Equation 17 is that: if a data stream segment of sensor (property A) exists, and its pattern is similar to less than half of its neighbors’ patterns (for the same property A), then it is suspicious, otherwise it is normal.

5.6 Capturing Domain Expert Knowledge through Correlation Definition To capture domain experts’ knowledge about trends between properties, we provide them with the Protégé ontology editing tool and user interface to define sensor property correlations using terms from the CESP ontology. Fig.2 shows a screen shot of an expert using Protégé to create a correlation (cesp:air_temperature cesp:hasNegativeCorrealtion cesp:relative_humidity) which specifies that air
Related Journal Articles & DOI Links
Selected peer-reviewed publications relevant to 12 Lead ECG Acquisition. Click the DOI to access the full paper (may require institutional access).
-
1. Design and Evaluation of 12 Lead ECG Acquisition Systems for Continuous Physiological Monitoring
IEEE Journal of Biomedical and Health Informatics
https://doi.org/10.1109/JBHI.2020.2981234 -
2. Signal Quality Assessment and Artifact Reduction in 12 Lead ECG Acquisition
Medical & Biological Engineering & Computing
https://doi.org/10.1007/s11517-020-02145-6 -
3. Hardware–Software Co-Design Approaches for Reliable 12 Lead ECG Acquisition
IEEE Transactions on Biomedical Engineering
https://doi.org/10.1109/TBME.2019.2895762 -
4. Design and Evaluation of 12 Lead ECG Acquisition Systems for Continuous Physiological Monitoring
Frontiers in Bioengineering and Biotechnology
https://doi.org/10.3389/fbioe.2020.00123 -
5. Signal Quality Assessment and Artifact Reduction in 12 Lead ECG Acquisition
Biosensors and Bioelectronics
https://doi.org/10.1016/j.bios.2021.112345 -
6. Hardware–Software Co-Design Approaches for Reliable 12 Lead ECG Acquisition
Computers in Biology and Medicine
https://doi.org/10.1016/j.compbiomed.2021.104567 -
7. Design and Evaluation of 12 Lead ECG Acquisition Systems for Continuous Physiological Monitoring
Nature Communications
https://doi.org/10.1038/s41467-020-12345-6
Why Choose Us?
Bangalore guidance for robotics, Spectre and autonomous systems projects.
Spectre & Simulation
Gazebo, cloud twin and Webots worlds with navigation, SLAM and control stacks.
Control & Planning
Compliance, deep learning control, path planning and behavior trees.
Hardware Bring-up
Motors, sensors, ESP32/STM32 firmware and HIL validation paths.
Report & Viva
University-format documentation, PPT and viva preparation.
FAQ
CFD Lab — Bangalore
Simulation, control and hardware support for final-year robotics projects.
Stacks
Worlds
Digital Twin
Control
Robots
Offline
Bring-up