Available Online 14 August 2023
1053-8119/© 2023 The Author(s). Published by Elsevier Inc. This is an open access article under the CC BY license (http://creativecommons.org/licenses/by/4.0/). Neural modulation enhancement using connectivity-based EEG neurofeedback with simultaneous fMRI for emotion regulation Amin Dehghani a,b,*, Hamid Soltanian-Zadeh a,c,d, Gholam-Ali Hossein-Zadeh a,c c School of Cognitive Sciences, Institute for Research in Fundamental Sciences (IPM), Tehran, Iran
A B S T R A C T
Emotion regulation plays a key role in human behavior and overall well-being. Neurofeedback is a non-invasive self-brain training technique used for emotion regulation to enhance brain function and treatment of mental disorders through behavioral changes. Previous neurofeedback research often focused on using activity from a single brain region as measured by fMRI or power from one or two EEG electrodes. In a new study, we employed connectivity-based EEG neurofeedback through recalling positive autobiographical memories and simultaneous fMRI to upregulate positive emotion. In our novel approach, the feedback was determined by the coherence of EEG electrodes rather than the power of one or two electrodes. We compared the efficiency of this connectivity- based neurofeedback to traditional activity-based neurofeedback through multiple experiments. The results showed that connectivity-based neurofeedback effectively improved BOLD signal change and connectivity in key emotion regulation regions such as the amygdala, thalamus, and insula, and increased EEG frontal asymmetry, which is a biomarker for emotion regulation and treatment of mental disorders such as PTSD, anxiety, and depression and coherence among EEG channels. The psychometric evaluations conducted both before and after the neurofeedback experiments revealed that participants demonstrated improvements in enhancing positive emotions and reducing negative emotions when utilizing connectivity-based neurofeedback, as compared to traditional activity-based and sham neurofeedback approaches. These findings suggest that connectivity-based neurofeedback may be a superior method for regulating emotions and could be a useful alternative therapy for mental disorders, providing individuals with greater control over their brain and mental functions.

1. Introduction
Emotion regulation is an intrinsic or extrinsic process of managing and modifying emotional experiences, which can include enhancing, inhibiting, or maintaining emotional responses through changes in behavior, feelings, or physiological reactions (Gross, 2015; Thompson, 2019). Emotion regulation plays a key role in behavior and one’s life quality. Several strategies including situation selection, situation modification, attention deployment, cognitive change, and response modulation have been proposed for emotion regulation (Gross, 1998).

Neurofeedback (NF) is a noninvasive self-brain training technique used for emotion regulation to enhance brain function or treatment of mental disorders leading to behavioral changes (Brewer et al., 2011). By providing individuals with real-time feedback on their brain activity, neurofeedback allows them to gain voluntary control over their neural processes associated with emotions. This technique operates on the principle of neuroplasticity, which suggests that the brain can adapt and reorganize its functioning based on experience and feedback (Loriette et al., 2021). Through neurofeedback training, individuals can learn to modulate their brain activity and achieve a more desirable emotional state. Unlike invasive procedures that involve surgical interventions or pharmacological approaches that introduce external substances into the body, neurofeedback relies on the use of different devices and tech niques to measure brain activity. This makes it a safe and well-tolerated method, minimizing potential risks and side effects associated with more invasive techniques. Furthermore, neurofeedback has shown promise in addressing a wide range of emotional dysregulation issues. Research studies have explored its application in various clinical conditions, such
Https://Doi.Org/10.1016/J.Neuroimage.2023.120320
Received 18 April 2023; Received in revised form 6 August 2023; Accepted 10 August 2023
2
as anxiety disorders, depression, post-traumatic stress disorder (PTSD), and attention deficit hyperactivity disorder (ADHD). By training in dividuals to self-regulate their brain activity patterns, neurofeedback has the potential to reduce symptoms, enhance emotional well-being, and improve overall mental health outcomes (Ahrweiler et al., 2022; Ciccarelli et al., 2023; Louthrenoo et al., 2022; Moreno-García et al., 2022; Russo et al., 2022; Shaw et al., 2023; Taylor et al., 2022; Zhao et al., 2023).

Electroencephalography (EEG) and functional magnetic resonance imaging (fMRI) are two neuroimaging techniques commonly used in neurofeedback research. EEG neurofeedback has several medical and non-medical applications (Bolea, 2010; Coben et al., 2010; Gapen et al., 2016; Quaedflieg et al., 2016; Zuberer et al., 2018). EEG frontal asym metry has been utilized in numerous studies to investigate emotion regulation, particularly based on the approach-withdrawal model (Davidson et al., 1990; Mennella et al., 2017; Peeters et al., 2014; Wang et al., 2019). According to this model, negative emotions or withdrawal-related affect (e.g., fear, sadness, and disgust) are linked to increased activity in the right hemisphere. Conversely, heightened ac tivity in the left hemisphere is associated with emotional states like joy or anger (Quaedflieg et al., 2016). Multiple prior studies have high lighted the potential of EEG frontal asymmetry as an indicator of distinct emotional states and as a biomarker for conditions such as PTSD, anxi ety, and depression (Coan and Allen, 2004; Deng et al., 2023; Kol ler-Schlaud et al., 2020; L´opez-Castro et al., 2021; Meyer et al., 2018; Meza-Cervera et al., 2023; Spironelli et al., 2021; Stead et al., 2023). It was hypothesized that individuals have the ability to modulate positive and negative affect through EEG frontal asymmetry neurofeedback (Peeters et al., 2014b). The findings indicated that increased activity in the left frontal hemisphere was associated with positive affect, while increased activity in the right frontal hemisphere was linked to negative affect. Additionally, decreased activity in the right frontal hemisphere was associated with positive affect, while decreased activity in the left frontal hemisphere was linked to negative affect. Previous studies have employed simultaneous recording of EEG and fMRI during emotion regulation, often using EEG asymmetry in the frontal region alone or in combination with fMRI as a form of neurofeedback (Dehghani et al., 2022, 2020; Mosayebi et al., 2022; Zotev et al., 2016, 2014). Previous neurofeedback studies have mainly been restricted to utilizing the ac tivity of a single brain region as measured by fMRI or the power of one or two electrodes in EEG in order to calculate neurofeedback (Arpaia et al., 2022; Cavazza et al., 2014; Dehghani et al., 2022; Herwig et al., 2019; Marxen et al., 2016; Mennella et al., 2017; Misaki et al., 2018; Paret et al., 2018; Wang et al., 2019; Zhu et al., 2019; Zotev et al., 2018, 2014).
According to previous studies (Kim et al., 2015; Sulzer et al., 2013; Zotev et al., 2011), feedback based on network or connectivity may result in better/higher regulation through feedback. In this study, we hypothesize that utilizing neurofeedback to regulate emotions through coherence of EEG electrode leads to greater modulation of brain func tion and activity compared to traditional frontal asymmetry neuro feedback. Additionally, we propose that this approach offers enhanced volitional control over brain and mental function. To investigate this, we administer neurofeedback based on the coherence of EEG electrodes, building upon the findings from our prior study (Dehghani et al., 2021).
The findings of this study highlight the efficacy of connectivity-based neurofeedback in modulating EEG frontal asymmetry, EEG coherence, fMRI BOLD signal/connectivity, and psychometric test outcomes, sur passing the effects observed with traditional EEG frontal asymmetry neurofeedback and a sham control group.
2.1. Task Design
The research protocol was approved by the ethics committees of the three experimental groups (groups 1, 2, and 3). The data for groups 2 and 3 is derived from pre-existing data utilized in previous studies (Dehghani et al., 2022, 2020; Mosayebi et al., 2022). Ten healthy sub jects (age 26.5 ± 3.6 years, all-male, white) for connectivity-based EEG neurofeedback (experimental group 1) participated in this study. The results of this study were compared with those of our previous study that used EEG frontal asymmetry neurofeedback as the experimental group (experimental group 2 including 20 healthy subjects and age 26.7 ± 3.6 years, all male, white), as well as with a sham control group (experi mental group 3 including 15 healthy subjects and age 27 ± 3.8 years, all male, white). Participants in the control group were provided (without their knowledge) with sham EEG neurofeedback. During the quality control of data, no dropouts were detected. However, prior to the commencement of the experiments, three individuals (two from the experimental group 2 and one from the experimental group 3) dropped out due to technical issues for MR scanner. Participants in experimental group 2 received neurofeedback based on EEG frontal asymmetry in the alpha frequency band, while those in experimental group 1 received neurofeedback based on the coherence of EEG electrodes. Participants in the control group received sham feedback without being aware that it was not real feedback. The study’s exclusion criteria encompassed in dividuals with a current or prior history of significant psychiatric or neurological disorders, substance abuse within the past year, previous brain surgery, and issues related to undergoing MRI scans. All partici pants were right-handed and had either normal vision or vision cor rected to normal. Additionally, prior to the experiment, each participant completed two psychometric tests including Beck’s Depression In ventory (Craven et al., 1988) and the General Health Questionnaire - 28 (GHQ-28) (Nazifi et al., 2013). The mean scores for Beck’s Depression Inventory and GHQ-28 were 6.6 ± 3.2 and 2.1 ± 2.1, respectively.
Based on these scores, the participants exhibited normal levels of depression according to Beck’s Depression Inventory and were classified as non-psychiatric based on the GHQ-28 test result. All participants were examined by a resident physician before the experiment and filled out the consent form.
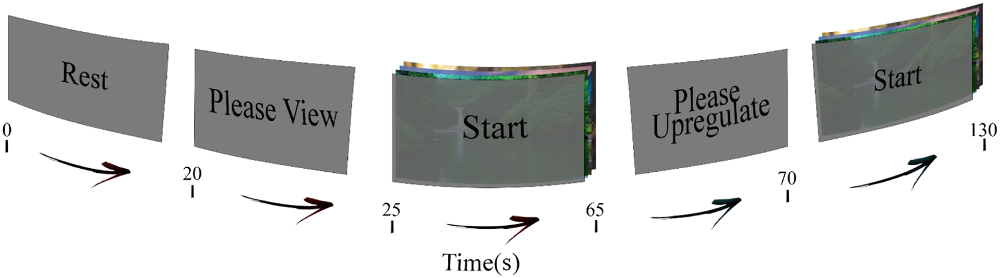
The study used a paradigm of retrieving positive autobiographical memories, as previously described in (Dehghani et al., 2022, 2020). Before the experiment, we had an interview with each participant and we asked them to tell several positive autobiographical memories, and individualized images were chosen based on each memory. The exper iment consisted of 10 runs, each comprising a rest block (20 sec), a view block (40 sec) and an upregulation block (60 sec). During the rest block, subjects were instructed to relax with open eyes, while no images were displayed. During the view block, participants were presented with two pictures depicting their positive autobiographical memories that were mentioned during the interview. They were instructed to simply observe the images without actively trying to recall the associated memories. In the upregulation block, participants were presented with similar images as in the previous view block. They were instructed to increase the height of neurofeedback bar by recalling and retrieving related auto biographical memories. Before the neurofeedback session, participants were given a sample run of the paradigm without viewing individual pictures.
The neurofeedback used in experimental group 2 was based on the approach-withdrawal hypothesis (Davidson, 1998), which involves measuring the difference in EEG power between the right and left hemispheres in the alpha frequency band in 2-second time windows with 50% overlap. The neurofeedback for experimental group 1, on the other hand, was based on the coherence of EEG channels F4 and F3 within the alpha frequency band. Further details regarding this approach are discussed in subsequent sections. A recent study has shown that the coherence between the F4 and F3 electrodes in the alpha fre quency band during emotion regulation blocks increases significantly compared to other blocks of the experiment (Dehghani et al., 2021).
Therefore, the change in coherence between these two electrodes was A. Dehghani et al.
3
measured in 2-second time windows with 50% overlap and presented to participants as feedback. The experimental protocol for a single run is shown in Fig. 1.
2.2. Data Acquisition
The MRI scans were obtained using a 3 Tesla Prisma scanner (Siemens, Erlangen, Germany) at the National Brain Mapping Lab (NBML) in Tehran, Iran. Structural images were captured using a T1- weighted MPRAGE pulse sequence (TI = 1100 msec, TR = 1810 msec, TE = 3.47 msec, flip angle = 90◦, and voxel size = 1×1×1 mm), and functional data were obtained using a T2*-weighted gradient-echo, echo-planar (EPI) pulse sequence (TR = 2000 msec, TE = 30 msec, flip angle = 90◦, matrix size = 64×64×30, and voxel size = 3.8×3.8×4 mm). Over the course of 10 experimental runs, 650 vol images were acquired. EEG data were recorded at 5k samples/sec using a 64 channel MR-compatible EEG system (Brain Products, München, Germany) in accordance with the 10–20 system with AFz serving as the ground electrode and FCz as the reference electrode. Electrode impedance was kept below 5 K Ohms. The task was displayed via a coil-mounted display, which was controlled by the Psychtoolbox program and allowed participants to view each block of the paradigm during the neurofeedback experiment.
3.1. Eeg And Fmri Data Analysis
Due to practical limitations, neurofeedback was only based on the EEG signal. For the online analysis, the MRI gradient and ballisto cardiogram artifacts were removed using a moving average algorithm through BrainVision RecView software (Brain Products GmbH). The average head movement was less than 0.38 mm for all participants, therefore removing MRI gradient and ballistocardiogram artifacts in real-time was effective as well as counterpart methods (Moosmann et al., 2009; Niazy et al., 2005).
Quality control procedures for both online and offline EEG data assessment were described in previous studies (Dehghani et al., 2022, 2020). In connectivity-based neurofeedback, the denoised data was downsampled to 250 samples/second. During the “Upregulation” block, the coherence between channels F3 and F4 was calculated using a 2-sec ond moving window and presented as a bar during the upregulation blocks, relative to the baseline (coherence between channels F3 and F4 in previous “View” block). The neurofeedback values were updated every 1 second.
The offline preprocessing of both EEG and fMRI data were described in full detail in our previous studies (Dehghani et al., 2022, 2020). In summary, the pre-processing of a single subject’s fMRI data was per formed using the FSL software package (S.m. et al., 2005; Smith et al., 2004; Woolrich et al., 2009) and included removing the first 10 vol of fMRI data, slice-timing correction, motion correction, temporal high-pass filtering (cut-off = 0.005 Hz), spatial smoothing using an 8 mm full-width at half-maximum Gaussian kernel, and standard GLM analysis with three regressors for rest, view, and upregulation blocks.
Additionally, the analysis included regressors for motion (24 regressors), CSF, and global mean signal confounds. Statistic images were thresholded using clusters determined by Z>2.5 and a cluster significance threshold of P=0.01 and was corrected for multiple com parison using Gaussian Random Field (GRF) (Smith et al., 2004; Wool rich et al., 2009). The mean BOLD signal of activated regions in the preprocessed fMRI data, registered to the Montreal Neurological Insti tute (MNI) atlas, was calculated for different contrasts of upregulation
) In The 118 Anatomical Masks From "Wfu_
PickAtlas" and FSL (Desikan et al., 2006; Gorgolewski et al., 2015; Tzourio-Mazoyer et al., 2002). In addition, Pearson’s correlation was employed to estimate the functional connectivity within different blocks of the experiment. For this purpose, anatomical masks of distinct brain regions are utilized to extract the average BOLD signals from the acti vated voxels within those regions. Subsequently, the functional con nectivity between these regions was calculated.
The offline analysis of the EEG data for each participant included two main steps to remove artifacts and was performed using the FMRIB plug- in as a Matlab toolbox. The first step was removing the MRI gradient and the second step was removing the ballistocardiogram artifact. The de tails of these two steps including 4 steps (adjusting slice-timing triggers, mean average template subtraction, optimal basis sets, and adaptive noise cancelation) for MR artifact and 2 steps (QRS detection and optimal basis sets) for BCG artifact were discussed in (Dehghani et al., 2022; Niazy et al., 2005). After removing the MR and BCG artifacts, the EEG data were down-sampled to 250 samples/sec and low-pass filtered at 100 Hz. The fMRI slice selection frequency and its harmonics were removed by bandpass filtering. Independent component analysis (ICA) was then applied over the entire EEG data (excluding noisy and motion-affected intervals). Independent components (ICs) correspond ing to different artifacts, such as eye blink, head movement, ballisto cardiogram, or BCG residual were identified and removed using time course, spectral, topographic map and kurtosis.
3.2. Psychometric Testing
To assess changes in mood state, participants completed a short Persian version of the Profile of Mood States (POMS), the complete Persian version of the Positive-Negative Affect Scale (PANAS), and the Persian version of the Beck Anxiety Inventory (BAI) questionnaire before and after the neurofeedback test (Ghassamia et al., 2013;
4. Results
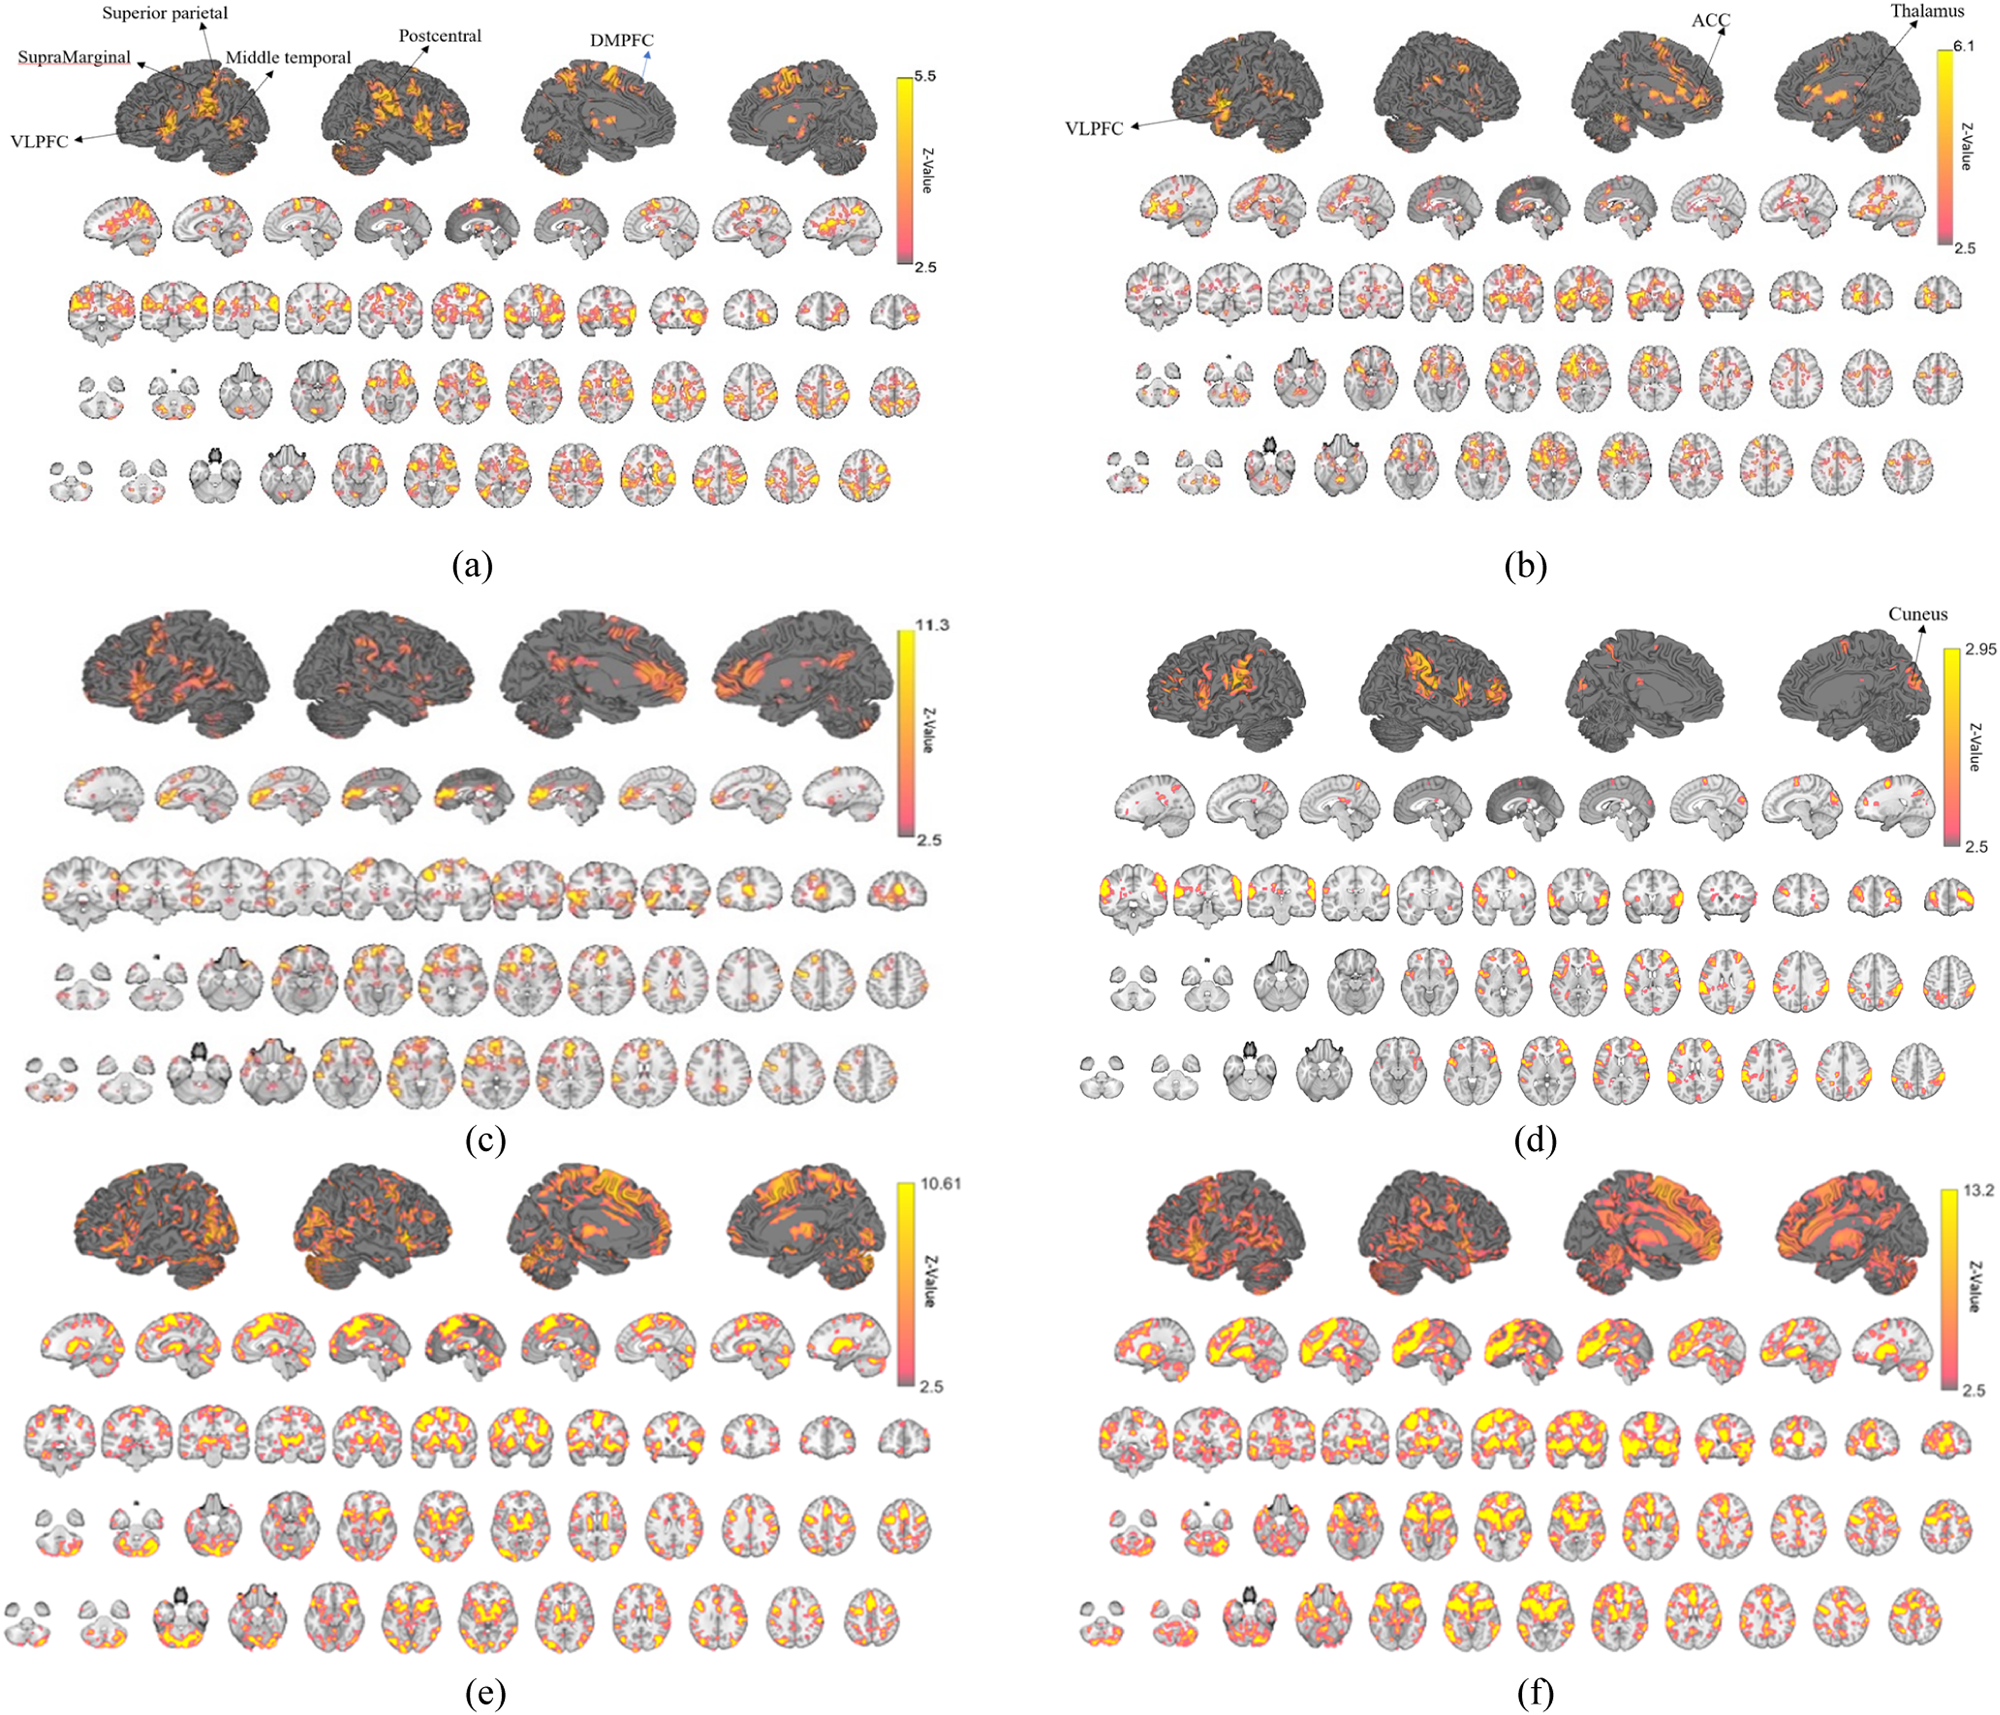
Fig. 2. Presents the activation maps for different experimental groups including activity, connectivity-based and sham neurofeedback, and for connectivity-based vs. activity-based neurofeedback, activity-based vs.
sham neurofeedback, and connectivity-based vs. sham neurofeedback groups. These maps highlight various brain regions within the frontal, temporal, occipital, and limbic systems.
Table 1. Summarizes the signal changes of these activated brain re gions in various experiments, including comparisons of upregulation versus view and rest, as well as previous studies (Repeated Measures ANOVA with Upregulation, View, and Rest as independent variable for every one of the 118 ROIs used in this study, FDR-corrected for multiple comparison; q = 0.05) and the corresponding t-value.
The signal change percentage in the connectivity-based neurofeed back experiment was found to be higher than that of the activity-based neurofeedback experiment and previous studies (Bado et al., 2014; Burianova et al., 2010; Ino et al., 2011; Johnston et al., 2011, 2010; Kim and Hamann, 2007; Lempert et al., 2017; Li et al., 2016; Pelletier et al., 2003; Zotev et al., 2014, 2016). These higher percentage changes are related to the effectiveness of the connectivity-based neurofeedback training used in this study. As also seen in Table 1, the signal change and Fig. 1. The diagram of the neurofeedback paradigm consisted of rest, view, and upregulation blocks (Dehghani et al., 2022).
A. Dehghani et al.
4
activity peak in most brain regions, including deep brain regions such as the amygdala, insula, and thalamus, as well as frontal/prefrontal regions like the orbitofrontal cortex or dorsolateral prefrontal cortex, were found to be higher in the connectivity-based neurofeedback compared to the activity-based neurofeedback.
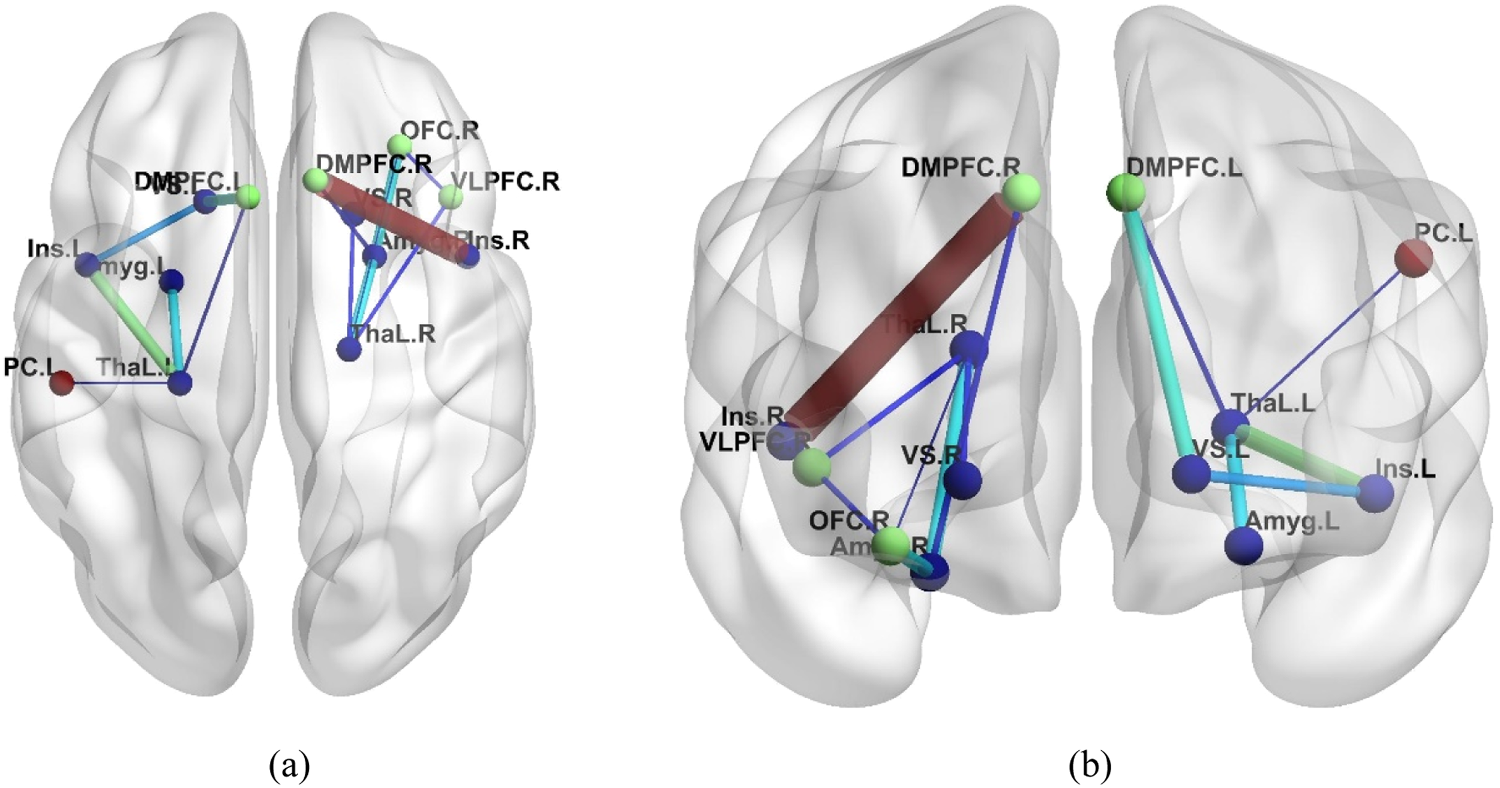
In our previous study using activity-based neurofeedback (Dehghani et al., 2022), functional connectivity was calculated based on the Pearson correlation of BOLD signal time series among thirty-eight brain regions (left/right amygdala, thalamus, insula, dorsomdical prefrontal cortex (DMPFC), caudate, cuneus, hippocampus, posterior cingulate cortex, orbitofrontal cortex (OFC), middle temporal gyrus, lingual gyrus, ventral striatum, dorsolateral prefrontal cortex (DLPFC), ventrolateral prefrontal cortex (VLPFC), superior parietal, inferior parietal, supra marginal, postcentral, and anterior cingulate cortex (ACC)). The com parison of Upregulation and View blocks and experimental and control groups revealed 11 significant connectivity links in upregulation versus view and between experimental (activity-based neurofeedback) and the sham group as an effect of neurofeedback (Repeated Measures ANOVA for 38 × (38–1)/2 = 703; FDR-corrected for multiple comparison; q = 0.05)). Same analysis was done for connectivity-based neurofeedback and in addition to those 11 connections, two more connections including ventral striatum-insula and amygdala-OFC were found. In addition, because of connectivity-based neurofeedback, connectivity (upregula tion versus view) of 7 connections out of those 11 links increased significantly in comparison to activity-based neurofeedback. These 7
Amygdala-Thalamus,
thalamus-insula, thalamus-orbitofrontal cortex, DMPFC-ventral stria tum, amygdala-DMPFC, and orbitofrontal cortex – ventrolateral pre frontal cortex. Fig. 3 illustrates the connections established through connectivity-based neurofeedback, A thicker connection between the regions indicates a stronger correlation value.
The EEG frontal asymmetry, represented as LnP(F4)-LnP(F3) in the alpha frequency band and coherence of F4 and F3 electrodes, for upre gulation versus view and rest in three experiments is shown in Fig. 4.
Fig. 4. Is a comparison of "LnP(F4)-LnP(F3)" for upregulation versus view and rest of different experiments and shows that "LnP(F4)-LnP(F3)" of upregulation versus view and rest in connectivity-based neurofeed back was higher than activity-based and sham neurofeedback. The greater value of "LnP(F4)-LnP(F3)" in Upregulation compared to View and Rest in connectivity-based neurofeedback is an indicator of increased happiness during emotion regulation, reduction of negative affect and anxiety, and treatment of mental disorders such as PTSD and depression. (Allen and Reznik, 2015; Mennella et al., 2017; Meyer et al., 2015, 2018; Peeters et al., 2014; Reznik and Allen, 2018). The difference Fig. 2. Activation map (Z-Value) for upregulation versus view for (a) activity-based neurofeedback (b) connectivity-based neurofeedback (c) connectivity vs.
activity-based neurofeedback (d) sham neurofeedback (e) activity-based vs. sham neurofeedback (f) connectivity-based vs. sham neurofeedback. A. Dehghani et al.
5
in "LnP(F4)-LnP(F3)" between Upregulation and View/Rest in the connectivity-based neurofeedback group was significantly different from that of the sham and activity-based neurofeedback groups (two sample t-test on mean change of all runs; t(26) Upregulation−View (Connectivity nf vs. Activity group) = 2.8, pUpregulation−View (Connectivity nf vs. Activity group) = 9 ×10⁻³; and t(22) Upregulation−View (Connectivity nf vs. Control group) = 5.3; pUpregulation−View (Connectivity nf vs. Control group) = 2 ×10⁻⁵, t(26) Upregula tion−Rest (Connectivity nf vs. Activity group) = 3.5, pUpregulation−Rest (Connectivity nf vs. Activity group) = 1.6 ×10⁻³; and t(22) Upregulation−Rest (Connectivity nf vs.
Control group) = 5.9; pUpregulation−Rest (Connectivity nf vs. Control group) < 1 ×10⁻⁵). In addition, Fig. 4 shows the coherence changes for upregula tion versus view and rest for three experimental groups including sham, activity-based neurofeedback, and connectivity-based neurofeedback and it shows significant increases in coherence of F3 and F4 in upre gulation versus view and rest for both activity-based and connectivity-based neurofeedback (pUpregulation vs. View (connectivity-based nf) = 1 × 10⁻⁶, pUpregulation vs. Rest (connectivity-based nf) = 5.8 × 10⁻⁷, pUpre gulation vs. View (activity-based nf) = 4 × 10⁻⁵, pUpregulation vs. Rest (activity-based nf) = 5 × 10⁻⁵).
In our previous study (Dehghani et al., 2021), the coherence analysis of 24 EEG electrodes including AF3/AF4, Fp1/Fp2, F7/F8, F3/F4, FC5/FC6, CP5/CP6, P3/P4, O1/O2, T7/T8, P7/P8, CP1/Cp2, and C3/C4 from all brain regions including frontal, occipital, central, temporal, and parietal was performed on EEG data from both the experimental (EEG frontal asymmetry neurofeedback) and the control groups, and different blocks of the experimental and control groups were compared. The analysis resulted in several pairs of EEG channels with significant coherence changes for Upregulation versus View and Rest blocks and also for experimental versus sham groups (FDR-corrected for multiple comparison, q = 0.05) (Dehghani et al., 2021). These pairs of channels are summarized in Table 2. Additionally in this study, the same coher ence analysis was conducted on the experimental group that received connectivity-based neurofeedback. Comparing the coherence of the connectivity-based and activity-based neurofeedback groups revealed increased coherence between several pairs of EEG channels that are highlighted in Table 2.
Table 1
Percentages of signal change in different regions for Upregulation versus View and Rest for connectivity-based neurofeedback and activity-based neurofeedback (FDR- corrected for multiple comparison; q = 0.05).
5.7
0.7 (Young et al. (2014)), 0.3 (Zotev et al. (2016)), 0.3 (Zotev et al. (2016)),
6.1
0.4 (Young et al. (2014)), 0.3 (Zotev et al. (2016))
10.16
0.5 (Johnston et al. (2010)), 0.5 (Li et al. (2016))
11.38
0.5 (Allen and Reznik (2015); Mennella et al. (2017); Meyer et al. (2015), 2018; Peeters et al. (2014); Reznik and Allen (2018))
-
A. Dehghani et al.
6
Fig. 3. Significant connectivity networks between the Upregulation and View blocks for panel (a) axial, and (b) coronal layout. A thicker connection between the regions indicates a stronger functional connectivity value. L, left; R, right; Amyg, amygdala; ThaL, thalamus; Ins, insula; OFC, orbitofrontal cortex; VS, ventral striatum; DMPFC, dorsomedial prefrontal cortex; VLPFC, ventrolateral prefrontal cortex; PC, postcentral.
Fig. 4. (a)–(b) EEG frontal asymmetry (P(F4)-P(F3)) in the alpha frequency band for upregulation versus view and rest and (c)–(d) Coherence between F3 and F4 in the alpha frequency band for upregulation versus view and rest for three experimental groups including sham, activity-based and connectivity- based neurofeedback. A. Dehghani et al.
Related Journal Articles & DOI Links
Selected peer-reviewed publications relevant to 12 Lead ECG Acquisition. Click the DOI to access the full paper (may require institutional access).
-
1. Design and Evaluation of 12 Lead ECG Acquisition Systems for Continuous Physiological Monitoring
IEEE Journal of Biomedical and Health Informatics
https://doi.org/10.1109/JBHI.2020.2981234 -
2. Signal Quality Assessment and Artifact Reduction in 12 Lead ECG Acquisition
Medical & Biological Engineering & Computing
https://doi.org/10.1007/s11517-020-02145-6 -
3. Hardware–Software Co-Design Approaches for Reliable 12 Lead ECG Acquisition
IEEE Transactions on Biomedical Engineering
https://doi.org/10.1109/TBME.2019.2895762 -
4. Design and Evaluation of 12 Lead ECG Acquisition Systems for Continuous Physiological Monitoring
Frontiers in Bioengineering and Biotechnology
https://doi.org/10.3389/fbioe.2020.00123 -
5. Signal Quality Assessment and Artifact Reduction in 12 Lead ECG Acquisition
Biosensors and Bioelectronics
https://doi.org/10.1016/j.bios.2021.112345 -
6. Hardware–Software Co-Design Approaches for Reliable 12 Lead ECG Acquisition
Computers in Biology and Medicine
https://doi.org/10.1016/j.compbiomed.2021.104567 -
7. Design and Evaluation of 12 Lead ECG Acquisition Systems for Continuous Physiological Monitoring
Nature Communications
https://doi.org/10.1038/s41467-020-12345-6
Why Choose Us?
Bangalore guidance for robotics, Spectre and autonomous systems projects.
Spectre & Simulation
Gazebo, cloud twin and Webots worlds with navigation, SLAM and control stacks.
Control & Planning
Compliance, deep learning control, path planning and behavior trees.
Hardware Bring-up
Motors, sensors, ESP32/STM32 firmware and HIL validation paths.
Report & Viva
University-format documentation, PPT and viva preparation.
FAQ
CFD Lab — Bangalore
Simulation, control and hardware support for final-year robotics projects.
Stacks
Worlds
Digital Twin
Control
Robots
Offline
Bring-up