System For Doppler Imaging Of Umbilical Artery
Chun Kit Wong1, Manxi Lin1, Alberto Raheli1, Zahra Bashir2, Morten Bo Søndergaard Svendsen2, Martin Grønnebæk Tolsgaard2, Aasa Feragen1, and
2 Cames Rigshospitalet
Abstract. Examination of the umbilical artery with Doppler ultrasonog- raphy is performed to investigate blood supply to the fetus through the umbilical cord, which is vital for the monitoring of fetal health. Such examination involves several steps that must be performed correctly: identifying suitable sites on the umbilical artery for the measurement, acquiring the blood flow curve in the form of a Doppler spectrum, and ensuring compliance to a set of quality standards. These steps rely heavily on the operator’s skill, and the shortage of experienced sonographers has thus created a demand for machine assistance. In this work, we propose an automatic system to fill the gap. By using a modified Faster R-CNN network, we obtain an algorithm that can suggest locations suitable for Doppler measurement. Meanwhile, we have also developed a method for assessment of the Doppler spectrum’s quality. The proposed system is validated on 657 images from a national ultrasound screening database, with results demonstrating its potential as a guidance system.
Keywords: Fetal Ultrasound · Umbilical Artery · Doppler Imaging
Introduction
Due to its non-invasive nature, ultrasound is widely used for routine monitor- ing of fetal health. In the third-trimester, ultrasound screenings are utilized to monitor potential growth restrictions of the fetus and the blood supply through the umbilical cord (UC). These screenings examine several anatomical standard planes formally defined in guidelines developed by the International Society of Ultrasound in Obstetrics and Gynecology (ISUOG), which aims to ensure ac- curate measurement. In practice, conducting such examinations while adhering to the guidelines is technically demanding and often relies on the experience of the operators. However, due to the shortage of sonographers, third-trimester screenings are often performed by clinicians not specialized in ultrasound ac- quisition . To assist these clinicians in acquiring high quality images, this paper presents an automatic system for operator guidance in assessment of the
2
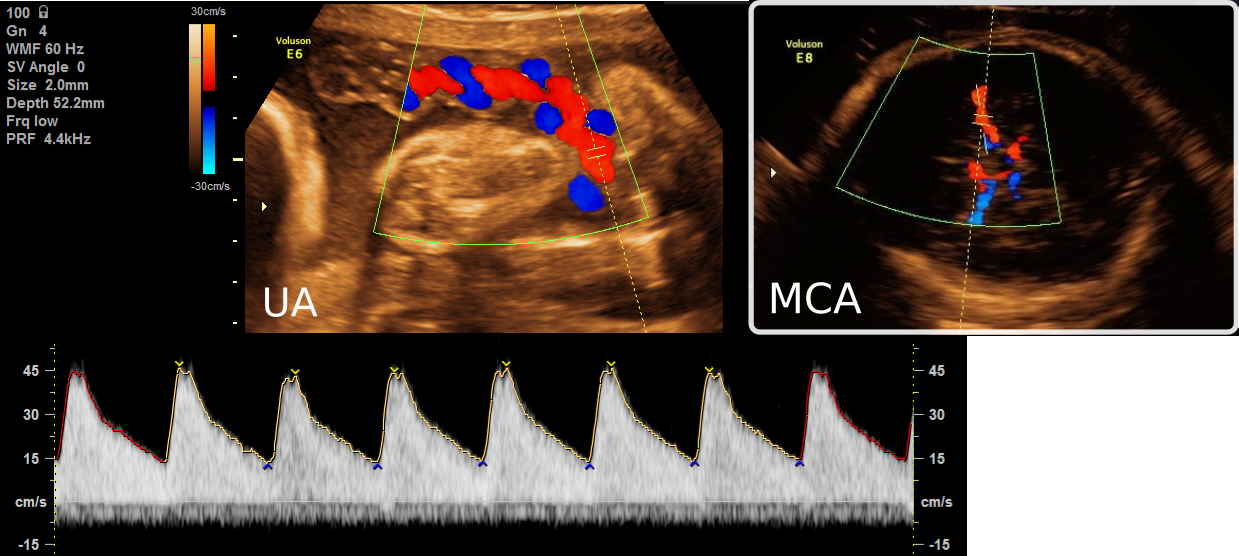
Wong et al. Fig. 1: Examples of two fetal standard planes in Doppler ultrasound. Left: Um- bilical Artery (UA) including the spectral Doppler waveform. Right: Middle Cerebral Artery (MCA). Note how on the MCA, the vessel is running parallel to the long axis of the vessel’s segmentation, making angle estimation from seg- mentation straightforward. In UA, however, the vessels are usually intertwined, which means the angle cannot be trivially inferred from the segmentation.
umbilical artery (UA), which is a standard plane crucial for monitoring of the fetal blood supply, but has rarely been studied in existing works. Examination of blood flow with ultrasound is performed over two steps: iden- tifying and placing a measurement gate on a suitable site with color Doppler imaging, followed by measuring the blood flow curve in the form of spectral Doppler waveform with pulsed Doppler (see Fig. 1). These waveforms, which allow assessment of UA as well as the middle cerebral artery (MCA), play an im- portant role in the third-trimester ultrasound screening . A number of machine learning techniques have been used to support analysis of Doppler waveforms.
Multiple works have explored the automatic diagnosis on waveform images acquired by clinicians. Hoodbhoy et al. identified fetuses at increased risk of adverse perinatal outcomes with multiple kernel learning. Naftali et al. built a support vector machine, a K-nearest model, and a logistic regression model for identifying unseen UC abnormalities from the waveforms. While these studies show a clear potential for AI-based diagnosis, the studies were conducted using waveforms acquired by experienced clinicians. As noted by Necas , even with the availability of guidelines, mistakes are still commonly observed in practice.
Meanwhile, acquisition of an optimal Doppler waveform requires consistent, manual adjustment of various parameters, which increases the mental load on the operator . This motivates research in automation of the ultrasound acquisi- tion procedure. In this direction, MCANet is developed to propose positions for measurement gate placement. In contrast to MCANet, we consider Doppler measurement at the UA, and are, to the best of our knowledge, the first to address this problem. In addition, we also introduce a study protocol for assess- An Automatic Guidance and QA System for Doppler Imaging of UA
3
Table 1: ISUOG guidelines on using Doppler ultrasound in obstetric
Anatomical Site
the Doppler signal must be measured in a free loop of the UC Angle of insonation the angle to the blood flow should be less than 30◦, indicating
Image Clarity
the resulting Doppler signal should be clear, without artifacts,
Sweep Speed
resulting Doppler signal should have 3-10 waveforms visible
Dynamic Range
in the resulting Doppler signal, the waveforms should occupy
More Than 75% Of The Y-Axis
ing the quality of the acquired Doppler waveforms. In summary, we contribute with 1) an automatic detection of appropriate sites for UA Doppler measure- ment, while taking both location and insonation angle into account, and 2) an automatic evaluation of the Doppler waveforms to ensure sufficient quality.
Method
We propose an image analysis pipeline that is based directly on the ISUOG guidelines (see Table 1). The first two criteria relate to the presentation of UA in the chosen ultrasound plane, whereas the remaining three criteria relate to the quality of the resulting waveforms. As such, the ISUOG criteria align well with a 2-step process. First, we assist the ultrasound operator by giving feedback on the presentation of the UA and suggesting a suitable gate location for measuring the Doppler spectrum. Next, we consider the resulting spectrum, either accepting or rejecting the combination of ultrasound plane and gate. In this way, we ensure that the examination maintains a high quality, while also giving the operator feedback on potential problems in the image acquisition.
2.1
Deep Learning-based Processing of Color Doppler Images As a first step in our pipeline, we need to identify a vessel, and a gate location within the vessel. This vessel needs to be an artery (as opposed to a vein) satis- fying the first two ISUOG criteria. While it might seem trivial to segment vessels that are colored red and blue and measure their angle, Fig. 1 illustrates how this problem is significantly harder for the UA, where the vessel twists and turns around itself, than it is for the MCA. We tackle this as a modified object de- tection problem where, instead of just detecting potential gate locations within vessels as being acceptable or not, we add a regression head to the detection algorithm in order to encode its angle (see Fig. 2).
Modifying Faster R-CNN’s head to predict vessel angle at proposed locations. We base our UA gate location algorithm on the Faster R-CNN object detection algorithm . Faster R-CNN first generates a feature map using a backbone
4
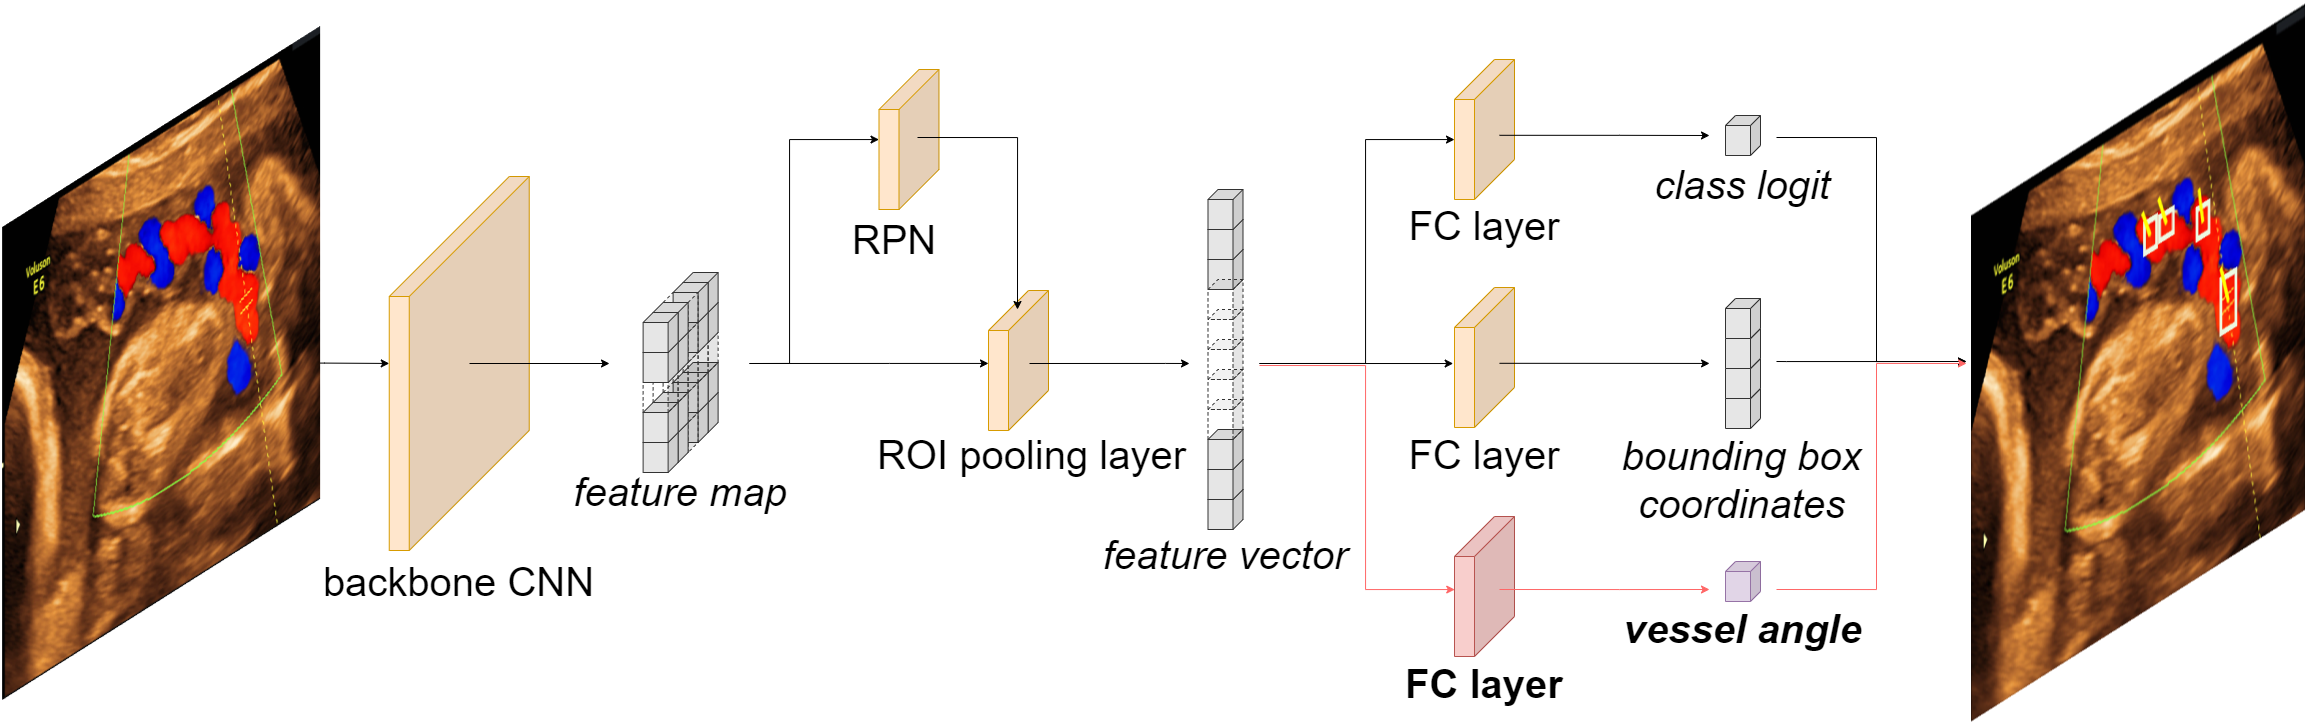
Wong et al. Fig. 2: Network architecture: Faster R-CNN with an extra sibling FC layer branch added for vessel angle prediction.
CNN network, which is fed to a Region Proposal Network (RPN) to propose candidate regions of interest (ROIs). Then, an ROI pooling layer is employed to extract, pool, and flatten features corresponding to the proposed ROIs, which are finally passed to two sibling branches of fully connected (FC) layers for clas- sification and bounding box regression of the proposed ROIs. The loss function
I ) (1)
where pi is the predicted probability that the i-th proposed ROI at the predicted
I As The Corresponding Ground-
truths. The log loss Lcls is normalized by the batch size Ncls, and the smooth L1 loss Lreg by the number of proposed ROIs Nreg, with λ balancing the terms. In our setting, we want to detect potential gate locations that satisfy both the anatomical site and angle requirements of the ISUOG criteria. To achieve this, the standard classification branch predicts whether the anatomical site criterion is fulfilled. Then, we enrich the Faster R-CNN model with an extra sibling FC layer branch to predict the underlying vessel’s angle at each proposed ROI.
To train this modified model, we included another term in Eq. 1 to regress the predicted angle against ground truth annotations (see Fig. 4a): L({pi}, {ti}, {ai}) = LF asterRCNN({pi}, {ti}) + µ
Where Ai And A∗
i are the predicted and ground truth angle of the i-th proposed ROI, and µ is another balancing factor. λ and µ are set to 1 and 10, respectively. Locating source of ultrasound beam. The vessel angle estimated using our modi- fied Faster-RCNN network indicates the vessel’s direction (see Fig. 4b). However, the angle of insonation needed to assess the second ISUOG criterion refers to the angle of the vessel with respect to the direction of the ultrasound beam.
Hence, to assess whether the angle is acceptable and give suitable feedback to the operator, we need to determine the direction of the ultrasound beam and use it to calibrate the angle prediction from the network.
An Automatic Guidance and QA System for Doppler Imaging of UA
(B) Detected Line (Red) And Arc (Blue)
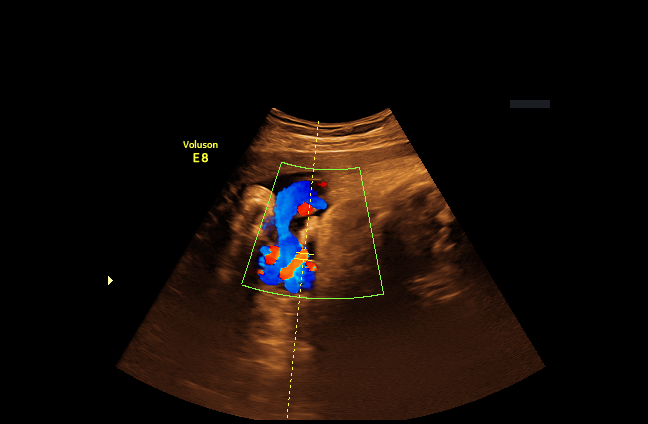
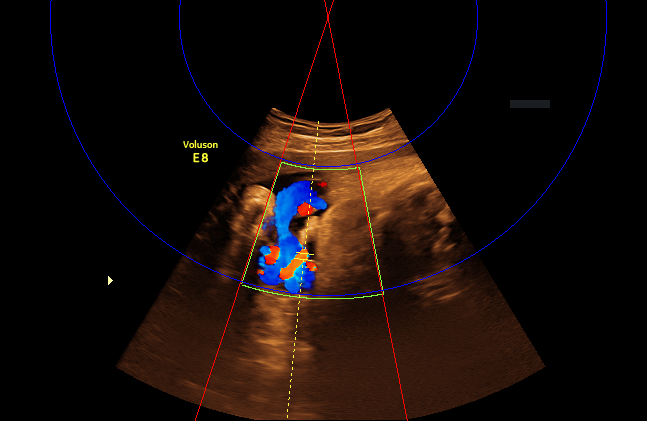
Fig. 3: Locating source of the ultrasound beam by using the green Doppler box. We begin with determining the direction of the ultrasound beam by utilizing the green Doppler box, which becomes active during color Doppler acquisition (see Fig. 3a). A binary mask of the green Doppler box is first obtained by color thresholding on the RGB pixels, followed by enhancing the mask using a water- shed transform . Next, a Hough line detection algorithm is used to identify the two radial line segments on each side of the box. The ultrasound source is located at the intersection between the two line segments. As an extra step to prevent erroneous detection, we verify that we are able to detect the two arc lines with Hough circle detection when the center location is constrained to be at the intersection point from the previous two Hough lines (see Fig. 3b).
Determining the angle of insonation. Next, from the identified location of the ultrasound source, it is straightforward to compute a vector map pointing at the direction of the ultrasound source from each pixel (see Fig. 4c). By expressing the vessel angle predicted by the network as another vector, the angle of insonation can be easily calculated using the law of cosine.
Based on the above, we obtain a detection algorithm that proposes, to the operator, gate locations fulfilling both anatomical and angle requirements. This algorithm is developed using images acquired with different models of GE scan- ners. Adjustments for cross-vendor applications is likely necessary, but we expect the method to work equally well, since it is a convention in Doppler ultrasound to use variations of red and blue while encoding flow directions .
Processing Of Pulsed Doppler Spectrum Images
From the suggested gate locations (see Sec. 2.1), an operator could choose the best one for spectrum acquisition with pulsed Doppler. Next, we present our processing to assess the quality of the resulting spectrum.
Segmentation of the Doppler Spectrum. Prior to analyzing the Doppler spectrum, all irrelevant visual confounders, such as tracing lines indicating measurements
Related Journal Articles & DOI Links
Selected peer-reviewed publications relevant to 12 Lead ECG Acquisition. Click the DOI to access the full paper (may require institutional access).
-
1. Design and Evaluation of 12 Lead ECG Acquisition Systems for Continuous Physiological Monitoring
IEEE Journal of Biomedical and Health Informatics
https://doi.org/10.1109/JBHI.2020.2981234 -
2. Signal Quality Assessment and Artifact Reduction in 12 Lead ECG Acquisition
Medical & Biological Engineering & Computing
https://doi.org/10.1007/s11517-020-02145-6 -
3. Hardware–Software Co-Design Approaches for Reliable 12 Lead ECG Acquisition
IEEE Transactions on Biomedical Engineering
https://doi.org/10.1109/TBME.2019.2895762 -
4. Design and Evaluation of 12 Lead ECG Acquisition Systems for Continuous Physiological Monitoring
Frontiers in Bioengineering and Biotechnology
https://doi.org/10.3389/fbioe.2020.00123 -
5. Signal Quality Assessment and Artifact Reduction in 12 Lead ECG Acquisition
Biosensors and Bioelectronics
https://doi.org/10.1016/j.bios.2021.112345 -
6. Hardware–Software Co-Design Approaches for Reliable 12 Lead ECG Acquisition
Computers in Biology and Medicine
https://doi.org/10.1016/j.compbiomed.2021.104567 -
7. Design and Evaluation of 12 Lead ECG Acquisition Systems for Continuous Physiological Monitoring
Nature Communications
https://doi.org/10.1038/s41467-020-12345-6
Why Choose Us?
Bangalore guidance for robotics, Spectre and autonomous systems projects.
Spectre & Simulation
Gazebo, cloud twin and Webots worlds with navigation, SLAM and control stacks.
Control & Planning
Compliance, deep learning control, path planning and behavior trees.
Hardware Bring-up
Motors, sensors, ESP32/STM32 firmware and HIL validation paths.
Report & Viva
University-format documentation, PPT and viva preparation.
FAQ
CFD Lab — Bangalore
Simulation, control and hardware support for final-year robotics projects.
Stacks
Worlds
Digital Twin
Control
Robots
Offline
Bring-up