And Information
Brian Suffoletto, M.D.
School Of Medicine
Tammy Chung, Ph.D.
School Of Medicine
Hassan Karimi, Ph.D.
And Information
Abstract—Phone sensors could be useful in assessing changes in gait that occur with alcohol consumption. This study determined (1) feasibility of collecting gait-related data during drinking occasions in the natural environment, and (2) how gait-related features measured by phone sensors relate to estimated blood alcohol concentration (eBAC). Ten young adult heavy drinkers were prompted to complete a 5-step gait task every hour from 8pm to 12am over four consecutive weekends. We collected 3-xis accelerometer, gyroscope, and magnetometer data from phone sensors, and computed 24 gait-related features using a sliding window technique. eBAC levels were calculated at each time point based on Ecological Momentary Assessment (EMA) of alcohol use. We used an artificial neural network model to analyze associations between sensor features and eBACs in training (70% of the data) and validation and test (30% of the data) datasets.
We analyzed 128 data points where both eBAC and gait-related sensor data was captured, either when not drinking (n=60), while eBAC was ascending (n=55) or eBAC was descending (n=13). 21 data points were captured at times when the eBAC was greater than the legal limit (0.08 mg/dl). Using a Bayesian regularized neural network, gait-related phone sensor features showed a high correlation with eBAC (Pearson’s r > 0.9), and >95% of estimated eBAC would fall between -0.012 and +0.012 of actual eBAC. It is feasible to collect gait-related data from smartphone sensors during drinking occasions in the natural environment.
Sensor-based features can be used to infer gait changes associated with elevated blood alcohol content.
I. Introduction
Acute alcohol intoxication is associated with numerous health risks. For example, impaired driving due to alcohol was implicated in 28% of the 38,000 deaths from motor vehicle accidents in the US in 2016 . These consequences largely stem from alcohols detrimental effects on psychomotor performance . Compounding this risk are impaired decision- making and lack of awareness of the degree of alcohol- related impairments during drinking episodes . Strategies to measure alcohol-related psychomotor impairments and provide real-time feedback to individuals could deter involvement in activities that require psychomotor function (i.e., driving), thus reducing likelihood of injury .
Using alcohol consumption as a surrogate for psychomotor impairment can be prone to either underestimations (e.g. when individuals do not report alcohol consumption accurately ) or over-estimations (e.g. in individuals with high tolerance to the effects of alcohol ). Therefore, asking individuals to input drinks in real time may not be the most accurate estimate of psychomotor impairment. One measure of psychomotor per- formance that is particularly sensitive to alcohol is gait. Gait requires coordination of multiple sensory and motor systems.
Both postural stability and gait are sensitive to blood alcohol concentration (BAC) levels. Although law enforcement professionals have used subjective performance on a heel-to- toe tandem gait task as a field sobriety test for years, there is no current process to objectively measure aspects of gait during drinking occasions in the natural environment.
The rapid growth of smartphone ownership and stan- dard inclusion of accelerometer and gyroscope sensors within phones suggests that these devices could be useful to ob- jectively measure gait impairment during drinking episodes.
Researchers have begun to model the associations between gait abnormalities detected using smartphone sensors and either real or simulated alcohol consumption , , but no one has determined if it is feasible to collect standardized gait data in the natural drinking environment from at-risk individuals, nor the association of gait features with BAC levels. Answers to these questions are critical if sensor based data will be used to provide feedback that is specific to drinking risk level.
The aim of this project was to determine (1) feasibility of collecting gait-related data during a brief gait task during drinking occasions from at-risk young adults in the natural en- vironment, and (2) how gait-related features measured through phone sensors relate to estimated blood alcohol concentration (eBAC). To accomplish these aims, we designed an iPhone app (DrinkTRAC) to collect smartphone sensor-based data on gait (3-axis accelerometer, gyroscope, magnetometer) and ecological momentary assessment (EMA) measures of self- reported number of drinks consumed each hour, from 8pm to 12am, during weekend evenings (Fridays and Saturdays).
We enrolled 10 young adults with a history of heavy drinking in a repeated-measures study to provide smartphone sensor and self-report data over a period of four consecutive weeks.
Arxiv:1711.03410V2 [Cs.Cy] 13 Nov 2017
We used a Bayesian regularized neural network (BRNN) to perform regression analysis to examine the association of sensor data with eBACs. Results from this work could be useful in designing effective prevention interventions to reduce risky behaviors during periods of alcohol intoxication.
A. Participants
A convenience sample of young adults (aged 21–26 years) between February 19 and May 9, 2016 were recruited. A total of 28 medically stable ED patients who were not seeking treatment for substance use, not intoxicated, and who were going to be discharged to home, were approached by research staff. Among those eligible to be approached, 23 patients provided consent to complete an alcohol use severity screen.
Those who reported recent hazardous alcohol consumption based on an Alcohol Use Disorder Identification Test for Consumption (AUDIT-C) score of ≥3 for women or ≥4 for men and who drank primarily on weekends were eligible for participation. We excluded those who reported any medical condition that resulted in impaired thinking or memory or gait, those who reported past treatment for alcohol use disorder, and those without an iOS phone. A total of 10 participants met the study enrolment criteria. All participants completed informed consent protocols prior to study procedures and were provided with resources for alcohol treatment.
And
professional-appearing modular builds that incorporate timed psychomotor tasks. The DrinkTRAC app contained the fol- lowing components: (1) timed electronic notifications, (2) a home screen, (3) a baseline questionnaire, (4) a calen- dar displaying completed tasks, (5) timed EMA, and (6) timed psychomotor tasks (including a 5-step gait task).
The gait task was taken from the mPower GitHub site (https://github.com/ResearchKit/mPower). We altered the gait task to take less than 45 seconds to optimize completion and
179 (35)
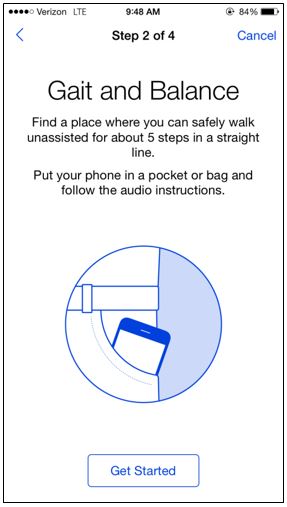
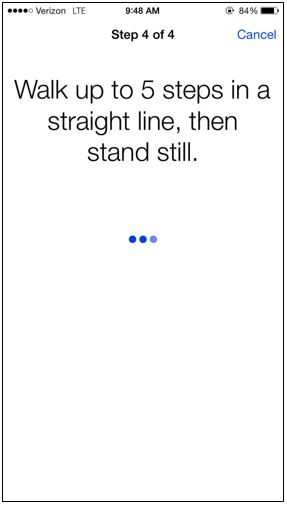
reduce potential for disruptions that could interfere with task performance. Prior to each gait task, participants were instructed to walk in a straight line for 5 steps. We advised participants not to continue if they felt that they could not safely walk 5 steps in a straight line unassisted. If participants clicked next, they were shown a picture of a phone and told: Find a place where you can safely walk unassisted for about 5 steps in a straight line, followed by the text: Put the phone in a pocket or bag and follow the audio instructions. If you do not have somewhere to put the phone, keep it in your hand. When the participant clicked Get Started, the app displayed a timer and played an audio recording of a voice counting down from 5 to 1. If the audio option was turned on, participants heard Walk up to 5 steps in a straight line, then stand still. When the task was completed, participants were presented with a figure of their completion rates for the day. Figure 1 shows DrinkTRAC app screen shots of the gait task.
C. Procedure
In the ED, participants uploaded the DrinkTRAC app to their phone. The research associate was present to ensure understanding and to observe compliance with instructions on the initial trial of the app’s tasks, which were conducted in the ED. We instructed participants to refrain from any non- drinking substance use (excluding cigarette use) during the sampling days. We also informed participants that they would receive $10 for completing the baseline survey and app-based tasks in the ED, $10 for completing the exit survey at four weeks, and $1 per completed EMA (up to an additional $40).
Over four consecutive Fridays and Saturdays, every hour from 8pm to 12am, participants were sent an electronic notification to log in to the DrinkTRAC app and complete the tasks. We chose to sample data on weekend evenings, given that this is a time when young adults typically drink alcohol . We collected data hourly from 8pm to 12am on those nights, with an intention of capturing both the ascending (when eBAC is rising) and descending (when eBAC is decreasing) limbs of alcohol intoxication. We used fixed hourly assessment times, given that they would provide a predictable framework for participants and would allow us to more easily calculate eBAC changes over the course of the evening.
D. Data Processing
1) Estimated Blood Alcohol Concentration: We calculated eBAC during each hour when data was available using a formula created by Matthews and Miller . This formula was found to have a significantly stronger intraclass correlation with breath alcohol concentrations (criterion standard) than did other equations when measured after an uncontrolled episode of drinking .
2) Sensor Data Feature Extraction: We collected 3-axis acceleration and angular velocity data, sampled at a frequency of 100 Hz for 30 seconds during the tandem-gait task. We extracted features from sensors that can describe the properties
(B)
Fig. 1: DrinkTRAC app screenshots of the tandem gait task of gait. We consider four features, i.e., mean, standard devi- ation, correlation, and energy. Energy is a feature extracted from a signal through a Fast Fourier Transformation (FFT) from time domain into frequency domain. Energy feature can reveal how energy in the signal is distributed over its various frequency components. Energy is the sum of the squared discrete FFT coefficient magnitudes of the signal. The sum was divided by the length of the window for normalization.
In a formal notation, if x1, x2, · · · are the FFT components of
. Energy Value Differs
for each activity; therefore, it can be used to determine discrepancies among certain movement patterns . In order to study the properties of each signal, we broke up time into smaller segments using a sliding window, where in each new ”window” has 50% overlap with the previous one, and then calculations are performed on the ”windowed” signal.
All measurements are in three dimensions; thus, resulting in a total of 24 possible features. The efficiency of these features for characterizing gait has been discussed in (Bao and Intille 2004 , Ravi et al. 2005 ).
We removed the effects of gravity in order to measure ac- celeration of the device (linear acceleration). An accelerometer is subject to dynamic (or external) and static (gravity) acceler- ations. Therefore, in order to measure the real acceleration of the device, the contribution of the static acceleration which is the effect of Earth’s gravity on the device must be removed.
Hence, for the purpose of obtaining linear acceleration, other sensors such as gyroscope and magnetometer were utilized to derive accurate values of linear acceleration by applying a high-pass filter. We also measured the attitude of the device, which is the computed device orientation using the accelerom- eter, magnetometer, and gyroscope. These values yield the Euler angles of the device.
E. Bayesian Regularized Neural Network (BRNN) for eBAC
Regression
We applied a neural network model to estimate the asso- ciation between sensor-based gait features and eBAC. One of the advantages of using neural networks for regression and predicting values is that it uses a nonlinear sigmoid function in a hidden layer, which enhances its computational flexibility, as compared to a standard linear regression model . We first used multilayer perceptron (MLP), a BRNN, to model the nonlinear relationships between the extracted gait features and the output (eBAC value), with nonlinear transfer functions. A schematic diagram of our MLP structure can be seen in Appendix. We then tested the BRNN on a training set, and computed the corresponding parameters of the network, such as weights and learning rate. We used the Levenberg- Marquardt optimization algorithm to find the minimum of the multivariate function . We compared the performance of MLP with support vector machine (SVM) and linear regression by examining correlation coefficient, mean absolute error, root mean squared error, relative absolute error, and root relative squared error. We then examined the correlation between MLP model-predicted eBAC values based on sensor features and actual eBAC values. We examined a histogram of errors between predicted eBAC and actual eBAC to determine frequency of outliers and potential misclassification of gait impairment relation to eBAC.
Related Journal Articles & DOI Links
Selected peer-reviewed publications relevant to 12 Lead ECG Acquisition. Click the DOI to access the full paper (may require institutional access).
-
1. Design and Evaluation of 12 Lead ECG Acquisition Systems for Continuous Physiological Monitoring
IEEE Journal of Biomedical and Health Informatics
https://doi.org/10.1109/JBHI.2020.2981234 -
2. Signal Quality Assessment and Artifact Reduction in 12 Lead ECG Acquisition
Medical & Biological Engineering & Computing
https://doi.org/10.1007/s11517-020-02145-6 -
3. Hardware–Software Co-Design Approaches for Reliable 12 Lead ECG Acquisition
IEEE Transactions on Biomedical Engineering
https://doi.org/10.1109/TBME.2019.2895762 -
4. Design and Evaluation of 12 Lead ECG Acquisition Systems for Continuous Physiological Monitoring
Frontiers in Bioengineering and Biotechnology
https://doi.org/10.3389/fbioe.2020.00123 -
5. Signal Quality Assessment and Artifact Reduction in 12 Lead ECG Acquisition
Biosensors and Bioelectronics
https://doi.org/10.1016/j.bios.2021.112345 -
6. Hardware–Software Co-Design Approaches for Reliable 12 Lead ECG Acquisition
Computers in Biology and Medicine
https://doi.org/10.1016/j.compbiomed.2021.104567 -
7. Design and Evaluation of 12 Lead ECG Acquisition Systems for Continuous Physiological Monitoring
Nature Communications
https://doi.org/10.1038/s41467-020-12345-6
Why Choose Us?
Bangalore guidance for robotics, Spectre and autonomous systems projects.
Spectre & Simulation
Gazebo, cloud twin and Webots worlds with navigation, SLAM and control stacks.
Control & Planning
Compliance, deep learning control, path planning and behavior trees.
Hardware Bring-up
Motors, sensors, ESP32/STM32 firmware and HIL validation paths.
Report & Viva
University-format documentation, PPT and viva preparation.
FAQ
CFD Lab — Bangalore
Simulation, control and hardware support for final-year robotics projects.
Stacks
Worlds
Digital Twin
Control
Robots
Offline
Bring-up