Validation of HRV Studio: A Transparent and Quality-Control-Aware
Author List:
Cyrus Mexon Evrard Djindot, Faliang Liu, Sylvain Laborde, Yinjia Zhang, Jessie Chen, Ming
Abstract
Background and Objective: Reproducibility of heart rate variability (HRV) analysis is heavily hindered by "black-box" commercial platforms and complex code-based libraries, coupled with extreme sensitivity to pre-processing conventions. To bridge this gap, we developed and validated HRV Studio—an open-source PyQt6-based desktop application that integrates an interactive, audited graphical user interface (GUI) with a transparent, automated quality-control (QC) layer to support reproducible physiological research.
Methods: We validated the platform using a rigorous, six-stage framework: (1) large-scale numerical agreement against NeuroKit2 using normal-sinus-rhythm recordings; (2) targeted benchmarking against Kubios on a curated 44-recording subset; (3) alternative spectral- method comparison (Welch, FFT, autoregressive); (4) synthetic robustness testing under controlled noise, missed beats, and ectopy; (5) recording-duration sensitivity analysis (30 s to 10 min); and (6) software stress-testing using the MIT-BIH Arrhythmia Database to evaluate automated QC warning performance.
Results: Under harmonized short-term segment-linear settings, HRV Studio demonstrated strong agreement with NeuroKit2 across complementary HRV domains. In the primary five- minute comparison, median relative errors were 1.35% for 𝐿𝐹, 0.18% for 𝐻𝐹, 1.41% for 𝐿𝐹/𝐻𝐹, 0.42% for 𝐿𝐹𝑛𝑢, and 0.81% for 𝐻𝐹𝑛𝑢, while total power (13.57%) and 𝑉𝐿𝐹 (37.79%) remained more convention-sensitive. Time-domain indices showed excellent agreement for RMSSD and SDNN (median relative errors <0.01%), while nonlinear Poincaré descriptors SD1 and SD2 also demonstrated high consistency under matched conditions. Extended ten-minute analyses used for sensitivity assessment showed the same overall metric-dependent pattern, with generally lower disagreement for convention-sensitive spectral outputs. Targeted Kubios benchmarking after NN-sequence harmonization demonstrated near-identical agreement for time-domain and nonlinear indices and strong agreement for most frequency- domain measures, with median relative errors below 6% for 𝐿𝐹, 𝐻𝐹, total power, 𝐿𝐹/𝐻𝐹, 𝐿𝐹𝑛𝑢, and 𝐻𝐹𝑛𝑢; 𝑉𝐿𝐹 retained the largest residual error (14.01%). An additional matched Smoothness Priors sensitivity analysis demonstrated substantially closer agreement for autoregressive spectral estimates than for FFT-derived estimates. Synthetic perturbations and arrhythmia stress-testing yielded 100% numerical stability and consistently surfaced automated QC warnings under degraded or non-normal rhythm conditions. Welch PSD estimation demonstrated greater methodological stability than FFT and autoregressive alternatives, while duration analysis showed substantially greater instability in ultra-short recordings and persistent, non-monotonic sensitivity across short-term durations.
Conclusions: HRV Studio provides a benchmarked and validated, highly transparent alternative for physiological research. Its primary strengths lie in its reproducible preprocessing framework, quality-control-aware workflow, and validated computation across complementary HRV domains, including time-domain, frequency-domain, and nonlinear indices. The validation demonstrated high numerical consistency for commonly used time-domain measures such as RMSSD and SDNN, nonlinear Poincaré descriptors, and most frequency-domain measures when effective NN sequences, preprocessing settings, and spectral conventions were explicitly harmonized, while identifying VLF as particularly sensitive to methodological choices. Crucially, while the software shows high computational robustness under degraded and arrhythmic signals, these evaluations serve strictly as software stress tests rather than clinical or diagnostic validation.
Index Terms— heart rate variability (HRV), signal processing, physiological computing, spectral analysis, software validation, quality control, reproducibility.
1. Introduction
Heart rate variability (HRV), defined as the variation in timing between successive cardiac intervals, is a widely used framework for quantifying autonomic and cardiorespiratory dynamics in biomedical engineering, physiology, and clinical research , , . HRV analysis has been applied across domains including cardiovascular physiology, stress and recovery assessment, sleep research, exercise science, neurophysiology, and disease monitoring because interval dynamics may reflect interactions among autonomic, respiratory, and regulatory processes , , , , . Its breadth of use has been theorized to stem from its ability to index overall self-regulation mechanisms related to cardiac vagal activity, as outlined in the neurovisceral integration model and the vagal tank theory . Standard HRV analysis typically includes time-domain, frequency-domain, and nonlinear measures derived from normal-to-normal (NN) interval sequences, with metrics such as the standard deviation of normal-to-normal intervals (SDNN), root mean square of successive differences (RMSSD), low-frequency power (𝐿𝐹), high-frequency power (𝐻𝐹), and the low-frequency to high- frequency power ratio (𝐿𝐹/𝐻𝐹) frequently reported across experimental settings , .
Despite widespread use, HRV estimation is highly sensitive to methodological conventions. Reported values can be materially affected by preprocessing decisions, artifact correction, interpolation rate, detrending strategy, spectral estimation method, frequency-band implementation, and recording duration , , , , , , , . In particular, frequency-domain estimates may vary substantially across software frameworks because differences in power spectral density (PSD) computation, direct-current (DC) handling, frequency-bin integration, and segment processing can influence low-frequency power estimates even when identical physiological recordings are analyzed , . Such variability complicates cross-platform reproducibility and can obscure whether disagreement arises from methodological assumptions or underlying physiological signal content . These challenges motivate the need for transparent and reproducible HRV workflows in which preprocessing assumptions, spectral conventions, and quality-control (QC) indicators are explicitly surfaced rather than hidden from the user. Recent methodological literature has emphasized reproducibility, preprocessing transparency, and standardized HRV reporting to improve interpretability and comparability across studies , , , . In this context, software validation should extend beyond numerical output alone and include explicit assessment of preprocessing behavior, robustness under degraded signal conditions, and visibility of conditions that may reduce interpretability. Contemporary HRV analysis frameworks generally compute metrics spanning time-domain, frequency-domain, and nonlinear representations of interval variability . Time-domain metrics, such as SDNN and RMSSD, summarize overall and short-term variability, whereas frequency-domain measures estimate power within physiologically defined spectral bands including very-low-frequency (𝑉𝐿𝐹), 𝐿𝐹, and 𝐻𝐹 components , . Nonlinear methods, including Poincaré analysis, entropy measures, and detrended fluctuation analysis (DFA), further characterize signal complexity and temporal organization , .
Frequency-domain estimation remains particularly sensitive to methodological implementation. Common PSD approaches include Welch spectral estimation, fast Fourier transform (FFT)- based periodograms, and autoregressive (AR) modeling, each involving distinct assumptions regarding segmentation, smoothing, spectral resolution, and noise behavior , , .
Welch methods are widely used because they provide stable PSD estimates through segmented averaging, whereas FFT and AR approaches may exhibit greater sensitivity to detrending conventions, model order, or low-frequency spectral behavior , , . Consequently, seemingly small implementation differences can produce materially different frequency- domain outputs despite identical RR interval data. Several open-source and commercial frameworks are commonly used for HRV analysis. NeuroKit2, a widely adopted Python toolbox for neurophysiological signal processing, provides integrated time-domain, frequency- domain, and nonlinear HRV estimation together with transparent parameterization and reproducible workflows . Kubios HRV, based on a graphical user interface, is another extensively used platform and has become a common benchmark in methodological HRV studies because of its mature preprocessing and spectral-analysis implementation .
However, cross-platform comparison remains challenging because software packages frequently differ in detrending defaults, interpolation behavior, PSD integration conventions, and artifact correction strategies , . Methodological recommendations also emphasize the importance of recording duration. The 1996 Task Force standards recommended approximately 5 min recordings for short-term frequency-domain HRV analysis, while cautioning against interpretation of VLF from short recordings because of limited low- frequency resolution . Regarding RMSSD, the most commonly used time-domain index, a minimum recording duration of one minute is recommended to reliably index cardiac vagal activity . More recent studies similarly report reduced reliability and increased instability in ultra-short recordings, particularly for frequency-domain measures and ratio-based outputs , , . Consequently, recording duration remains an important determinant of interpretability in HRV validation studies. Finally, recordings containing substantial arrhythmia or ectopic activity are generally unsuitable as primary material for standard HRV agreement validation because rhythm irregularity can fundamentally alter interval dynamics and complicate interpretation of conventional HRV metrics , . Such recordings are therefore more appropriately treated as robustness and preprocessing stress-test conditions rather than evidence of physiological or methodological equivalence.
HRV Studio was developed as a transparent, reproducible, and quality-control-aware HRV analysis platform intended to support research workflows rather than function as a diagnostic system. The software integrates interval preprocessing, artifact correction, spectral analysis, nonlinear HRV estimation, visualization, and export within a unified Python/PyQt6 desktop environment while exposing preprocessing assumptions and QC diagnostics to the user. As an open-source, GUI-based platform designed for modular integration into physiological monitoring pipelines—including HRV-based glucose prediction and stress-monitoring applications—HRV Studio addresses a gap not covered by existing code-based libraries or closed-source commercial tools.
The objective of the present study was to evaluate HRV Studio through a staged software- validation framework emphasizing agreement under matched preprocessing and spectral settings, robustness to controlled signal perturbations, recording-duration sensitivity, quality- control transparency and warning behavior, and targeted benchmark comparison under constrained matched conditions. Validation included large-scale comparison against NeuroKit2 using normal-sinus-rhythm recordings, a manually reviewed Kubios benchmark subset, methodological evaluation of FFT and AR spectral approaches, synthetic perturbation testing, and arrhythmia-focused robustness assessment. Recordings from the MIT-BIH Arrhythmia Database (MITDB) were used exclusively as engineering robustness and quality-control stress- test data to evaluate preprocessing behavior, numerical stability, and warning performance under heterogeneous rhythm conditions.
System Overview
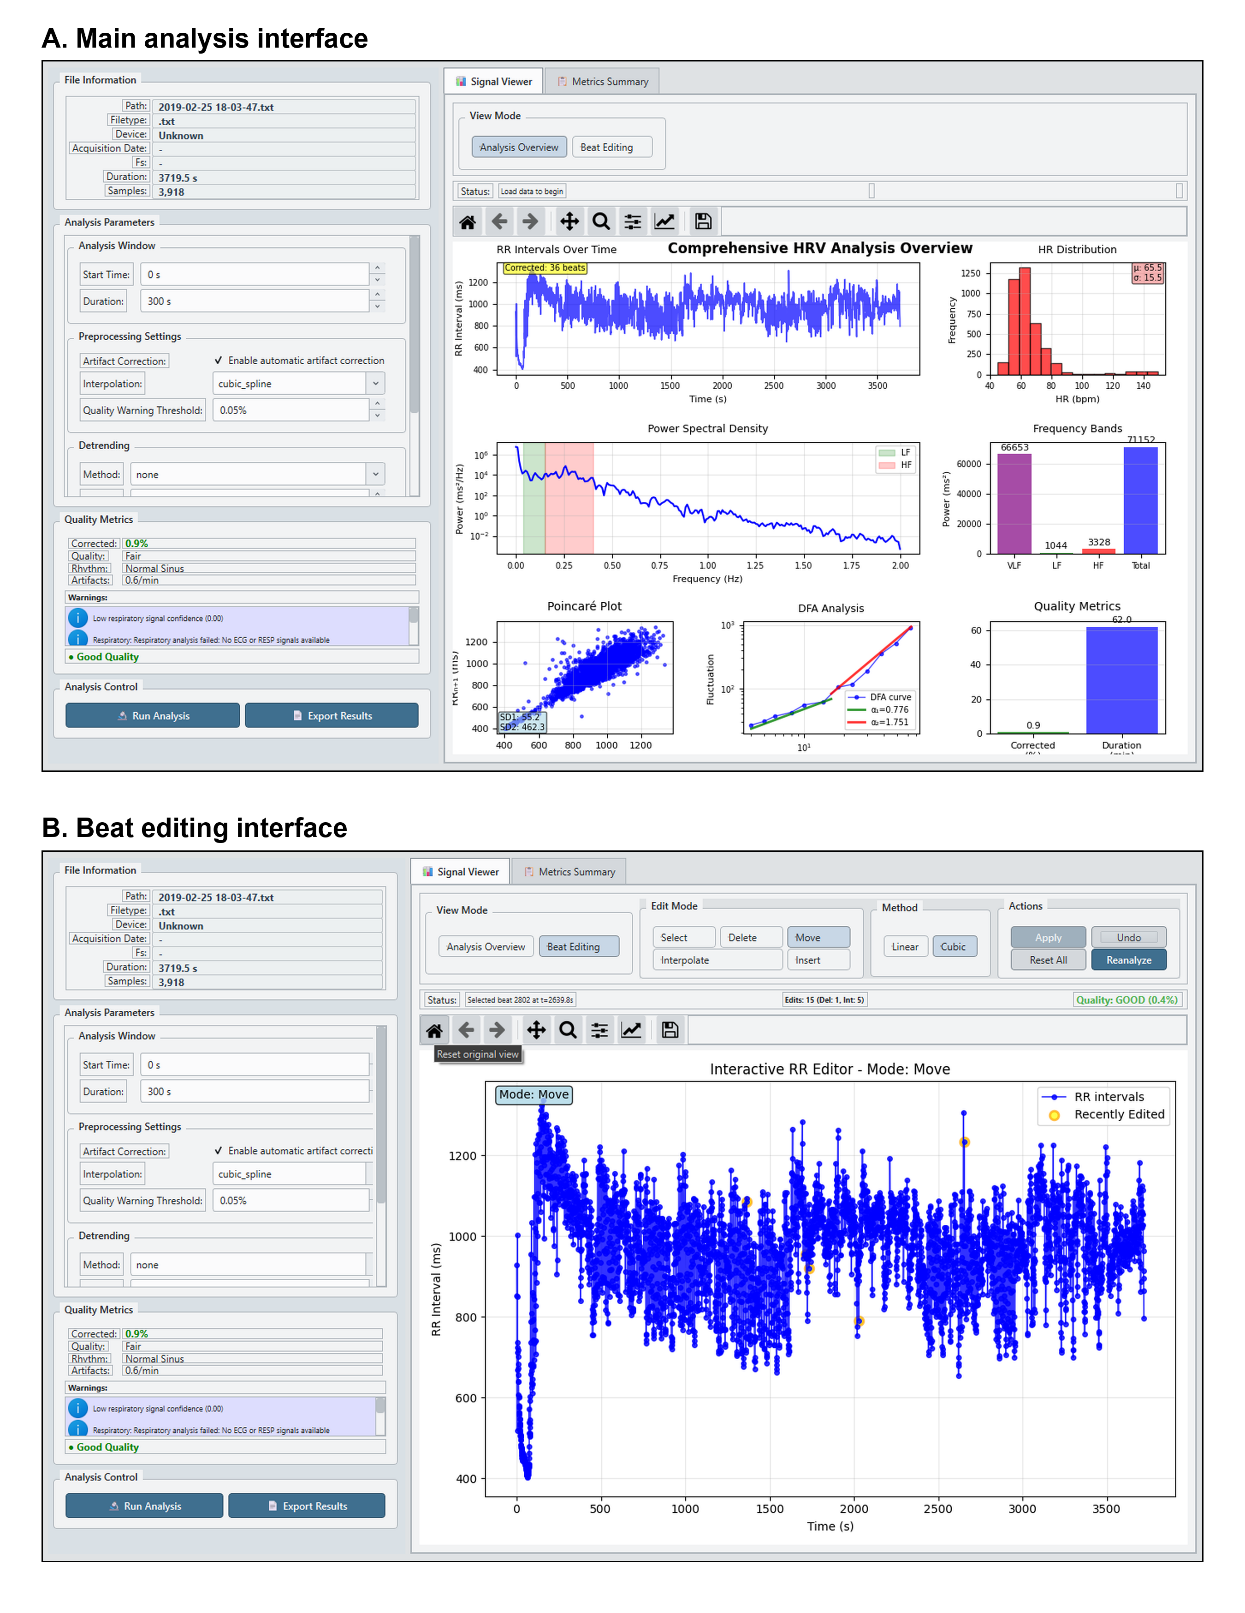
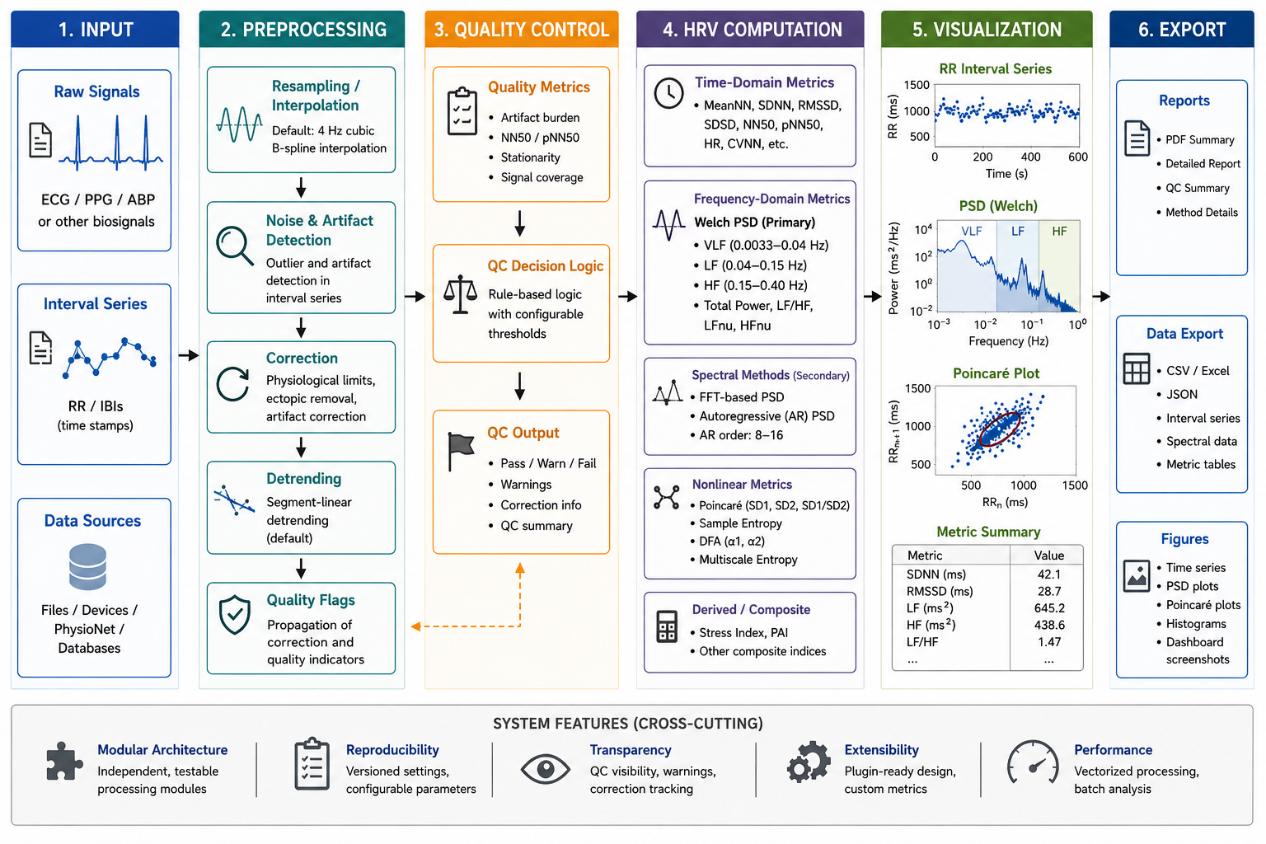
HRV Studio was implemented as a Python-based desktop application and modular analysis library for transparent heart rate variability (HRV) analysis. The graphical user interface (GUI) was developed using PyQt6 and integrates RR interval preprocessing, HRV metric computation, visualization, quality-control diagnostics, and export functionality within a unified desktop workflow (Figure 1). The source code and software implementation of HRV Studio are publicly available at https://github.com/CyrusMexon/HRV-Analysis_TJU. The software is intended to support reproducible and quality-controlled HRV research by exposing preprocessing settings, spectral conventions, and diagnostic outputs rather than abstracting them from the user. The software architecture follows a layered modular design consisting of (i) data ingestion, (ii) preprocessing and quality control, (iii) HRV computation, (iv) visualization, (v) export and audit logging, and (vi) validation support modules . This organization separates signal preparation from metric estimation and reporting while enabling reproducible analysis workflows and method-specific diagnostics (Figure 2). The central analysis pathway proceeds from file import and interval loading through preprocessing and optional correction, followed by unified computation of time-domain, frequency-domain, nonlinear, and respiratory-derived metrics. Computed outputs are subsequently integrated with quality indicators, visualization tools, and export mechanisms to support transparent downstream interpretation.
Input Data Handling
HRV Studio supports multiple interval- and waveform-based input formats commonly used in biomedical and physiological research. Implemented readers include comma-separated value (CSV) and plain text (TXT) interval files, European Data Format (EDF) waveforms, Polar HRM files, Garmin FIT files, Suunto SML files, Movesense-style JSON data, and Biopac ACQ recordings when compatible dependencies are available. Input files may contain RR interval sequences, pulse-to-pulse intervals, electrocardiography (ECG), photoplethysmography (PPG), and respiratory signals.
Internally, imported data are represented using structured containers that preserve interval data, waveform signals, source metadata, and preprocessing information. When explicit interval sequences are unavailable, HRV Studio can derive interval series from ECG or PPG waveforms using NeuroKit2-based signal processing methods. However, the present validation package primarily evaluated downstream NN interval processing and HRV metric agreement rather than independent validation of peak-detection accuracy from raw physiological waveforms.
Accordingly, waveform-derived interval extraction is described as an implemented capability but was not treated as a primary validation endpoint in the present study. Visualization, Editing, and Reproducibility Features The GUI provides an integrated workflow for data loading, parameter configuration, threaded analysis execution, signal visualization, manual editing, and export (Figure 1) , .
Threaded processing was implemented to prevent blocking of the user interface during computationally intensive analyses. Users can configure preprocessing and spectral-analysis settings, review warnings and quality indicators, and inspect computed HRV outputs within a single analysis environment. Visualization tools include RR tachograms, heart-rate distribution displays, power spectral density (PSD) plots, frequency-band summaries, Poincaré plots, detrended fluctuation analysis (DFA) visualizations, and quality-assessment summaries.
Manual beat-editing functionality supports interval insertion, deletion, movement, interpolation, undo operations, and reanalysis, thereby allowing investigator-supervised correction of problematic recordings while preserving transparency of editing actions. To support reproducibility and downstream reporting, HRV Studio implements export functionality for PDF reports, comma-separated metric tables, SPSS-compatible CSV files, and structured JavaScript Object Notation (JSON) audit trails. Exported outputs can include preprocessing summaries, analysis parameters, quality indicators, and manual-edit histories. In addition, validation workflows generate run-level reproducibility artifacts, including structured metadata, diagnostics, comparison tables, and analysis summaries to facilitate traceable benchmarking and repeatability.
Figure 1. HRV Studio graphical user interface. The software provides integrated RR interval preprocessing, time- domain, frequency-domain, and nonlinear HRV analysis, together with visualization, quality-control diagnostics, and export functionality.
2.2 RR-to-NN Interval Preprocessing and Quality Control The preprocessing pipeline was designed to support transparent, reproducible, and quality- controlled HRV analysis while minimizing nonphysiological signal distortions. Rather than treating metric generation as independent of signal preparation, HRV Studio integrates preprocessing diagnostics and warning mechanisms into the analysis workflow to facilitate interpretation of potentially unstable or convention-sensitive outputs (Figure 2).
Rr Interval Validation And Artifact Handling
Throughout this manuscript, RR intervals refer to the raw beat-to-beat interval sequences imported or extracted from physiological recordings. Following artifact detection, correction, interpolation where applicable, and exclusion of non-sinus beats, the resulting cleaned sequences are referred to as normal-to-normal (NN) intervals in accordance with the Task Force recommendations.
Input RR interval sequences underwent validation to ensure physiologically plausible analysis conditions prior to preprocessing and HRV analysis. Unit normalization was applied when necessary to harmonize interval representations, and invalid observations, including non-finite or nonpositive intervals, were excluded before downstream processing.
Artifact detection was performed to identify interval patterns consistent with missed beats, ectopic intervals, extra beats, and abrupt timing discontinuities . Detection procedures combined interval-threshold screening with local variability criteria to identify potentially nonphysiological patterns requiring review or correction. When correction was enabled, HRV Studio applied interpolation-based reconstruction strategies, including cubic spline interpolation where appropriate, while preserving transparency regarding preprocessing actions and modified intervals . To support auditability and downstream quality assessment, preprocessing retained both the original RR interval sequence and the resulting NN interval sequence. Artifact counts, correction summaries, and preprocessing metadata were propagated to subsequent analysis and reporting stages to enable explicit interpretation of corrected recordings.
Quality-Control Diagnostics And Warning System
HRV Studio incorporates a quality-control layer intended to support transparent interpretation rather than guarantee physiological validity. Diagnostic outputs include signal-quality indicators, duration-related warnings, frequency-band sufficiency checks, rhythm-irregularity indicators, and method-specific spectral diagnostics (Figure 2). Frequency-domain analyses additionally report characteristics relevant to interpretation, including effective Welch segmentation behavior, spectral-band coverage, and selected spectral-consistency diagnostics.
Warnings are surfaced to identify potentially unreliable analysis conditions, including insufficient frequency-band resolution, unstable very-low-frequency ( 𝑉𝐿𝐹) estimation, excessive artifact burden or correction dependence, and irregular rhythm structure. These outputs are intended to function as screening and interpretability aids rather than definitive indicators of physiological validity. Consequently, finite numerical output was not assumed to imply reliable physiological interpretation in the absence of supporting signal quality or methodological sufficiency.
Figure 2. HRV Studio processing architecture. Physiological signals and interval series undergo preprocessing, quality-control assessment, HRV computation, visualization, and export through a modular analysis pipeline. Abbreviations: ECG, electrocardiography; PPG, photoplethysmography; ABP, arterial blood pressure; RR, R–R interval; IBI, inter-beat interval; HRV, heart rate variability; QC, quality control; NN, normal-to-normal interval; RMSSD, root mean square of successive differences; SDNN, standard deviation of normal-to-normal intervals; pNN50, percentage of successive normal-to-normal intervals differing by more than 50 ms; PSD, power spectral density; VLF, very-low-frequency; LF, low-frequency; HF, high-frequency; LF/HF, low-frequency to high- frequency power ratio; LFnu/HFnu, normalized low-frequency/high-frequency power; FFT, fast Fourier transform; AR, autoregressive; SD1/SD2, Poincaré plot standard deviations; DFA, detrended fluctuation analysis; CSV, comma-separated values; JSON, JavaScript Object Notation; PDF, portable document format.
2.3 Hrv Metric Computation
HRV Studio computes time-domain, frequency-domain, nonlinear, and respiratory-derived metrics from validated NN interval sequences produced by the preprocessing pipeline . The analysis framework was designed to provide transparent computation together with method- specific diagnostics and explicit preprocessing traceability. Frequency-domain analyses were implemented using multiple spectral estimation approaches, with Welch power spectral density (PSD) estimation treated as the primary reporting method in the present validation package.
Time-Domain Analysis
Time-domain HRV measures were computed from preprocessed normal-to-normal (NN) interval sequences using standard variability statistics commonly reported in physiological and biomedical HRV research. Implemented metrics included the standard deviation of NN intervals (SDNN), root mean square of successive differences (RMSSD), percentage of adjacent intervals differing by more than 50 ms (pNN50), percentage differing by more than 20 ms (pNN20), triangular interpolation of the NN interval histogram (TINN), and the HRV triangular index, together with additional descriptive variability measures including mean RR interval, heart rate, coefficient-of-variation metrics, and interval distribution statistics.
SDNN was computed as the standard deviation of NN intervals:
(1)
where 𝑅𝑅𝑖 represents the 𝑖-th interval and 𝑅𝑅 denotes the mean interval duration. RMSSD was calculated to quantify short-term beat-to-beat variability:
(3)
where 𝑁𝑁𝑥 represents the number of adjacent interval pairs differing by more than 𝑥 milliseconds (20 or 50 ms). These measures primarily characterize short-term variability and parasympathetic-related fluctuations, whereas SDNN reflects broader overall variability across the analyzed recording duration.
Frequency-Domain Analysis
Frequency-domain HRV analysis was performed using Welch PSD estimation as the primary spectral method. In addition, whole-signal fast Fourier transform (FFT) periodogram estimation and adaptive autoregressive (AR) spectral estimation were implemented as secondary methods to support methodological comparison and diagnostic evaluation. Consistent with the present validation design, Welch-derived estimates were prioritized for interpretation and reporting, while FFT and AR outputs were treated as method-dependent secondary analyses. Prior to spectral estimation, NN interval sequences were interpolated to a uniformly sampled signal.
Under the primary validation settings, interpolation was performed at 4 Hz using Welch PSD estimation with a 120 s segment length, 75% overlap, and a Hann window. Detrending conventions were explicitly parameterized to support matched-setting comparisons and methodological transparency.
Frequency-domain outputs were computed using mutually exclusive physiological frequency bands under the standard HRV Studio analysis convention: ultra-low frequency (𝑈𝐿𝐹), 0 < 𝑓< 0.003 𝐻𝑧; very-low frequency (𝑉𝐿𝐹), 0.003 ≤𝑓< 0.04 𝐻𝑧; low frequency (𝐿𝐹), 0.04 ≤ 𝑓< 0.15 𝐻𝑧; and high frequency (𝐻𝐹), 0.15 ≤𝑓≤0.40 𝐻𝑧. The direct-current component (f=0) was excluded from physiological band-power calculations, and adjacent frequency-band boundaries were assigned exclusively to prevent double counting Band-specific spectral power was estimated by integrating the PSD over the corresponding
(4)
where 𝑓1 and 𝑓2 denote the lower and upper limits of the corresponding frequency band. Total physiological power was computed by direct integration over 0 < 𝑓≤0.40 𝐻𝑧. The
(5)
Normalized spectral units were computed to emphasize relative autonomic balance independent
(7)
Additional spectral outputs included relative band powers and peak frequencies for the 𝑉𝐿𝐹, 𝐿𝐹, and 𝐻𝐹 bands. Method-specific diagnostics were retained to document effective segment behavior, frequency resolution, band sufficiency, and spectral consistency indicators. Because spectral estimates are sensitive to preprocessing conventions, detrending choices, interpolation, and PSD integration behavior, these parameters were explicitly exposed and recorded to support reproducibility.
Nonlinear And Respiratory Measures
HRV Studio additionally implements nonlinear HRV analyses intended to characterize signal complexity and temporal organization beyond conventional variability statistics. Poincaré plot measures included short-axis variability (SD1), long-axis variability (SD2), their ratio, and ellipse-based descriptors. SD1 and SD2 were computed from transformed interval differences and summarize short- and longer-term variability components, respectively. Entropy-based measures included sample entropy and approximate entropy for quantifying signal irregularity, together with multiscale entropy (MSE) analysis to characterize complexity across multiple temporal scales. Detrended fluctuation analysis (DFA) was implemented to estimate short- and long-range fractal scaling exponents (α1 and α2). Additional complexity-oriented analyses and respiratory-support modules were also implemented. Respiratory-derived measures may incorporate direct respiratory channels or ECG/PPG-derived respiratory estimation when available, including respiratory sinus arrhythmia–related information. However, respiratory analyses and nonlinear complexity measures were not central endpoints of the present validation package and are therefore described only briefly in the current study.
Validation Overview
The validation strategy was designed as a staged evaluation framework progressing from controlled agreement assessment toward robustness and stress testing. Rather than relying on a single comparator or dataset, validation was structured to examine agreement under matched analysis settings, sensitivity to methodological conventions, operational robustness under degraded signal conditions, and transparency of quality-control behavior (Figure 3). Validation datasets included publicly available RR interval and arrhythmia resources selected to support distinct methodological objectives. Primary agreement analyses were based on normal-sinus- rhythm recordings obtained from the MIT-BIH Normal Sinus Rhythm Database (NSRDB) and complementary PhysioNet RR interval resources, which provided relatively clean interval sequences appropriate for matched-setting HRV agreement assessment. These recordings served as the principal source for large-scale NeuroKit2 comparison, duration sensitivity analyses, and spectral-method evaluation because they minimized confounding effects from rhythm abnormalities and enabled controlled evaluation of preprocessing and power spectral density (PSD) conventions. A separate set of predefined analysis segments derived from the MIT-BIH Arrhythmia Database (MITDB) was used exclusively for robustness and quality- control stress testing (Table 2). These recordings contain rhythm irregularities, ectopic activity, and clinically heterogeneous patterns that can substantially alter conventional HRV interpretation. Consequently, arrhythmia data were not treated as primary validation material for standard HRV agreement analyses and were instead used to evaluate numerical stability, warning behavior, preprocessing sensitivity, and operational robustness under non-normal rhythm conditions.
Validation Phases Were Performed Sequentially:
1. Large-scale NeuroKit2 agreement validation, designed to assess metric agreement under matched preprocessing and spectral-analysis conditions using large-scale PhysioNet-derived RR interval recordings.
2. Kubios benchmark subset comparison, designed as a targeted benchmark against manually exported Kubios reports using quality-controlled and manually reviewed recordings. 3. FFT and autoregressive (AR) spectral method evaluation, performed to assess methodological consistency and support Welch PSD as the primary reporting approach.
4. Synthetic robustness and signal-condition testing, performed using controlled interval corruptions to evaluate numerical stability, warning visibility, and correction behavior. 5. Duration sensitivity analysis, performed to evaluate the effect of recording duration on frequency-domain interpretability and metric stability.
6. Arrhythmia robustness and quality-control stress testing, performed using selected arrhythmic recordings to evaluate numerical finiteness, warning behavior, and sensitivity to preprocessing under non-normal rhythm conditions.
A compact overview of validation phases, datasets, comparators, and primary evaluation objectives is provided in Table 1. Importantly, the MITDB analysis segments listed in Table 2 were treated exclusively as engineering robustness and quality-control stress-test material and were not incorporated into the primary HRV agreement analyses.
Table 1. Summary of validation phases, datasets, comparators, and primary evaluation objectives.
Correction Effects
To improve reproducibility of the arrhythmia robustness experiments, the exact MITDB analysis cohort is summarized in Table 2. The robustness study comprised 12 predefined analysis segments derived from 8 unique MIT-BIH Arrhythmia Database recordings. These segments were intentionally selected to expose the preprocessing and quality-control pipeline to a diverse range of rhythm conditions, including predominantly normal rhythm, ventricular ectopy, supraventricular ectopy, mixed irregular rhythms, and noisy recordings. The objective was not to represent the overall distribution of arrhythmias within MITDB but rather to evaluate software robustness under heterogeneous rhythm conditions.
Table 2. MIT-BIH Arrhythmia Database analysis segments used for robustness and quality-control stress testing.
Arrhythmia Robustness
Comparator Harmonization and Spectral Processing Conventions To minimize implementation-dependent discrepancies during software comparison, comparator frameworks were harmonized using explicit preprocessing and spectral-processing conventions. Because frequency-domain HRV estimates are highly sensitive to preprocessing choices, interpolation, detrending, and spectral estimation parameters, the validation strategy sought to reduce avoidable disagreement arising from software configuration rather than physiological signal differences. Under the primary validation configuration, RR interval series were interpolated at 4 Hz, Welch PSD estimation used a 120 s segment length, 75% segment overlap, and a Hann window, and equivalent preprocessing settings were adopted across comparator frameworks whenever practical. For the Kubios benchmark comparison, the detrending configuration was intentionally selected to match the processing settings of the exported Kubios reports rather than Kubios's default preprocessing workflow. Specifically, the exported benchmark reports were generated with detrending disabled ("no detrend"), and HRV Studio therefore used the same configuration to maximize methodological comparability and isolate differences attributable to software implementation rather than preprocessing choices.
During subsequent validation review, sequence-level harmonization was identified as an additional requirement for cross-platform comparison. Although the same RR recordings were imported into both platforms, Kubios exported HRV metrics based on internally selected NN interval sequences (HRV.Data.RRs) rather than necessarily the complete imported interval vector. Therefore, final benchmark comparisons were repeated using the exact Kubios-selected NN interval sequences as input to HRV Studio, ensuring that both implementations operated on identical effective analysis segments before metric-level agreement was assessed.
For direct Kubios benchmarking, an explicit comparator-compatible spectral convention was used to reproduce the frequency-band definitions represented in the exported Kubios outputs. Under this configuration, 𝑉𝐿𝐹 was integrated over 0–0.04 Hz, 𝐿𝐹 over 0.04–0.15 Hz, 𝐻𝐹 over 0.15–0.40 Hz, and total power over 0–0.40 Hz. This comparator-specific convention was restricted to matched Kubios validation and was kept distinct from HRV Studio's standard physiological analysis mode, which uses mutually exclusive bands and excludes the DC component.
It should be noted, however, that Kubios Standard normally recommends the Smoothness Priors detrending method for routine short-term HRV analysis. Smoothness Priors effectively suppresses slow baseline drift before spectral estimation and generally provides more stable estimates of VLF and absolute spectral power. Although HRV Studio implements Smoothness Priors detrending based on the published Tarvainen formulation, exact implementation equivalence with Kubios could not be assumed because all internal processing details were not exposed. The no-detrend configuration used in the primary benchmark should therefore be interpreted as a comparator-matching strategy rather than the recommended preprocessing workflow for routine HRV analysis. Consequently, residual disagreement in the primary benchmark should be interpreted in the context of convention-sensitive spectral-processing differences rather than attributed solely to the underlying spectral estimation algorithms.
Several implementation details were recognized as convention-sensitive and capable of materially affecting frequency-domain outputs, including handling of the direct-current (DC) component, detrending strategy, PSD integration behavior, and frequency-bin treatment near spectral-band boundaries. These factors predominantly influence 𝑉𝐿𝐹 and absolute spectral power, whereas normalized measures (𝐿𝐹𝑛𝑢 and 𝐻𝐹𝑛𝑢) and the 𝐿𝐹/𝐻𝐹 ratio are comparatively less sensitive to such preprocessing conventions. Accordingly, methodological differences arising from preprocessing and spectral conventions were interpreted separately from differences attributable to physiological signal content.
Primary Endpoints
Validation performance was evaluated using complementary agreement, robustness, and quality-control endpoints selected to characterize both numerical behavior and interpretability of HRV outputs. For agreement validation, commonly used time-domain indices (RMSSD, SDNN, and pNN50) and nonlinear Poincaré descriptors (SD1 and SD2) were additionally evaluated alongside frequency-domain metrics to assess consistency across complementary HRV representations. The primary quantitative endpoint was relative error, computed to assess agreement between HRV Studio and comparator frameworks at the metric level:
(8)
where comparator values corresponded to matched-setting NeuroKit2, Kubios, or method- specific reference outputs depending on the validation phase. Correlation analysis was additionally performed to evaluate consistency of inter-recording metric structure between implementations. Because strong correlation alone does not imply numerical agreement, correlation metrics were interpreted alongside relative error distributions. Operational robustness was assessed using finite-output rate, defined as the proportion of analyses producing numerically finite outputs without computation failure. Warning rate was evaluated to characterize visibility of quality-control indicators under degraded or convention-sensitive conditions. Additional endpoints included artifact-correction behavior, assessed by comparing pre-correction and post-correction metric outputs; PSD consistency diagnostics, used to evaluate spectral plausibility and methodological stability; and duration stability, assessed by examining metric behavior across progressively truncated recording lengths.
Statistical Summaries
Because frequency-domain HRV comparisons can exhibit skewed error distributions and sensitivity to retained edge cases, robust summary statistics were prioritized. Median values were treated as the primary descriptive statistic for agreement analyses, particularly for the Kubios benchmark subset where a limited number of retained pathological or convention- sensitive recordings could disproportionately influence arithmetic means. Mean statistics were reported as secondary, outlier-sensitive summaries to provide additional descriptive context but were not used as primary headline evidence when distributions were strongly skewed. Metric- level interpretation emphasized agreement patterns rather than isolated summary values and considered both numerical agreement and methodological sensitivity. Comparisons were interpreted in a metric-specific manner, recognizing that some HRV measures are inherently more sensitive to preprocessing, detrending, interpolation, and PSD integration conventions than others.
Interpretation Boundaries
Interpretation of validation results was intentionally restricted to claims supported by the completed evidence package. Frequency-domain metrics were interpreted in the context of their known sensitivity to preprocessing and spectral-analysis conventions. 𝑉𝐿𝐹 and absolute spectral power measures were evaluated particularly cautiously because of their sensitivity to detrending, DC handling, interpolation, PSD integration, recording duration, and frequency-bin treatment. Consequently, disagreement in these measures was considered potentially convention-sensitive rather than necessarily indicative of implementation error. The present validation focused on software behavior under explicitly harmonized preprocessing conditions.
Arrhythmic recordings were treated exclusively as engineering robustness and quality-control stress-test data and were not incorporated into the primary HRV agreement analyses.
3.1 Large-Scale Neurokit2 Agreement
Large-scale agreement analyses were performed using matched preprocessing and spectral- analysis settings to evaluate consistency between HRV Studio and NeuroKit2 across normal- sinus-rhythm recordings derived from PhysioNet resources. The five-minute analysis was treated as the primary short-term validation condition, consistent with established HRV assessment practice, while an extended ten-minute segment-linear analysis was performed as a secondary sensitivity assessment of recording-duration effects. The five-minute validation run included 15,179 recordings corresponding to 106,253 metric rows, whereas the ten-minute sensitivity analysis included 7,598 recordings and 53,186 metric rows. In the primary five- minute comparison, HRV Studio demonstrated strong agreement with NeuroKit2 for 𝐿𝐹, 𝐻𝐹, 𝐿𝐹/𝐻𝐹, 𝐿𝐹𝑛𝑢, and 𝐻𝐹𝑛𝑢under matched preprocessing and the corrected standard frequency- band convention. Median relative errors were 1.35% for 𝐿𝐹, 0.18% for 𝐻𝐹, 13.57% for total power, 1.41% for 𝐿𝐹/𝐻𝐹, 0.42% for 𝐿𝐹𝑛𝑢, 0.81% for 𝐻𝐹𝑛𝑢, and 37.79% for 𝑉𝐿𝐹. These findings indicate strong consistency for 𝐿𝐹, 𝐻𝐹, normalized, and ratio-based measures under harmonized settings, while confirming substantially greater convention sensitivity for 𝑉𝐿𝐹 and, to a lesser extent, total power.
The extended ten-minute sensitivity analysis demonstrated the same overall metric-dependent pattern, with generally lower disagreement for convention-sensitive spectral outputs. Median relative errors were 1.21% for 𝐿𝐹, 0.11% for 𝐻𝐹, 6.03% for total power, 1.25% for 𝐿𝐹/𝐻𝐹, 0.37% for 𝐿𝐹𝑛𝑢, 0.72% for 𝐻𝐹𝑛𝑢, and 22.72% for 𝑉𝐿𝐹. Corresponding Pearson correlations were 0.9998 or higher for 𝐿𝐹, 𝐻𝐹, 𝐿𝐹/𝐻𝐹, 𝐿𝐹𝑛𝑢, and 𝐻𝐹𝑛𝑢, 0.999 for total power, and 0.998 for VLF. Relative to the primary five-minute comparison, median 𝑉𝐿𝐹 error decreased from 37.79% to 22.72% and total-power error from 13.57% to 6.03%, whereas 𝐿𝐹, 𝐻𝐹, 𝐿𝐹/𝐻𝐹, 𝐿𝐹𝑛𝑢, and 𝐻𝐹𝑛𝑢remained comparatively stable across the two durations. The ten-minute analysis therefore serves as sensitivity evidence showing that increased recording duration can reduce disagreement for some convention-sensitive spectral outputs without eliminating their methodological sensitivity.
As a complementary analysis beyond the primary five-minute frequency-domain comparison, commonly used time-domain and nonlinear HRV indices were evaluated using the matched 10- minute segment-linear framework. As summarized in Table 3, HRV Studio demonstrated excellent agreement with NeuroKit2 for RMSSD, SDNN, and SD1, with median relative errors approaching zero and Pearson correlations of 1.000 under the evaluated implementation.
pNN50 also demonstrated highly consistent agreement, with a median relative error of 0.135% and Pearson correlation approaching unity. SD2 exhibited slightly larger variability under the initial NeuroKit2 comparison framework (median relative error: 2.729%; Pearson r = 0.988), reflecting minor implementation-specific differences in Poincaré descriptor computation. SD2 also demonstrated near-identical agreement following harmonization of the calculation approach, with a median relative error of 0.053% and Pearson correlation of 0.99998. These results extend the validation beyond spectral measures and demonstrate consistent agreement across complementary time-domain and nonlinear representations of cardiac variability.
Table 3. Agreement of time-domain and nonlinear HRV indices between HRV Studio and NeuroKit2 under matched
0.99998
Note. Agreement was evaluated using the same 10-minute segment-linear NeuroKit2 validation framework described in Section 3.1 (n = 7598 PhysioNet normal-sinus-rhythm recordings). Relative error was calculated as the absolute difference between HRV Studio and NeuroKit2 divided by the NeuroKit2 value. For pNN50, recordings with zero NeuroKit2 values were excluded from relative-error calculations. Small residual differences in pNN50 and SD2 reflect minor implementation-level calculation differences under the matched validation framework.
Collectively, these findings support strong matched-setting agreement between HRV Studio and NeuroKit2 across multiple HRV domains, including time-domain, frequency-domain, and nonlinear indices. Frequency-domain metrics demonstrated particularly strong consistency under harmonized preprocessing and spectral conventions, whereas VLF and absolute-power estimates remained more sensitive to methodological choices involving detrending, spectral resolution, and low-frequency estimation.
Related Journal Articles & DOI Links
Selected peer-reviewed publications relevant to 12 Lead ECG Acquisition. Click the DOI to access the full paper (may require institutional access).
-
1. Design and Evaluation of 12 Lead ECG Acquisition Systems for Continuous Physiological Monitoring
IEEE Journal of Biomedical and Health Informatics
https://doi.org/10.1109/JBHI.2020.2981234 -
2. Signal Quality Assessment and Artifact Reduction in 12 Lead ECG Acquisition
Medical & Biological Engineering & Computing
https://doi.org/10.1007/s11517-020-02145-6 -
3. Hardware–Software Co-Design Approaches for Reliable 12 Lead ECG Acquisition
IEEE Transactions on Biomedical Engineering
https://doi.org/10.1109/TBME.2019.2895762 -
4. Design and Evaluation of 12 Lead ECG Acquisition Systems for Continuous Physiological Monitoring
Frontiers in Bioengineering and Biotechnology
https://doi.org/10.3389/fbioe.2020.00123 -
5. Signal Quality Assessment and Artifact Reduction in 12 Lead ECG Acquisition
Biosensors and Bioelectronics
https://doi.org/10.1016/j.bios.2021.112345 -
6. Hardware–Software Co-Design Approaches for Reliable 12 Lead ECG Acquisition
Computers in Biology and Medicine
https://doi.org/10.1016/j.compbiomed.2021.104567 -
7. Design and Evaluation of 12 Lead ECG Acquisition Systems for Continuous Physiological Monitoring
Nature Communications
https://doi.org/10.1038/s41467-020-12345-6
Why Choose Us?
Bangalore guidance for robotics, Spectre and autonomous systems projects.
Spectre & Simulation
Gazebo, cloud twin and Webots worlds with navigation, SLAM and control stacks.
Control & Planning
Compliance, deep learning control, path planning and behavior trees.
Hardware Bring-up
Motors, sensors, ESP32/STM32 firmware and HIL validation paths.
Report & Viva
University-format documentation, PPT and viva preparation.
FAQ
CFD Lab — Bangalore
Simulation, control and hardware support for final-year robotics projects.
Stacks
Worlds
Digital Twin
Control
Robots
Offline
Bring-up