Lesion With The Aid Of Impedance Cardiography
Sudipta Ghosh, Bhabani Prasad Chattopadhyay, Ram Mohan Roy, Jayanta Mukherjee, and Manjunatha
Mahadevappa,
Abstract—In recent years, coronary artery disease is escalating and is likely to assume an epidemic proportion by 2030. Currently the reliable methods for detection of coronary arterial lesions are either conventional coronary angiogram (CAG) or MDCT (Multiple Detector Computed Tomography) coronary angiogram.
Conventional CAG is an invasive procedure. Conventional CAG and CT (Computed Tomography) angiogram, both require ex- pert supervision of either an interventional cardiologist or a radiologist. In this work, we have proposed a novel design and method for non-invasive detection and localization of coronary arterial lesion using Impedance Cardiography (ICG). The ICG signal recorded by the proposed device is used to extract feature points and compute augmentation index, amplitude and other time related parameters. The extracted features are used as input to a trained artificial neural network, for detection and prediction of coronary arterial lesions. The trained network generates specialized models, to be used for diagnosis of arterial lesions. The proposed methodology detects lesion in Left main coronary artery (LMCA), Left anterior descending artery (LAD), Diagonal branch, Left circumflex artery (LCX), and Right coronary artery (RCA) with an accuracy of 92%, 82%, 76%, 76%, 84% respectively. The proposed device could be also used by a common individual for detection of arterial lesion without any expert supervision, unassisted. The proposed algorithm eliminates the need of CAG for diagnosis of coronary arterial lesions (stenosis), and provides an insight into a new method for non-invasive monitoring of cardiovascular haemodynamics, detection and localization of coronary arterial lesion.
Index Terms—Impedance Cardiography, Augmentation Index, Artery lesion, Coronary Angiogram, Artificial Neural Network
Ardiovascular Diseases (Cvd) Have Seen An In-
creasing trend in recent years. World Health Organisation (WHO) projects cardiovascular diseases as the primary cause of death, globally. According to WHO there have been 17.7 million deaths due to CVDs in 2015 alone, which pertains to 31% of total global deaths . Another report by the American Heart association, suggests that by 2030 the number of deaths due to CVDs will rise to 23.6 million . This S. Ghosh is with School of Medical Science and Technology, Indian Institute of Technology Kharagpur, Kharagpur, West Bengal-721302, INDIA, Medical College and Hospital, Kolkata, West Bengal-700073, INDIA, e-mail: Indian Institute of Technology Kharagpur, Kharagpur, West Bengal-721302, M. Mahadevappa is with School of Medical Science and Technology, Indian Institute of Technology Kharagpur, Kharagpur, West Bengal-721302, INDIA, ever increasing occurence of CVDs across the world, com- bined with the frugal nature of cardiovascular care in ICU (Intensive Care Unit) patients, calls for development of better techniques for detection and assessment of cardiovascular dis- eases. Cardiovascular diseases are basically disorders of heart and its associated blood vessels. CVDs include but are not limited to, coronary heart disease, peripheral arterial disease, rheumatic heart disease, congenital heart disease, deep vein thrombosis, cerebrovascular disease, and pulmonary embolism . Hemodynamic monitoring which encompasses the study of development and propagation of flow and pressure pulses, including but not limited to: systemic, pulmonary arterial and venous pressures and cardiac output, have traditionally been utilized by the clinicians. However, they are costly and require on-site expert supervision .
The first and foremost thing that comes to one’s mind regarding the health of one’s heart, and its associated vessels is the stiffness of the vessels. Essentially arteries are supposed to be pulsatile in nature, but with age and other factors they tend to become stiff and loose their pulsatile nature .
The other factors may include plaque, cholesterol deposition, congenital defects, etc. The stiffer the arteries are, the worse is the condition of the patient, which leads to cardiovascular diseases. The stiffness of the arteries could be considered as a precursor of CVDs. Studies have been conducted to find the relevance of arterial stiffnes as a cardiological risk factor. Researchers have employed pulse wave velocity (PWV) to study arterial stiffness , , . Studies have been conducted using two pulse synthesis model of PPG waveform, to determine the risk of coronary artery diseases due to altered arterial stiffness . Calculation of PWV is highly dependent on the accurate and precise measurement of pulse transit time (PTT). Accurate and precise measurement of PTT involves two types of blood pressure waveform, one at the central and another at the peripheral arterial site. PTT calculation also involves calculation of foot to foot delay of these two acquired
Blood Pressure Waveforms . This Sort Of Pwv And
PTT measurement requires an expert supervision, in order to simultaneously record the two waveforms. The recording usually is done with the help of hand held tonometers. PTT is used for ambulatory pressure monitoring , . It has also been used to estimate transfer functions for calculation of central blood pressure waveforms , , .
Researchers have also proposed a two pulse synthesis model for non-invasive derivation of important arterial parameters, that could lead to monitoring of human vascular health , . Commercially available devices like, SphygmoCorTM
2
(AtCor Medical, Sydney, Australlia), use electrocardiograph (ECG) in order to determine PWV . PTT has also been used to measure systolic blood pressure, and to estimate changes in blood pressure during obstetric spinal anaesthesia , .
Methods based on PTT and PWV measure the stiffness index of arteries, but are not able to localise the occurence of lesion. Presently clinicians perform Coronary angiogram (CAG), and radiologists perform MDCT angiogram for local- ization and detection of coronary arterial lesion. Conventional CAG is an invasive procedure. It requires supervision by an interventional cardiologist, and involves complications of an interventional surgical procedure . MDCT coronary angiogram needs expertise of a radiologist trained in cardiac CT. As mentioned above most of the hemodynamic parameter monitoring techniques are invasive in nature. In 1966 Kubicek et al. proposed a novel non-invasive technique, Impedance Cardiography (ICG) for measuring cardiac output and body fluid composition. Impedance cardiography (ICG) measures the ionic conduction of human body in contrast to electrical conduction characteristics of human , . The volume of arterio-venous blood within a specific segment of human body is deemed responsible for the static and transient values of electrical conductivity. The variation in impedance (∆Z) obtained due to the pulsatile, peripheral blood flow of limbs has been mathematically related to the pulsatile change in volume by Nyboer , as shown in Eq. 1.
(1)
where ∆V is the pulsatile volume change with respect to resistivity, ρ = resistivity of blood in Ω-cm, L= length of the explored limb in cm, Z0= measured impedance at minimum volume, and ∆Z is the amount of variation in impedance.
In impedance cardiography an alternating current is injected into a particular segment of the human body, where it conducts mostly through blood in comparison to the more resistive parts, like bone, fat etc. As the injected current flows through blood, there is a change in electric potential due to the pulsatile changes in blood flow. This change in electrical potential is measured and its corresponding impedance change is observed. If Rb is the total resistance, R0 is the static resistance and Rn is the alternate resistance of a particular segment of human body, the change incurred in resistance ∆R, due to the pulsatile blood flow is given by Eq. 2.
(2)
In this work, we propose a novel technique for non-invasive detection and localization of arterial lesion by processing ICG and using an artificial neural network based classifier. The results obtained from the proposed technique were compared with the observations drawn by the physicians using coronary angiogram on the same set of subjects. The latter data set is considered as the ‘gold standard’ data for verification and validation of the proposed technique. In our previous work we proposed a basic and simplifed circuit for obtaining ICG signal from the fore-arm of a human body . In this study TABLE I: Baseline characteristics of the study group
53.32 ± 14.57
we have also presented an improvised version of the device reported earlier.
A. Subject Population
of cardiology, “Medical College and Hospital, Kolkata”. A total of 50 subjects have been recruited in this study so far. Each of the recruited subjects’ electrocardiograph (ECG) and echocardiogram results are also recorded. Requisite eth- ical clearance for the study has been obtained from the institute ethical committe of “Indian Institute of Technology Kharagpur” and “Medical College and Hospital, Kolkata”. The baseline characteristics of the recruited subjects are shown in I. Subjects with confirmed cases of cardiovascular disease, undergoing coronary angiogram, and having abnormal ECG were recruited in this current study, whereas the exclusion
Criteria Are Listed Below:
• The subject should not have any electronic device, like pacemaker, implanted. • The subject should not be below 18 years of age.
• The subject should not be suffering from septic shock. • The subject should not have aortic valve regurgitation and defect on septum.
• The subject should not suffer from tachycardia, with heart rate greater than 200 beats per minute. • The subject should not be underweight (i.e. below 30 kg) and also should not be more than 155 kg in weight.
B. ICG circuit implementation and feature extraction The authors have designed a cost effective, easy to use impedance cardiography (ICG) device for recording ICG signals from the subjects. The basic block diagram of the implemented circuit is shown in Fig. 1. The device is designed for use on the subject’s forearm, with the aid of a tetrapolar configuration. The device uses a function generator to generate a biphasic sinusoidal wave of 50 % duty cycle. The generated signal is found to be oscillating about a value much higher than D.C zero, so the generated sine wave is fed into a subtractor in order to receive a signal which oscillates about D.C zero.
The generated signal has to have 50 % duty cycle such that there is no charge accumulation on the skin surface of the
3
subject. Charge accumulation has to be zero so that there is no risk of skin burn to the subject. The signal thus generated is then amplified and fed into a voltage to current converter. The voltage to current converter is designed in a floating ground configuration. The output of the voltage to current converter is then fed into two excitation electrodes, placed on the forearm of the subject. The specification of the excitation pulse injected
• Source Type: Sine Wave
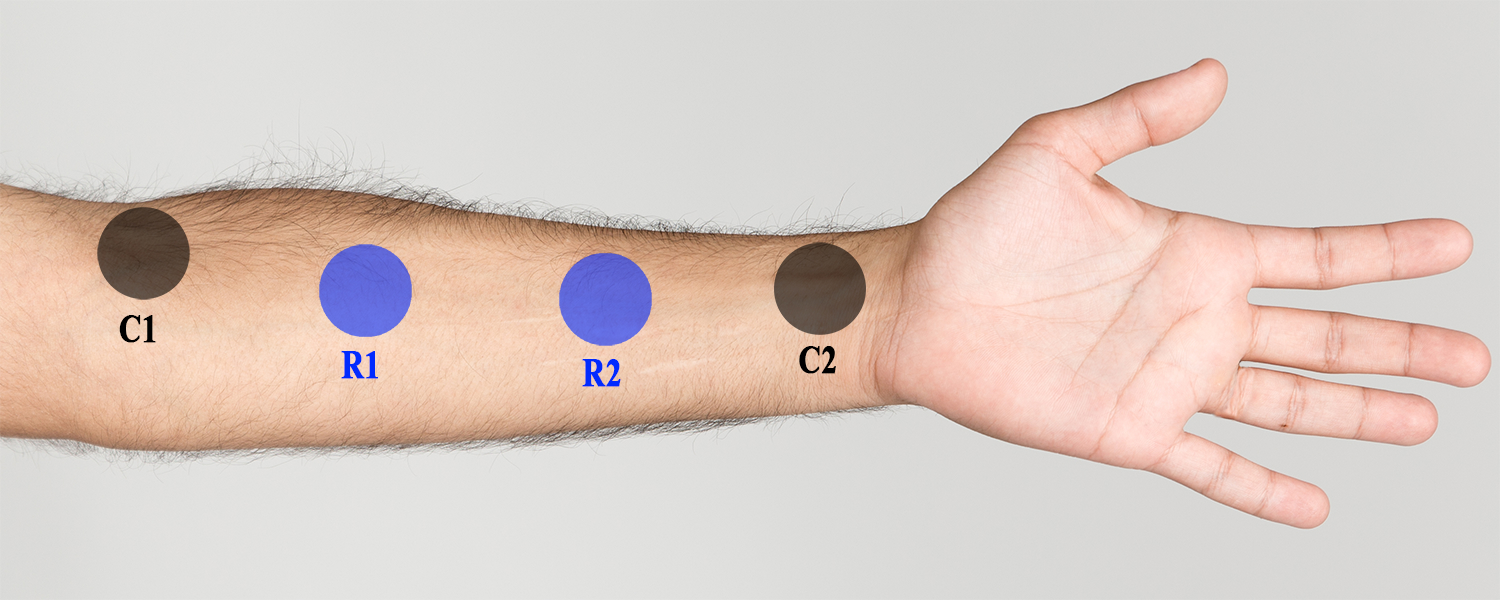
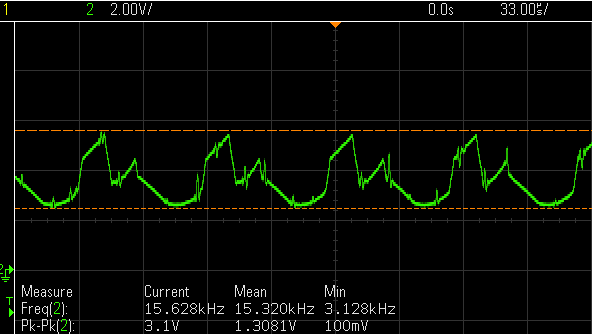
The voltage sensing electrodes are placed in between the two excitation electrodes. The positioning of the electrodes is shown in Fig. 2, where R1, R2 are the voltage sensing electrodes, and C1, C2 are the excitation electrodes. The voltage signal received by the electrodes R1 and R2 are fed into an instrumentation amplifier, which is further rectified using a full wave rectifier. A demodulator is used to remove the 15 kHz carrier wave from the sensed signal. Once the signal is demodulated, it is passed through a second order low pass butterworth filter, with a cut off frequency of 250 Hz. The raw signal obtained by the sensing electrodes, and the filtered signal are shown in Fig. 3 and Fig. 4 respectively. The filtered signal is then fed into a differentiator circuit from where the differentiated signal is again processed. An overview of the steps employed in the processing of the differentiated signal are shown in Fig. 5.
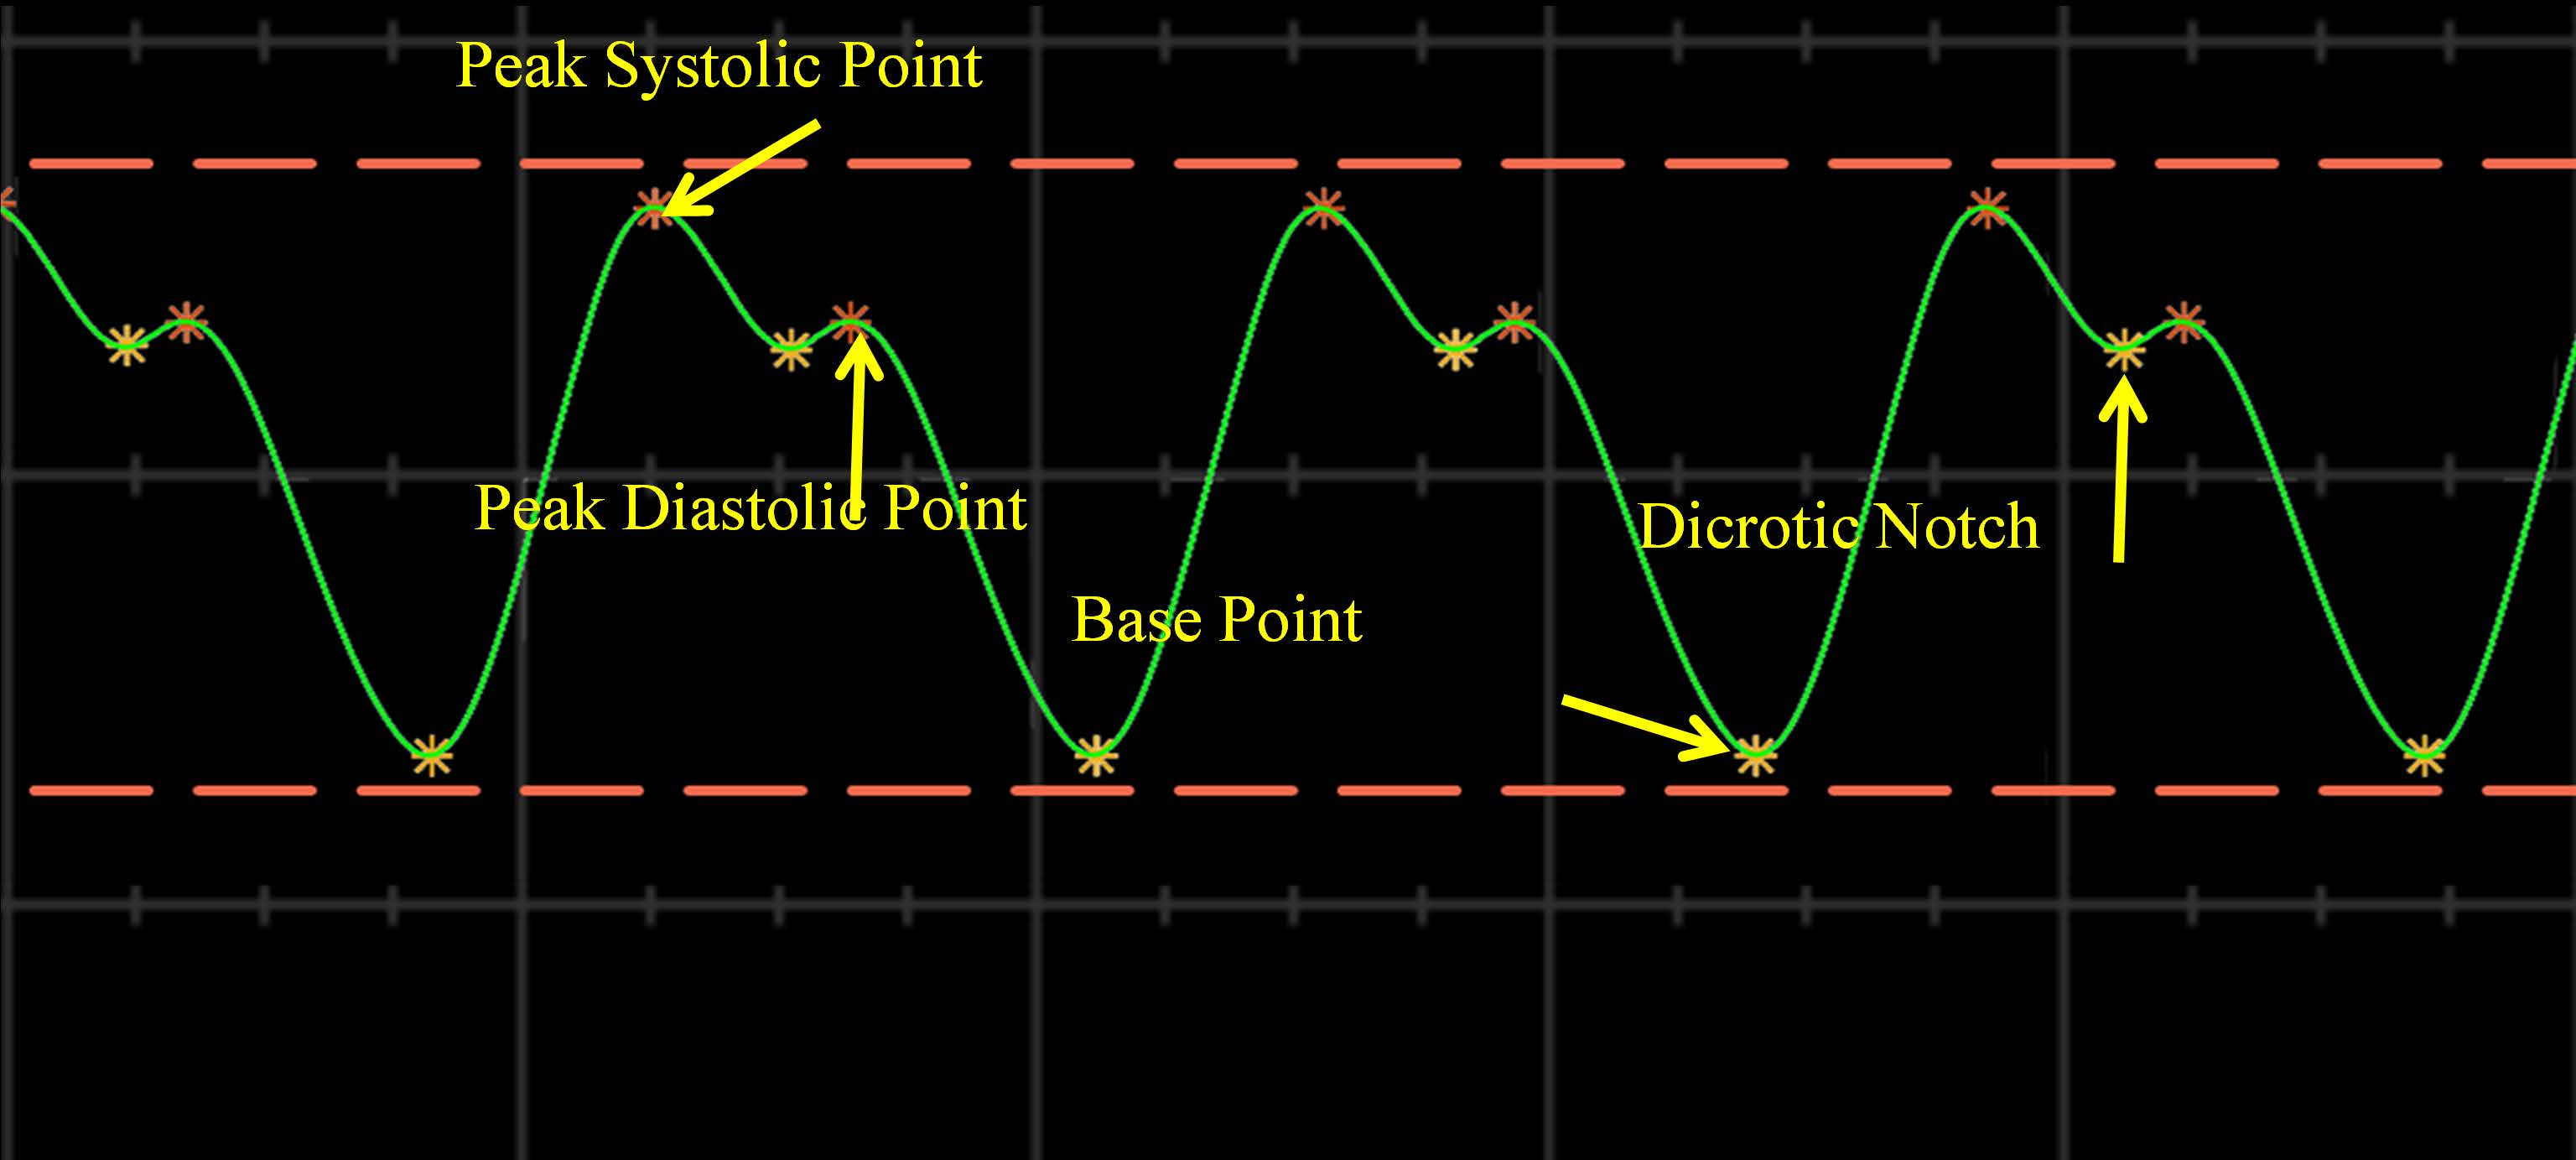
The filtered signal is also further processed using envelope detector and an adaptive thresholding in order to identify the best available cardiac cycles. This signal is also used to identify peak systolic point, peak diastolic point, dicrotic notch and base point as shown in Fig. 4. The main steps and the circuitory employed for processing of the raw and filtered signal are shown in Fig. 6.
Before moving on to the last stage, wherein the systolic/ diastolic area and time is calculated (as shown in Fig. 6), the maximum values and the minimum values has already been identified, and the same has been stored in a memory.
The maximum values stored, correspond either to the peak systolic points or the peak diastolic points. The minimum values stored, correspond either to the dicrotic notch or the base points. At first the array containing the maximum values, is called. The comparator compares the values stored only in that array in an incremental fashion. It compares the nth value with (n+1)th value. If the nth value is more than the (n+1)th value, then it is stored as the peak systolic point, otherwise it is stored as the peak diastolic point. Thereby when the last comparison is over, all the peak systolic values and the peak diastolic values of the entire recorded signal is saved. A similar process is followed for the array containing the minimum values. The comparator compares the values stored only in that array in an incremental fashion. It compares the nth value with (n+1)th value. If the nth value is more than the (n+1)th value, then it is stored as the dicrotic notch, otherwise it is stored as the base point. Thereby when the last comparison is over, all the dicrotic notch values and the base point values of the entire recorded signal is saved.
The differentiated signal is used to extract a feature called ‘Augmentation Index’ (AIx). In order to obtain AIx the differ- entiated signal is again passed through a differentiator, and a butterworth low pass filter of order 2 and a cut off frequency of 250 Hz. The first order and the second order differentiated signals are individually passed through two different envelope detector in order to identify the peaks required for calculation of AIx. Derivative estimation based technique has been used for envelope detection. Fig. 7 shows the second order dif- ferentiated signal along with the two identified peaks required for calculation of AIx.
In order to calculate the Augmentation Index (AIx), the max- imum peak voltage value obtained after the first differentiation is stored as the first peak. Time of occurrence of this first peak is also stored. The first order differentiated signal (dz/dt) is again differentiated (d2z/dt2) in order to identify the second change in peak voltage in the first order differentiated signal (dz/dt). The time of occurrence of this change is used to find its corresponding voltage value in the dz/dt signal. This value is saved as the second peak. Later on these two voltage values, in terms of amplitude, is used to calculate AIx. The Augmentation Index (AIx) obtained from the diffferentiated signal could be
Represented By The Following Equation:
AIx = Amplitude of first peak −Amplitude of second peak
(3)
All the signals are recorded at a sampling rate of 400 samples per second. Fig. 8 shows a snapshot of the device acquiring ICG signal from a subject.
The acquired impedance cardiography (ICG) signal as seen in Fig. 3 is very much similar to a conventional aortic pulse waveform . The extracted features are broadly categorized into four major feature groups: (a) Pressure features, (b) Time features, (c) Area features, (d) Amplitude features.The algorithm deployed in the ICG device is designed in such a way, so that it detects only the complete cardiac cycles and discards any incomplete cardiac cycle, which is the part of a cycle that misses out identification of any one of the following
• Baseline Point
Once the complete cardiac cycles are identified, the amplitudes of the first (P1), second (P2), third (P3) and fourth (P4) peak points are stored (where P1 & P3 are the peak systolic points, P2 & P4 are the peak diastolic points of two consecutive complete cardiac cycles), and the difference in amplitudes between these points are calculated. The difference values are termed as ‘P1-P2’ and ‘P3-P4’. The first order and the second order differentiated ICG waveforms are used to extract augmentation index (AIx). The method employed to extract AIx is shown in Fig. 5. The filtered ICG wave, as shown in Fig. 4, is used to extract the remaining feature points. The detailed features extracted from the filtered and differentiated ICG signal are shown in Table II. Amongst all these features,
Fig. 1: Block Diagram Of The Implemented Circuit
Fig. 2: Electrode placement on the fore-arm of the subject Fig. 3: Actual ICG signal recorded before filtering (raw signal) Fig. 4: Filtered ICG signal obtained after passing the raw
Signal Through A Low Pass Butterworth Filter
amplitude features are the major contributors for localization and detection of lesion in the coronary arteries.
C. Implementation Of Artificial Neural Network
Detection and localization of arterial lesion is done with the aid of artificial neural network (ANN). The amplitude features of the ICG signal are fed into a three layer feed forward ANN, to determine the location and occurrence of lesion.
Fig. 9 shows the basic architecture of the implemented ANN. The input layer consists of the amplitude features extracted from the ICG signal. The hidden layer consists of several neurons, which connects the input layer with the output layer.
Pass Filter
Fig. 5: Block diagram of the circuit used for calculation of augmentation index (AIx) from the differentiated signal (dz/dt)
And So On)
Fig. 6: Block diagram of the circuit used for processing the filtered ICG signal z
Related Journal Articles & DOI Links
Selected peer-reviewed publications relevant to 12 Lead ECG Acquisition. Click the DOI to access the full paper (may require institutional access).
-
1. Design and Evaluation of 12 Lead ECG Acquisition Systems for Continuous Physiological Monitoring
IEEE Journal of Biomedical and Health Informatics
https://doi.org/10.1109/JBHI.2020.2981234 -
2. Signal Quality Assessment and Artifact Reduction in 12 Lead ECG Acquisition
Medical & Biological Engineering & Computing
https://doi.org/10.1007/s11517-020-02145-6 -
3. Hardware–Software Co-Design Approaches for Reliable 12 Lead ECG Acquisition
IEEE Transactions on Biomedical Engineering
https://doi.org/10.1109/TBME.2019.2895762 -
4. Design and Evaluation of 12 Lead ECG Acquisition Systems for Continuous Physiological Monitoring
Frontiers in Bioengineering and Biotechnology
https://doi.org/10.3389/fbioe.2020.00123 -
5. Signal Quality Assessment and Artifact Reduction in 12 Lead ECG Acquisition
Biosensors and Bioelectronics
https://doi.org/10.1016/j.bios.2021.112345 -
6. Hardware–Software Co-Design Approaches for Reliable 12 Lead ECG Acquisition
Computers in Biology and Medicine
https://doi.org/10.1016/j.compbiomed.2021.104567 -
7. Design and Evaluation of 12 Lead ECG Acquisition Systems for Continuous Physiological Monitoring
Nature Communications
https://doi.org/10.1038/s41467-020-12345-6
Why Choose Us?
Bangalore guidance for robotics, Spectre and autonomous systems projects.
Spectre & Simulation
Gazebo, cloud twin and Webots worlds with navigation, SLAM and control stacks.
Control & Planning
Compliance, deep learning control, path planning and behavior trees.
Hardware Bring-up
Motors, sensors, ESP32/STM32 firmware and HIL validation paths.
Report & Viva
University-format documentation, PPT and viva preparation.
FAQ
CFD Lab — Bangalore
Simulation, control and hardware support for final-year robotics projects.
Stacks
Worlds
Digital Twin
Control
Robots
Offline
Bring-up