For Allergic Rhinitis
Yin Li 1*, Yu Xiong 2∗, Wenxin Fan 3, Kai Wang 1, Qingqing Yu 1, Liping Si 4, Patrick van der Smagt 5,6, Jun Tang 1⋆and Nutan Chen 6 3 Chinese Academy of Sciences Shenzhen Institutes of Advanced Technology,
Shenzhen, China
6 Machine Learning Research Lab, Volkswagen Group, Munich, Germany
Abstract
Objective: Subcutaneous Immunotherapy (SCIT) is the long-lasting causal treatment of allergic rhinitis (AR). How to enhance the adherence of patients to maximize the benefit of allergen immunotherapy (AIT) plays a crucial role in the management of AIT. This study aims to leverage novel machine learning models to precisely predict the risk of non-adherence of AR patients and related local symptom scores in three years SCIT.
Methods: The research develops and analyzes two models, sequential latent-variable model (SLVM) of Stochastic Latent Actor-Critic (SLAC) and Long Short-Term Memory (LSTM) evaluating them based on scoring and adherence prediction capabilities.
Results: Excluding the biased samples at the first time step, the predictive adherence accuracy of the SLAC models is from 60% to 72%, and for LSTM models, it is 66% to 84%, varying according to the time steps. The range of Root Mean Square Error (RMSE) for SLAC models is between 0.93 and 2.22, while for LSTM models it is between 1.09 and 1.77. Notably, these RMSEs are significantly lower than the random prediction error of 4.55.
Conclusion: We creatively apply sequential models in the long-term management of SCIT with promising accuracy in the prediction of SCIT nonadherence in AR patients. While LSTM outperforms SLAC in adherence prediction, SLAC excels in score prediction for patients undergoing SCIT for AR. The state-action-based SLAC adds flexibility, presenting a novel and effective approach for managing long-term AIT.
*These authors contributed equally to this work. Frontiers in Pharmacology, research topic: Methods and Metrics to Measure Medication Adherence.
Arxiv:2401.11447V5 [Cs.Lg] 19 Jul 2024
Y. Li et al.
Sequential Model For Predicting Patient Adherence
Keywords: Allergic rhinitis, Allergen immunotherapy, Adherence, Sequential model, Latent variable model
Introduction
Allergic rhinitis (AR) is characterized by allergen-specific IgE-mediated inflammation in upper respiratory inflammation with a prevalence of up to 30% worldwide (Meltzer, 2016). In addition to allergen avoidance as the superior criterion, allergen-specific immunotherapy (AIT) aims to induce specific allergen immune tolerance, consequently achieving a status of clinical symptom remission. The repeatable intake of the specific unmodified or chemically modified allergens (allergoids) was the key to maintaining the symptoms.
Among these approaches of AIT, subcutaneous immunotherapy (SCIT), sublingual immunotherapy (SLIT), and lymphatic immunotherapy (LIT) are demonstrated as the mainstream treatments regarding efficacy, safety, and side effects. Compared to the SLIT, SCIT is a clinic-dependent treatment in which the patient accepted an allergen extract injection subcutaneously. It is divided into the initial treatment stage (dose accumulation stage) and the maintenance treatment stage (dose maintenance stage). The World Allergy Organization (WAO) recommends that immunotherapy be maintained for three to five years and clinically recommended for at least two years. Patient adherence is a critical factor in ensuring long-lasting efficacy and sustaining symptom-relieving effects.
Due to the long duration of SCIT, cumbersome process, slow onset, individual differences in treatment effect, and other factors fundamentally impact the completeness of therapeutics. From the reported studies on AIT, the rate of adherence ranged from around 25% to over 90% (Passalacqua et al., 2013). The World health Organization (WHO) adopted the definition of “adherence” as “the extent to which a person’s behavior, such as taking medication, following a diet, or executing lifestyle changes, corresponds with agreed recommendations from a health care provider” (Organization et al., 2003). In recent European Academy of Allergy and Clinical Immunology (EAACI) guidelines, it is highlighted to educate patients on how immunotherapy works and on explaining the importance of compliance to the regular doses for three years of treatment (Roberts et al., 2018).
The multiple approaches were introduced into the field of improving adherence and supervising patient outcomes with systematic and technological interventions to prevent incomplete discontinuation of the treatment. The intervention from a clinic in advance running through the whole treatment cycle was approved as an effective approach. In facing the multitude of personalized data from patients, how to precisely identify and assess the risk of upcoming non-adherent behavior, a clinical prediction model is promising in the application.
In healthcare, machine learning, especially sequential models, stands at the forefront of innovation, providing new ways to analyze complex medical data and improve patient treatments. Previous research primarily concentrated on non-sequential prediction methods for adherence (Mousavi et al., 2022; Wang et al., 2020; Warren et al., 2022; Ruff et al., 2019). This approach presents a significant limitation in treatment processes, particularly for immunotherapy that often spans extended periods, such as three years.
These non-sequential methods tend to predict only the overall outcome, overlooking the intricacies of intermediate time steps. To facilitate earlier intervention, a sequential model capable of making predictions at any given time step would be markedly more beneficial. While some subsequent studies have introduced sequential models (Hsu et al., 2022; Singh et al., 2022; Schleicher et al., 2023), their scope was restricted to predicting adherence alone. Our study enhances this approach by incorporating a state-action model, which can predict both adherence and score/state. This advancement allows for more precise and detailed
2
Y. Li et al.
Sequential Model For Predicting Patient Adherence
management of AR patients by allergologists. These models excel in processing and analyzing time- dependent data, making them ideal for predicting patient adherence to treatments like SCIT for AIT. By effectively using sequential data, these algorithms uncover temporal patterns and correlations, leading to more accurate and personalized treatment plans.
In this study, in order to introduce the appropriate prediction model into long-period immunotherapy to customize the management of interventions and incorporate patient feedback, we have selected and evaluated two specific sequential models tailored to this scenario. Our findings demonstrate that these models are not only effective in predicting patient adherence to medical treatments but also invaluable in enhancing treatment strategies, thereby making a significant contribution to patient-centered healthcare.
Study Design
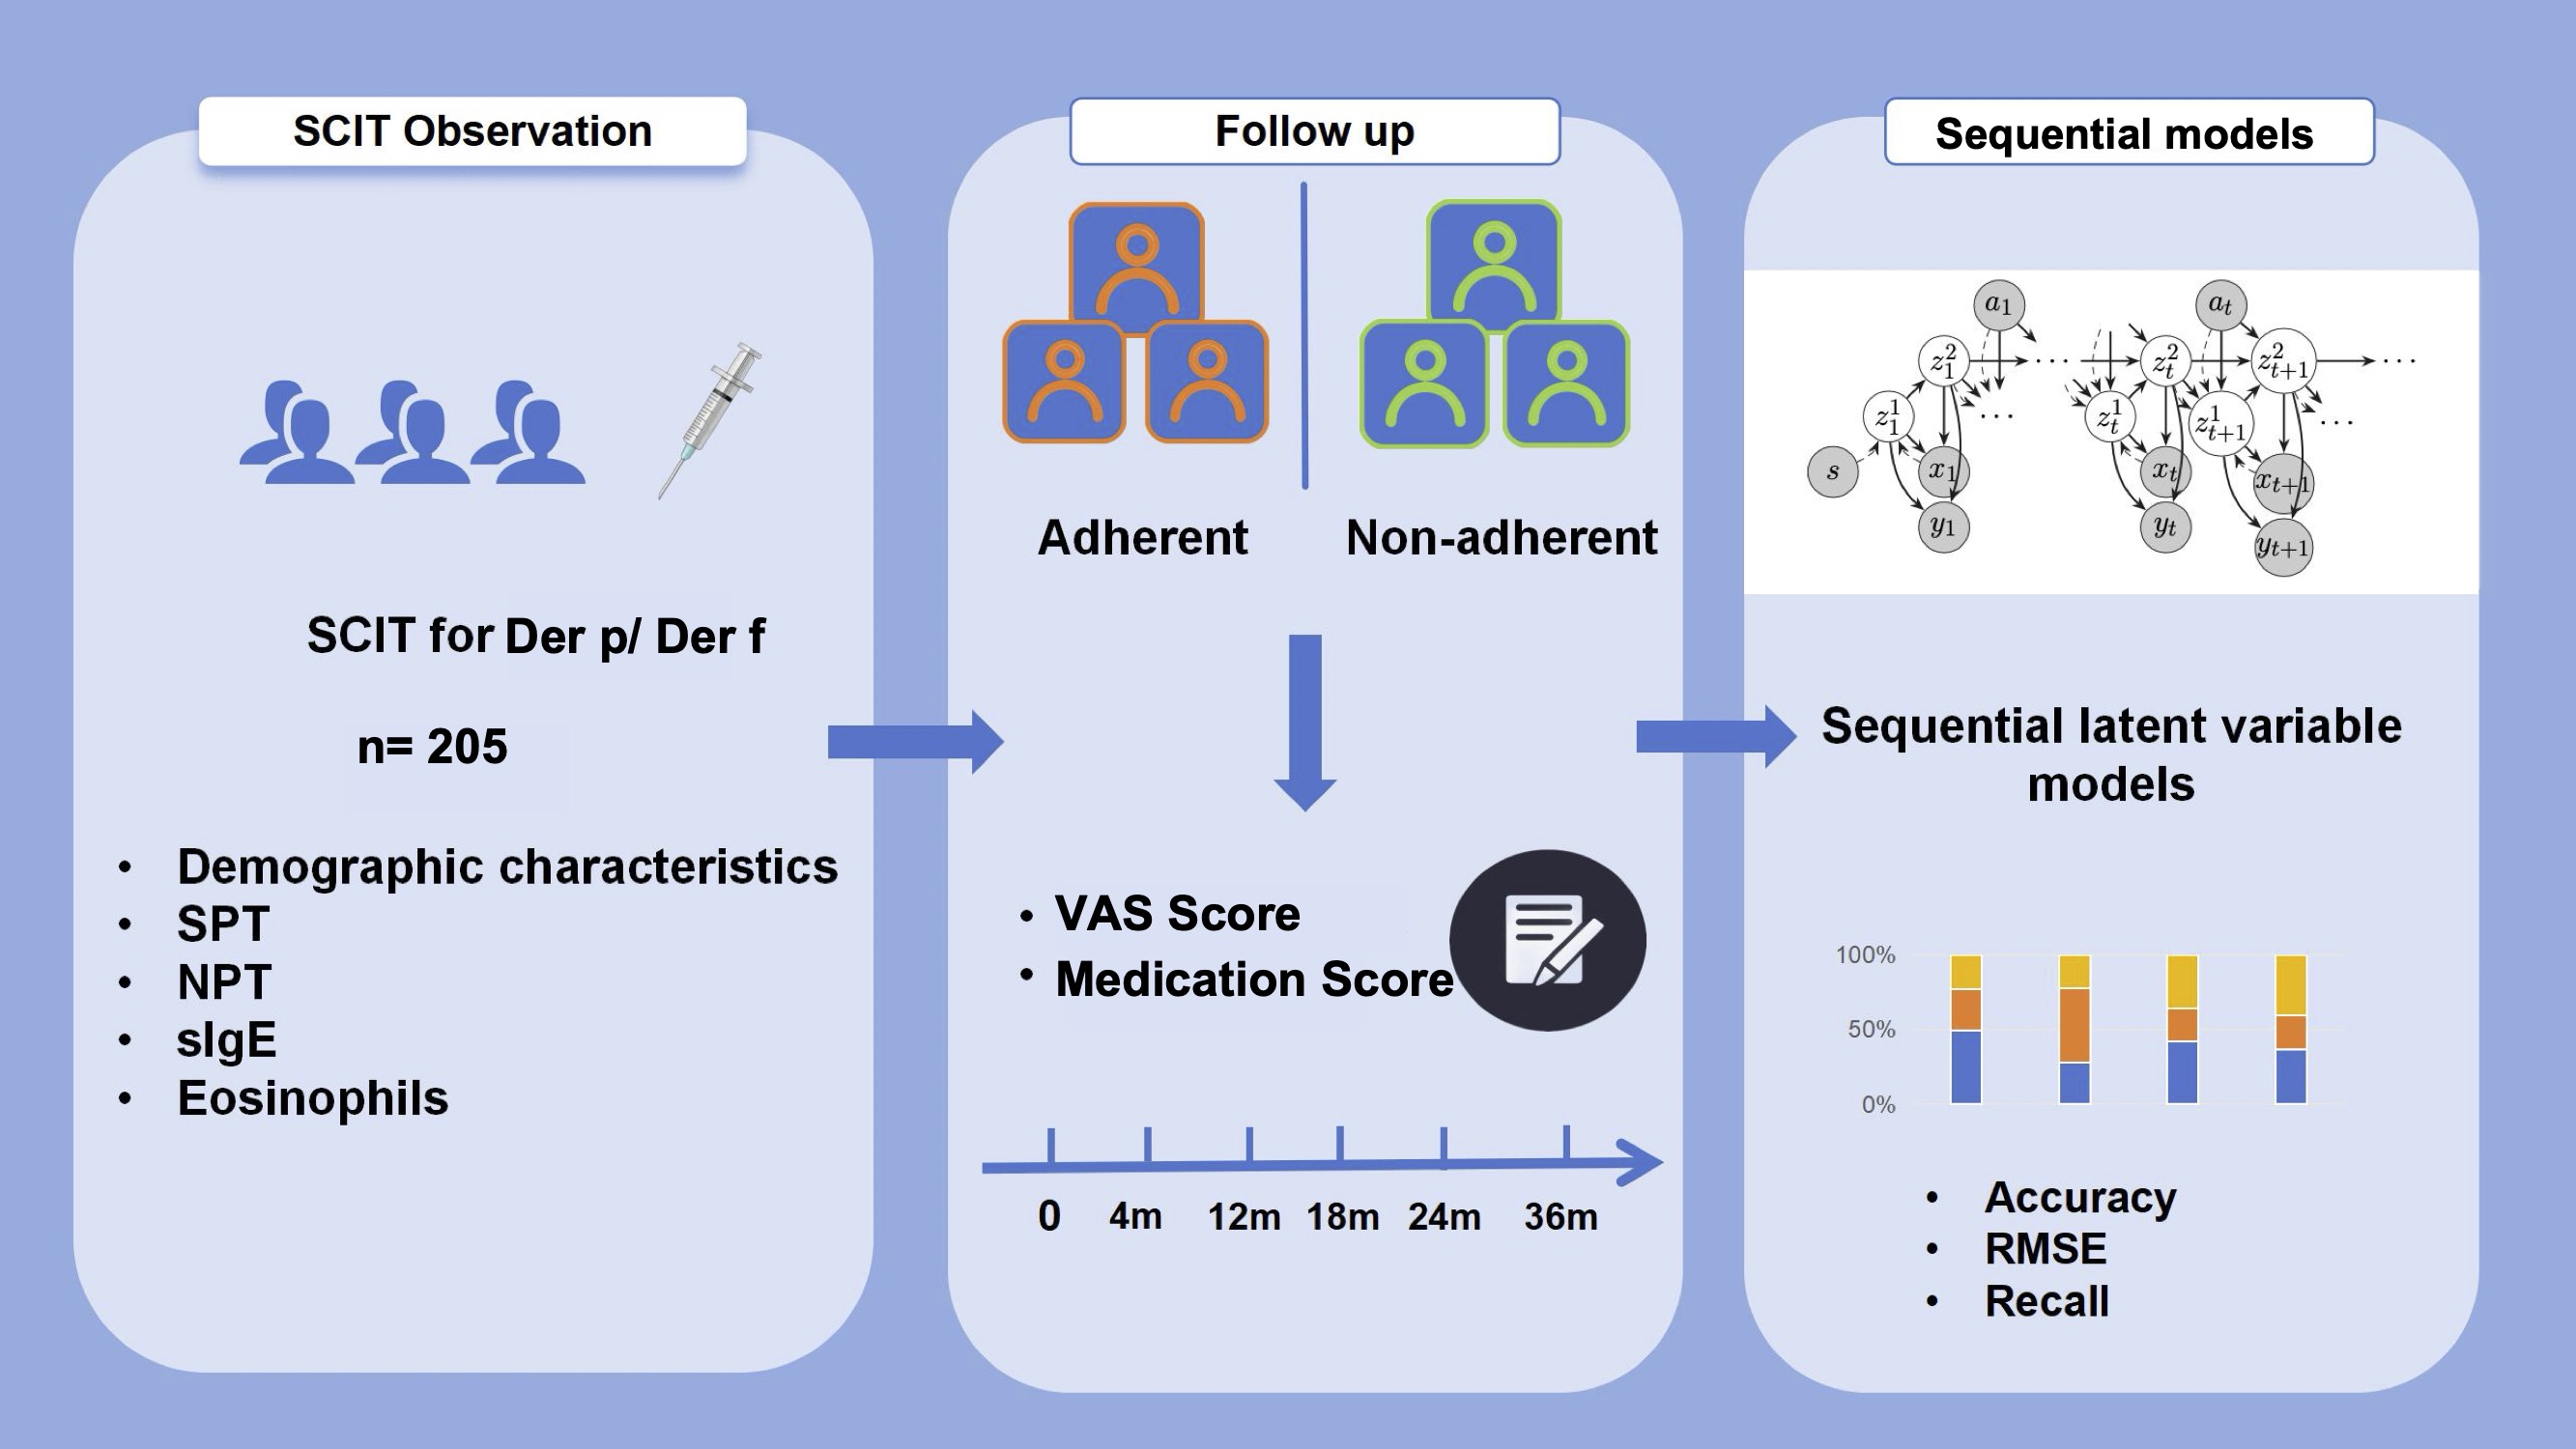
The study design is a critical component that shapes the direction and reliability of our research. It includes a systematic approach to selecting the study population, the treatment methods applied, and the evaluation criteria (see Figure 1).
Figure 1. Flowchart on 205 patients treated with SCIT for Der p/Der f allergy during a 36-month treatment period. The adherence was assessed with sequential latent variable models focusing on patient’s demographic characteristics and clinical follow-up data.
Population
A retrospective analysis including 205 AR patients who started SCIT treatment between August 2018 and September 2019 in the Immunotherapy Center at the First People’s Hospital of Foshan was performed. According to the Guidelines for the Diagnosis and Treatment of Allergic Rhinitis (2015 Edition), the
3
Y. Li et al.
Sequential Model For Predicting Patient Adherence
recruit criteria were formulated: Patients with skin index (SI) of skin prick test (SPT) ++ or above, or specific Immunoglobulin E(sIgE) level in serum to dermatophagoides pteronyssinus (Der p) and/or dermatophagoides farinae(Der f) i. e., Der p/Der f ≥0.35 kU/L, which exposure to dust mites was confirmed as the major allergen by allergen tests, including: (1) Patients with mild to moderate asthma; (2) Patients with moderate to severe persistent rhinitis; (3) Mild to moderate asthma with allergic rhinitis (and/or allergic conjunctivitis); (4) Patients with mild to moderate asthma and eczema. Exclusion criteria included: (1) severe or uncontrolled bronchial asthma with continuous monitoring of Forced Expiratory Volume in one second (FEV1) < 70% per of the expected value; (2) Patients with asthma whose symptoms or reduced lung function continue to fail to be controlled with grade 4 or 5 treatment; (3) Patients sensitized to other allergens such as pet furs, pollens or molds; (4) Patients who are taking beta-2 blockers or angiotensin- converting enzyme inhibitors; (5) Patients with serious underlying diseases, including cardiovascular and cerebrovascular diseases, autoimmune diseases and immunodeficiency diseases, malignant diseases, and chronic infectious diseases; (6) Patients with serious mental illness, lack of compliance, or inability to understand the risks and limitations of treatment. The patients data were anonymized before use.
The study protocol was approved by the Ethics Committee of the First People’s Hospital of Foshan, Foshan, China. All methods were performed in accordance with the relevant guidelines and regulations.
Scit Treatment And Evaluation
Before administering SCIT to enrolled patients, they will first perform a routine physical examination, inquire about related information since the last injection (including allergy symptoms), and post-injection, patients are observed for 30 minutes in case of the occurrence of side effects. Standardized adsorbed Der p and Der f allergen extracts (Allergopharma, Reinbeck, Germany) were used for SCIT. According to the manufacturer’s instructions, in the dose accumulation phase with weekly injections of allergen extracts with a gradually increased concentration from 100 SQ-U/mL to 10,000 SQ-U/mL, respectively injected 0.2, 0.4, 0.8 mL; after reaching the maintenance dose, 100,000 standardized quality units was used. In the maintenance phase, an injection interval of 6±2 weeks was carried out according to the manufacturer’s recommendations.
Patients receive regular treatment evaluations, including symptom scores and medication scores. The symptom score recorded a total of nasal symptoms (nasal itching, sneezing, rhinorrhea, nasal congestion), ocular symptoms (ocular itching, lacrimation), and pulmonary symptoms (shortness of breath, tightness in chest, perennial cough, wheezing), and assessed symptom severity using the visual analogue scale (VAS).
In the VAS symptom score, the score of each symptom is from 0 to 10. 0 indicates that the patient has no discomfort and 10 indicates that the patient is extremely uncomfortable. The patient gives the score of each symptom according to the actual situation, and the sum of all symptom scores is the symptom score.
Medication score recorded the use of current adjuvant medication within 1 month to reach symptom relief. The use of oral antihistamines, antileukotrienes, and bronchodilators were recorded as one point, local glucocorticoids as two points, oral glucocorticoids or combined medication (hormones and β2 receptor agonists) as three points, and the total cumulative score was the medication score. Symptom scores and medication scores were assessed once at registration of SCIT and then thereafter.
Due to the separated injection regimen within 16 weeks and thereafter, all the chosen patients completed the four months of SCIT, we chose the fourth month as the starting point of the observation. According to our previous experience, one year after the start was the peak of the withdrawal, so we added a time point at 18 months to further assess and follow up on the related symptom score and individual status.
The data collection spans six time steps: at 0, 4, 12, 18, 24, and 36 months. This approach is standard in
4
Y. Li et al.
Sequential Model For Predicting Patient Adherence
medical treatment, although for optimal model performance, an equal distribution of time intervals would be preferable.
Data Collection
Data were collected from patient records in hospitals, and the following information was extracted for analysis: patient age, gender, distance to clinic, ratio of AIT cost to family income, allergen test results, etc., as well as patient VAS system score and medication score information, including baseline data of patients before injection therapy, adverse reactions to SCIT. For the descriptive analysis, categorical variables were given as numbers and percentages, and continuous variables were presented using mean, standard deviation, median, interquartile range (IQR), and minimum and maximum values. To address missing values, we tracked every patient, which allowed us to ensure the dataset’s completeness. We did not remove outliers, aiming to follow real-clinical scenarios as closely as possible.
Survey Methods
Adherence was defined as the accomplishment of three years of AIT. Non-adherence was defined as discontinuation of AIT at random time points during three years. The follow-up contents included (1) the main reasons for patients’ discontinuation of treatment; (2) the duration of discontinuation of treatment, and (3) Allergic symptoms after discontinuation of treatment.
Sequential Models
The focus of our study is the development of sequential models that can efficiently and accurately predict the progression of symptoms and adherence in patients undergoing SCIT. This involves a comprehensive analysis of the data collected, structured to provide insights into the treatment’s effectiveness and patient compliance over time. Additionally, we explore and compare two distinct sequential models.
Data
We have a dataset D, comprising sequences x1, . . . , xT ∈R11, y1, . . . , yT−1 ∈R1, and a corresponding action at ∈R1. In the context of healthcare, the observations encompass yt (see Table 2) whether the patient will cease the treatment in the interval between the scoring measurements at xt and xt+1. The actions at represent the ongoing medical procedures for the patient during the period from xt to xt+1 (see Fig. 2). In this context, at is binary, reflecting whether treatment is given, and is numerically equivalent to the adherence variable yt. Despite their numerical equivalence, we maintain a distinction between action at and adherence yt to enhance model clarity and accommodate future research expansions, potentially allowing for a wider range of action values. For each patient, we possess basic information s ∈R14 which includes age, gender, commute distance to clinic, ratio of cost to family income, eosinophils count, eosinophils percentage, nasal allergen provocation test (change of nasal resistance, ∆NR(%)), peak nasal inspiratory flow. ∆PNIF(%)), serum total IgE level, sIgE of Dermatophagoides pteronyssinus (Derp), sIgE of Dermatophagoides farinae (Derf), skin prick test (Derp, Derf) (see Table 1 for more details).
Sequential Latent Variable Model
In our research, we use the Stochastic Latent Actor-Critic (SLAC) model (Lee et al., 2020). Our application differs from the original use of SLAC which is typically associated with reinforcement learning. Instead, we use its sequential latent-variable model (SLVM) without Actor-Critic. This approach aligns with similar methodologies found in other works (Krishnan et al., 2015; Karl et al., 2016; Gregor et al.,
5
Y. Li et al.
0.80; 0.45
Table 1. Demographic and clinical data of the patients under subcutaneous immunotherapy. In the rows from Age to Cost/Family income, values indicate the number of patients (percentage, if available). Other rows represent the median and IQR. P-values are omitted due to their large values.
132
Table 2. Detailed reasons for withdrawal from SCIT at different time points. 2018). The choice of the SLAC model was motivated by its ability to facilitate more efficient learning and superior generalization in intricate environments.
The SLVM is fundamentally a framework that processes information in a step-by-step manner, capturing the dynamics of an environment or process over time. It constructs a latent representation of the data that it identifies and uses underlying patterns or structures within the dataset that probably are not immediately obvious. This capability makes it exceptionally suitable for tasks where understanding temporal relationships is crucial, such as predicting patient adherence in allergen immunotherapy. The model operates by generating a sequence of predictions, each informed by the data received up to that
6
Y. Li et al.
Time Step 6
Figure 2. Histogram of scores across six time steps. Score value (horizontal axis) vs. count (vertical axis). point, thereby enabling it to adapt and refine its understanding as more information becomes available. This methodological choice allows our research to use the strengths of SLAC in a novel context, applying it to the predictive modeling of patient behaviors in a healthcare setting.
After training the model, given the historical data up to step t −1, the model is capable of generating a patient’s next scores from time step t to T directly from the latent space i.e., p(xt:T | x0:t−1, a0:t−1). Similarly, it can predict the adherence of step t : T −1 at time step t, p(yt:T−1 | x0:t, a0:t−1). See details of the model and the training process in Appendix 1.
Lstm
As an alternative, Long short-term memory (LSTM) is a classical sequential neural-network model (Hochreiter and Schmidhuber, 1997). Given the historical data, in our implementation, an LSTM predicts the score xt+1 and adherence yt in parallel. The LSTM’s autoregressive feature allows us to iteratively input its current predictions to predict subsequent outcomes, covering prediction from xt+1 to xT and yt to yT−1. Implementation details and the reasons for the model choice can be found in Appendix 2.
7
Y. Li et al.
Results
A total of 205 patients were enrolled in this study. The mean age was 17.57 ± 11.68 years, children and adolescents represented the major population (61.3 %) in AIT treatment. Males (70 %) were predominantly represented. The population with a commute distance to the clinic within 10 km was 66 percent. Due to a great portion of juveniles from the cohort, the ratio of cost to family income instead of personal income was evaluated. The patients who undertook AIT cost less than 30% of monthly family income and account for half the distribution of the population, while 12.9% non-adherent patients undertook the 50% financial burden in AIT treatment.
The change of nasal resistance (NR) and peak nasal inspiratory flow (PNIF) after nasal allergen provocation (NPT) was used to evaluate the severity of symptoms by combining the symptom score. The change of NR after NPT from the adherent group was higher than the non-adherent group (30 % vs 14.8 %).
The laboratory tests such as total IgE, sIgE of Der p and Der f, and SPT did not exhibit a significant difference between the two groups. For detailed characteristics of patients see Table 1. The observed total non-adherence rate at the end of three years was 35.4% and the median of the SCIT duration was 18 months in the study. The rate of dropout in the third year (43.0%) was highest in comparison to the end of the first year (26.5%) and the second year (30.0%). The reason for the withdrawal from the patients included the concern of COVID-19, especially at the beginning of 2020 accounting for a 25% portion of the non-adherent patients in the first year. The most influential reason for the withdrawal was unreached expectations for clinical improvement (43.9%). Medical issues including pregnancy status during the treatment period and other physical disorders were collected from patients leading to the withdrawal of SCIT (4.5%). The significantly improved symptoms contributed to the reason for dropout, especially after two years SCIT treatments (18.2%). The recorded cases from side effects accounted for 4.5%, comprising the local and systematic adverse reactions (see Table 2).
We have a total of 205 samples, which we have randomly divided into a test dataset comprising 20%, i.e., 41 samples. For our analysis, we employ a five-fold cross-validation approach. Additionally, we apply zero-mean and unit standard deviation (STD) normalization to the variables x and s.
The Root Mean Square Error (RMSE) metric is used to evaluate the precision of our medical score predictions. Furthermore, to assess the adherence predictions, we use a comprehensive set of metrics including accuracy, precision, recall, and the F1 score, each offering a unique perspective on the performance of our predictive models. Most of the figures in this study are presented using boxplots.
In all results in this study, the uncertainties for both models are calculated using five-fold cross-validation. In addition, as SLAC is a probabilistic model, we also perform 100 samples from the latent space to compute its uncertainty.
One-Step Prediction
In this experiment, our focus is on predicting the immediate next step. Within the SLVM, the prediction of yt is based on the sequence x1:t and actions a1:t−1. Additionally, we forecast the subsequent state xt+1 using the sequence x1:t along with actions a1:t. In contrast, for LSTM, the predictions for both yt and the next state xt+1 are derived from x1:t and y1:t−1.
As illustrated in Fig. 3, SLVM surpasses LSTM in performance beginning at time step two. The figure indicates that with an increased amount of historical data (additional time steps), SLVM achieves greater RMSE. Both SLAC and LSTM demonstrate considerably better over random prediction methods. Further
8
Y. Li et al.
Lstm
Figure 3. RMSE of the prediction step by step. The red dashed line is the RMSE of random prediction with Uniform distribution. See Fig. 5 and 6 for more details.
Lstm
Figure 4. Accuray of the prediction step by step. The red dashed line is the accuracy of random prediction with Uniform distribution. See Table 3 for more details. insights are provided in Fig. 5 and Fig. 6, which provides detailed representations of each feature. In the prediction of specific local symptoms score, SLVM performs an improvement in error after step two with all parameters compared to LSTM. The results from RMSE in nasal and ocular symptoms display relatively high values compared to those for lower respiratory tract symptoms. This can be attributed to the fact that the majority of patients in the cohort predominantly exhibited nasal and ocular symptoms, which presented a wide range of scores.
Fig. 4 demonstrates that from steps two to four, accuracy in adherence predictions improves with the inclusion of additional information. The first step shows a notable bias, as it only includes data from adherent patients, as detailed in Sec. 2.1.2. Nonetheless, both models adeptly manage this bias and achieve high-accuracy predictions. Prediction for the sixth step is not conducted due to the cessation of treatment by the hospital. In the fifth step, there is a decline in accuracy, likely due to the extended time interval of 12 months. In future research, it would be worthwhile to explore whether adopting a consistent interval
9
Y. Li et al.
Time Step 5
Figure 5. RMSE of SLAC one-step prediction across various scores and time steps.
0.54 ± 0.06
Table 3. Comparison of LSTM and SLAC over different time steps. The results are expressed as a mean ± standard deviation. The better results are highlighted in bold. for data collection could enhance the outcomes of longitudinal prediction. Table 3 illustrates details of the classification for one-step prediction. Initially, both models exhibit perfect performance in Accuracy, Precision, and Recall at the first time step, but diverge in subsequent steps. In terms of Accuracy, LSTM generally outperforms SLVM, particularly evident at time steps three, four, and five. For Precision, LSTM again shows superior performance in the later time steps, except at time step two where SLVM marginally leads. However, in the Recall metric, SLVM surpasses LSTM from time step two onwards, indicating its strength in correctly identifying positive cases. The F1 score, which balances precision and recall, shows
Related Journal Articles & DOI Links
Selected peer-reviewed publications relevant to 12 Lead ECG Acquisition. Click the DOI to access the full paper (may require institutional access).
-
1. Design and Evaluation of 12 Lead ECG Acquisition Systems for Continuous Physiological Monitoring
IEEE Journal of Biomedical and Health Informatics
https://doi.org/10.1109/JBHI.2020.2981234 -
2. Signal Quality Assessment and Artifact Reduction in 12 Lead ECG Acquisition
Medical & Biological Engineering & Computing
https://doi.org/10.1007/s11517-020-02145-6 -
3. Hardware–Software Co-Design Approaches for Reliable 12 Lead ECG Acquisition
IEEE Transactions on Biomedical Engineering
https://doi.org/10.1109/TBME.2019.2895762 -
4. Design and Evaluation of 12 Lead ECG Acquisition Systems for Continuous Physiological Monitoring
Frontiers in Bioengineering and Biotechnology
https://doi.org/10.3389/fbioe.2020.00123 -
5. Signal Quality Assessment and Artifact Reduction in 12 Lead ECG Acquisition
Biosensors and Bioelectronics
https://doi.org/10.1016/j.bios.2021.112345 -
6. Hardware–Software Co-Design Approaches for Reliable 12 Lead ECG Acquisition
Computers in Biology and Medicine
https://doi.org/10.1016/j.compbiomed.2021.104567 -
7. Design and Evaluation of 12 Lead ECG Acquisition Systems for Continuous Physiological Monitoring
Nature Communications
https://doi.org/10.1038/s41467-020-12345-6
Why Choose Us?
Bangalore guidance for robotics, Spectre and autonomous systems projects.
Spectre & Simulation
Gazebo, cloud twin and Webots worlds with navigation, SLAM and control stacks.
Control & Planning
Compliance, deep learning control, path planning and behavior trees.
Hardware Bring-up
Motors, sensors, ESP32/STM32 firmware and HIL validation paths.
Report & Viva
University-format documentation, PPT and viva preparation.
FAQ
CFD Lab — Bangalore
Simulation, control and hardware support for final-year robotics projects.
Stacks
Worlds
Digital Twin
Control
Robots
Offline
Bring-up