Alexander Gersten
Additional information is available at the end of the chapter
1. Introduction
The Near Infrared spectroscopy (NIRS) is a technique, which allows measuring the oxygena‐ tion of the brain tissue [22, 1, 6, 9, 37, 52, 58, 63]. The problem is to penetrate the brain with a light, which can cross the skin and skull and be absorbed mostly by the hemoglobin (HbO2) and the deoxyhemoglobin (Hb). The ratio of the oxygenated hemoglobin (HbO2) to the total hemoglobin (tHb=HbO2+Hb) is the regional oxygen saturation rSO2. It appears that the most suitable light is in the 650-1000 nm range of the near infrared light. In this range, there exists another absorber cytochrome oxidase (CtOx), but as its concentration is quite small, it is often neglected . Instruments that take into account the CtOx use 3 different wavelengths, otherwise 2 wavelengths are used.

There is a continuous improvement in the instrumentation. Three types are in use: continuous wave (CW) mostly used, time resolved and intensity modulated . An improved resolution is obtained using the spatially resolved spectroscopy (SRS), in which multi-distance sensors are used. Another distinction can be made. Photometers, are the simplest, they use CW light, single-distance and one sensor. The oximeters use multi-distance (SRS) techniques with CW and usually two sensors [15, 9, 58]. Multi-channel CW imaging systems generating images of a larger area started to be used [15, 52].
© 2015 The Author(s). Licensee InTech. This chapter is distributed under the terms of the Creative Commons Attribution License (http://creativecommons.org/licenses/by/3.0), which permits unrestricted use, distribution, and reproduction in any medium, provided the original work is properly cited.
We have done measurements with two instruments: the INVOS Cerebral Oximeter of Soma‐ netics (www.somanetics.com; Thavasothy et al., 2002), and the hemoencephalograph (HEG) photometer of Hershel . The results are presented in the following sections.
2. Theoretical Considerations
The theoretical considerations are based on the modified Beer-Lambert law ,
2
2
...
(1)
where A is the attenuation coefficient, measured in optical densities (OD),
(2)
I0 is the incident light intensity and I the intensity of the light collected by the sensor after returning from the brain. It is a generalization of Beer-Lambert Law, in which the attenuation A of an incident light is proportional to the concentration c of the compound in the solution and the optical
(3)
a is the specific extinction coefficient of the absorbing compound (measured in 1/micromolar per cm), c is the concentration of the absorbing compound in the solution (measured in micromolar), d is the distance in cm that the light covers in the medium, a∙c is the absorption coefficient of the medium. For different absorbing compounds, the absorbing coefficient is the
/
... .
(4)
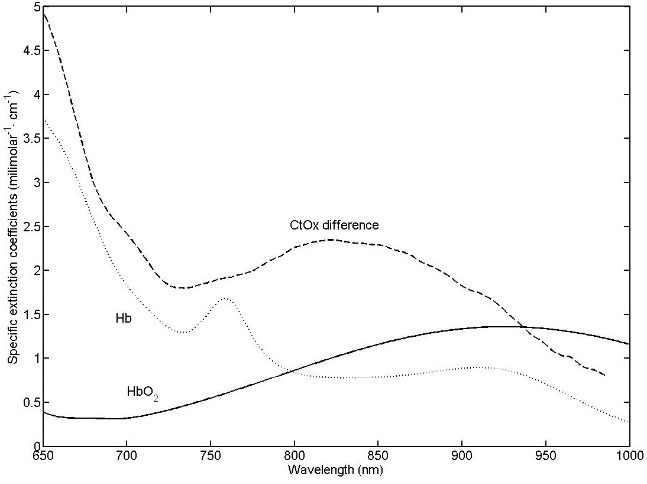
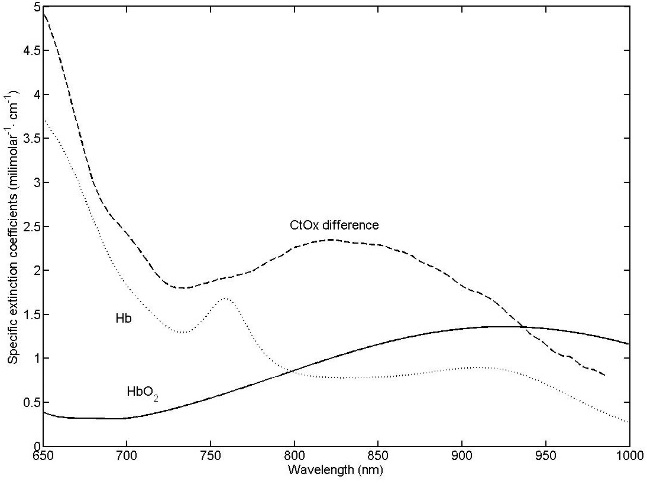
The Beer-Lambert law should be modified to include a term G that describes the scattering attenuation and a multiplying factor due to scattering, the differential pathlength factor (DPF), which multiplies the length d. All these corrections appear in the modified Beer-Lambert law as given in Eq. (1).In Fig.1 the specific extinction coefficients of hemoglobin (HbO2), the deoxyhemoglobin (Hb) and cytochrome oxidase (CtOx) are displayed.
Infrared Spectroscopy - Anharmonicity of Biomolecules, Crosslinking of Biopolymers, Food Quality and Medical
30
Figure 1. The specific extinction coefficients of HbO2, Hb, and the difference absorption spectrum between the oxi‐ dized and reduced forms of CtOx, the data are from . It appears that DPF depends on the human age. According to :
(5)
where DPF780 is the PDF at 780 nm and Y is the age of the subject in years.
3. Oxygen Utilization
For a more complete description of oxygen utilization see . Here we will only mention that "a typical oxygen carrying capacity of the blood is 19.4 ml of O2 per dl of blood with 19.1 ml O2/dl carried by hemoglobin and only 0.3 ml O2/dl dissolved in plasma . A typical averaged value for adult cerebral blood flow (CBF) is 47.7 ml/100 ml/min (Frackowiak et al., 1980) corresponding to total oxygen delivery of 9.25 ml O2/100 ml/min. . Typical oxygen consumption of the adult brain is 4.2 ml O2/100 ml/min (Frackowiak et al., 1980). CBF, cerebral blood volume (CBV) and cerebral oxygen extraction (COE) are significantly greater in grey matter compared to white matter in normal human adults (Lammertsma et al., 1983; cope, 1991). Only part of the arterial oxygen that arrives in the brain is absorbed and utilized. The fraction that is utilized, known as the oxygen extraction fraction (OEF), is defined as
(6)
where SaO 2 and SvO2 are the arterial and venous oxygen saturations respectively." Probing Brain Oxygenation with Near Infrared Spectroscopy (NIRS) — The Role of Carbon Dioxide and Blood Pressure
31
In a well-done experiment, the EOF, measured in normal control subjects, was 0.41±0.03 . Assuming SaO2 equal to 0.95 (an average adult value) the SvO2 will be, using Eq. (6), equal to 0.56±0.03. In the brain tissue, the absorption of the hemoglobin is mostly venous. A 75% venous contribution, leads in the frontal region to rSO2 of about 66±3%, which is observed in experi‐ ments.
4. The Invos Oximeter
The Somanetics INVOS Cerebral Oximeter (ICO) uses two wavelengths, 730 and 810 nm and measures rSO2 of the brain in the area under the sensor, which is attached to the forehead. The spatially resolved spectroscopy (SRS) method is applied by using in the sensor two source- detector distances: 3 cm from the source and 4 cm from the source, which penetrates deeper into the brain. The SRS method leaves a signal originating predominantly in the brain cortex.
Oximeter provides a "predominately cerebral" measurement where over 85 percent of the signal, on average, is exclusively from the brain” (www.somanetics.com).
5. The Heg
The Toomim's hemoencephalograph (HEG) uses two wavelengths, 660 and 850 nm is a single- distance CW spectrophotometer. The distance between the source and receiver is 3 cm. The HEG measures the intensity ratios of the 660 nm light to 850 nm light. The HEG does not measure rSO2, but is an important tool in the biofeedback research. The HEG is a very sensitive device. The source-detector is 3 cm, while the Somanetics INVOS Cerebral the oximeter has two distances 3 and 4 cm. Therefore, the INVOS Oximeter penetrates deeper into the brain and is more stable and less influenced by biofeedback.
A normalization of the HEG readings was done using measurements of 154 adult attendees at a professional society meeting, which is not directly related to rSO2. We have shown (Gersten et. al. 2011a) that one can relate the readings of the HEG to rSO2 and even calibrate it separately for each individual. An improved derivation is given below.
6. Evaluating The Rso2 From Ratios Of Intensities
The regional hemoglobin saturation (rSO2) is defined as
(7)
Infrared Spectroscopy - Anharmonicity of Biomolecules, Crosslinking of Biopolymers, Food Quality and Medical
32
which is the percentage of the total hemoglobin that is oxygenated. Above CHb and CHbO2 are the concentrations of deoxyhemoglobin and oxyhemoglobin respectively. The modified Beer- Lambert law, Eq. (4), for a definite wavelength λ is,
C
d DPF G.
(8)
It will be more convenient to work with natural logarithms ln;
A(Λ)=Log10(I0(Λ)/I(Λ))= -Ln(I(Λ)/I0(Λ))/00(10),
Let us define the ratio of the relative intensities with wavelengths λ1 and λ2 as,
Ln(R1,2)=Ln(R(Λ1, Λ2))=Ln(10)×(A(Λ2)-A(Λ1)),
The scattering component G is generally unknown and is highly dependent on the measure‐ ment geometry making it difficult to obtain absolute value of attenuation as a function of chromophore concentrations. However, under the assumption that G does not change during the measurement period, it is possible to determine changes in attenuation. Under this assumption, using Eq. (8), G is cancelled out in A(λ2)-A(λ1), and we obtain,
C
d DP .
)
.
(12)
Probing Brain Oxygenation with Near Infrared Spectroscopy (NIRS) — The Role of Carbon Dioxide and Blood Pressure
Rso
.
(16)
Above, the constant M is not known. One can determine it in two ways, by introducing a third wavelength, or by calibrating with other device. If third wavelength is added one obtains,
(17)
from which rSO2 can be evaluated. If one would like to calibrate M using other device, one can calibrate M only with respect to a standard total hemoglobin C0,
(18)
Where CTot can be determined from a blood test. 7. Peculiarities of brain's blood flow: Role of carbon dioxide Breathing may have dramatic effects on the brain blood flow. This was already known long time ago to Chinese, Indians and Tibetans. We will develop simple mathematical models which allow a quantitative description of cerebral blood flow. In recent years considerable progress was made in utilizing measurements of the regional cerebral blood flow (rCBF) in order to study brain functioning [44, 2, 8]. It seems however that the physical and mathematical aspects of the global cerebral blood flow (CBF), or average rCBF, were not sufficiently explored. Our Infrared Spectroscopy - Anharmonicity of Biomolecules, Crosslinking of Biopolymers, Food Quality and Medical
34
main interest is the use of physical principles , physical and mathematical reasoning as well as means to describe the main features of CBF in a simple way. The human brain consists of about 2% of the adult body weight, but consumes (at rest) about 15% of the cardiac output (CO) and about 20% of the body’s oxygen demand [61, 25]. Glucose is the main source of cellular energy through its oxidation . The cerebral glucose utilization is almost directly proportional to the CBF, [29; 33]. The CBF can be influenced by abnormal glucose levels, is increased during hypoglycemia and decreased during hyperglycemia . Normal mean CBF is approximately 50-55 ml/100g/min, but declines with age (above the age of about 30), in a rate of approximately 58.5-0.24×age ml/100g/min [50, 27], see also , for other details).
The cardiac output can be increased many times (up to about tenfold) during very heavy exercise or work. Only part of the cardiac output increase can be accommodated by the brain blood vessels because of autoregulatory mechanisms and because of the vessels limited capacitance, which is influenced by their elasticity, limited space of the cranium and the presence of the cerebrospinal fluid (CSF).
Autoregulatory mechanisms exist, which maintain the CBF approximately constant for cerebral perfusion pressure (CPP) over an approximate range of 60-160 mm Hg [29, 67]. Outside this autoregulatory range the CBF may decrease (CPP<60 mm Hg) as in the case of hypotonia or increase (CPP>160 mm Hg) as in the case of high hypertension . Again, the above statements are valid only for normal functioning. For some abnormal functioning the autoregulatory mechanisms may break down, for example if PaCO2> 70 mm Hg [29, 30].
The CBF is also influenced by the value of cerebral tissue PaO2, whose normal range is about 100 mmHg. Only below approximately 40-50 mmHg there will be a very strong increase of CBF , mobilizing the organism to prevent suffocation. The main parameter influencing the CBF is the arterial PaCO2. About 70% increase (or even less) in arterial PaCO2 may double the blood flow (normal value of PaCO2 is about 40 mmHg.) [61, 25].
The CBF is very sensitive to PaCO2and it is our aim to demonstrate with a simple physical model that important information about CBF capacitance can be obtained by considering only the dependence of CBF on PaCO2. Slowing down the breathing rate, without enhancing the airflow [20, 18, 19], or holding the breath, can increase PaCO2. It is plausible that this is one of the essences of yoga pranayama [4, 39, 40, 46], and of Tibetan six yogas of Naropa [13, 51]. It seems that biofeedback training of breathing , or methods advocated in yoga, may become important for treating health problems.
In Sec. 8 We have developed a simple physical model, and have derived a simple four parameter formula, relating the CBF to PaCO2. With this model experimental data sets of rhesus monkeys and rats were well fitted. In Sec.9 exact formulae were found, which allow to transform the fits of one animal to the fits of another one. The merit of this transformation is that it allows to use rats data as monkeys data (and vice versa) simply by rescaling the PaCO2 and the CBF data.
Probing Brain Oxygenation with Near Infrared Spectroscopy (NIRS) — The Role of Carbon Dioxide and Blood Pressure
35
8. A mathematical model of CBF as a function of arterial CO2 Inspection of experimental data, especially the more accurate ones on animals, like those done with rhesus monkeys , or with rats led us to conclude that the CBF (which will be denoted later as B) is limited between two values. We interpreted this as follows: the upper limit Bmax corresponds to maximal dilation of the arterioles and the lower (non-negative) limit Bmin to the maximal constriction of the vessels. Reivich has fitted his data with a logistic model
(19)
where p= PaCO2 in mmHg. Instead of the variable B (the CBF) we will use the normalized to
Min
.
(20)
The dependence of the CBF on PaCO2 will be described with the dimensionless variable x=log(p/p1), where p= PaCO2 in mmHg and p1 is a fixed value of PaCO2, which may be taken to be p1=1mmHg. The variable p is physical only for p≥0, in order to avoid formulae which may be valid for p<0 the variable x=log (p/p1), valid for p≥0 was introduced. We can incorporate the above requirements and use the following assumptions:
(21)
where A is a constant (reactivity), and F(z) is a function which depends on CBF only. We will
(22)
where F ′(z)=dF(z) / dz. The condition F(0)=0 corresponds to the requirement that the constric‐ tion is maximal at B=Bmin, F(1)=0 correspond to maximal dilation for B=Bmax. Another physical boundary constraint can be formulated for the derivatives F ′(z) as follows: F ′(0)= F ′(1)=0, Infrared Spectroscopy - Anharmonicity of Biomolecules, Crosslinking of Biopolymers, Food Quality and Medical
36
which means that the approach to the limits is smooth. We will assume that the constricting and dilating forces are the same; mathematically this condition can be expressed in the
(1
).
(23)
There are many solutions, which satisfy the requirements Eqs. (21-23). We found the following
),
2.
(25)
which will also enable us to integrate analytically Eq. (21) and to obtain a rather simple result to visualize. We will be able to utilize it for rescaling rats data to rhesus monkeys data and eventually to human data. This path will also enable us to translate rats data to monkey and
Min
.
(28)
Probing Brain Oxygenation with Near Infrared Spectroscopy (NIRS) — The Role of Carbon Dioxide and Blood Pressure
37
where C is an arbitrary constant. From Eq. (28) we obtain,
)
.
(31)
From Eq. (31) and the relation: arcctg(πz) + arctg(πz)=
(32)
Eq. (32) describes the dependence of CBF (z in Eq. (32)) on p in terms of 5 parameters: zr, xr, A, Bmin, Bmax. The number of parameters can be further reduced to four.
8.1. The Four Parameter Formula
A simple way to eliminate zr from Eq. (32) is to choose zr=0.5 (the value half way between the extremes) then ctg(πzr) = 0. Eq. (32) will have the simple form,
(34)
Infrared Spectroscopy - Anharmonicity of Biomolecules, Crosslinking of Biopolymers, Food Quality and Medical
38
and after substituting x=log(p/p1), the four parameter formula is
(
).
(36)
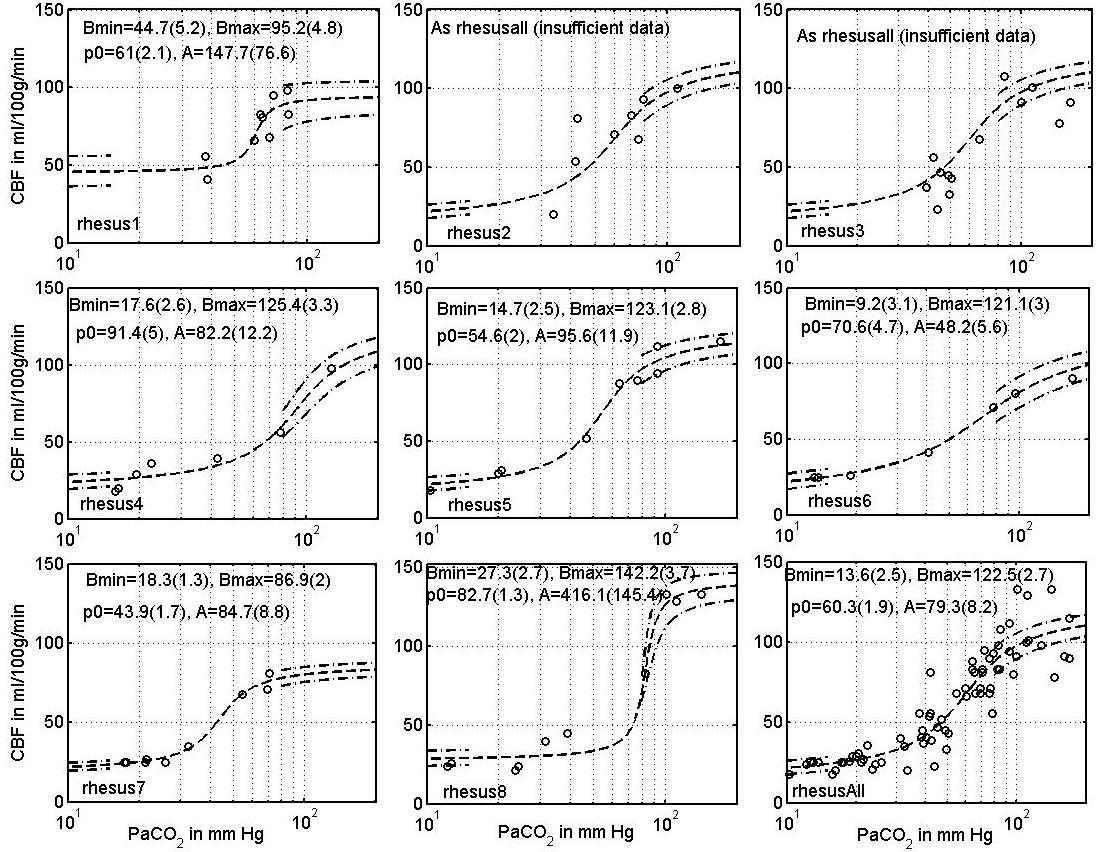
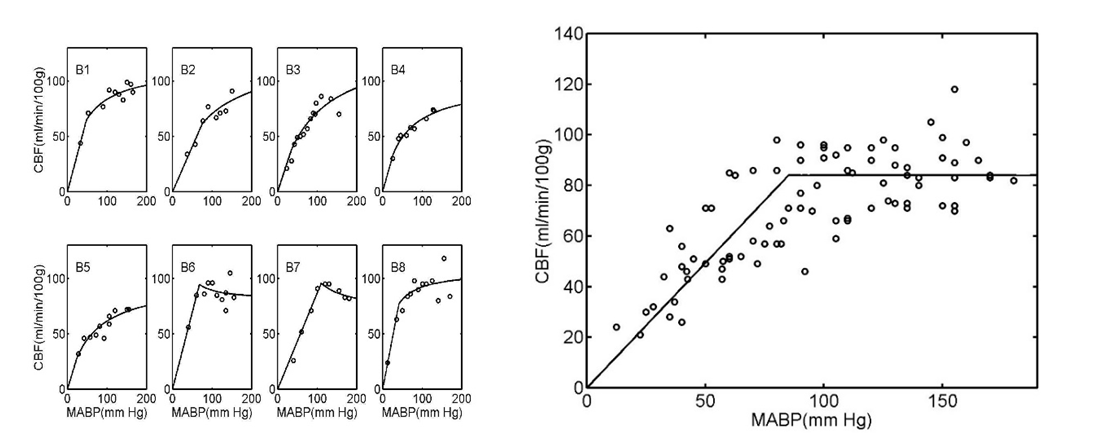
8.2. Experimental data with rhesus monkeys and rats To our knowledge the experimental data of Reivich are the only published data which tabulate CBF and PaCO2 for individual animals. This will enable us to check our model and find individual variations. The fit results are given in table 1. and displayed in Fig. 1. It should eters. In Fig. 1, the dotted lines were obtain ned using the all monkeys parameters. This model seems to describe the main features of the data.
251.5±18.1
Table 1. The fit of Eq. (36) to experimental data of individual monkeys , all off the monkeys and rats . Probing Brain Oxygenation with Near Infrared Spectroscopy (NIRS) — The Role of Carbon Dioxide and Blood Pressure
39
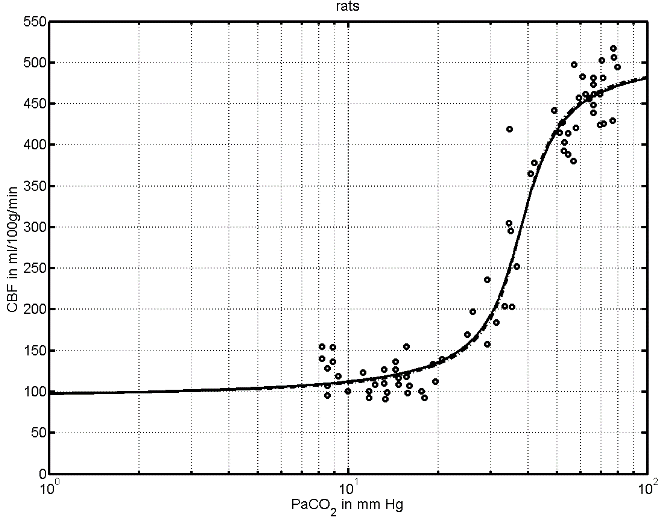
Figure 2. The fits to the experimental data of with parameters given in Table 1. The dotted line is the rescaling of the monkeys best fit according to Eqs. (44) and (45). Figure 3. The dependence of CBF of rats on the partial tension of CO2. The continuous curve is the best fit to Eq. (36) for the data of . The parameters are given in Table 1.
Infrared Spectroscopy - Anharmonicity of Biomolecules, Crosslinking of Biopolymers, Food Quality and Medical
9. Rescaling The Data
In this section, we will transform rat data to serve as monkey data and vice versa. We will utilize Eq. (21), and use the upper index R to denote rats and upper index M to denote monkeys. Let us consider two separate fits (e.g. for all monkeys and for rats):
)
.
(38)
Let us assume the possibility that the curve (37) is converted to curve (38) and vice versa. We will show that it is possible to do this by rescaling the variables p (PaCO2) and B (CBF). Instead of demanding that Eq.(37) be equal to Eq. (38) we will require the equivalent conditions,
)
.
(40)
Equation (39) transforms the p coordinates, and Eq.(40) transforms the B variables. Thus, for example, if we would like to transfer the monkey data to rat data we will rewrite Eq. (40) and
)
.
(42)
Eq. (41) transforms the pM coordinates (using the parameters of Table 1.) into pR coordinates and Eq.(42) transforms the CBF BM data into BR data. The transition of the rat's data to monkey's
Data Is Achieved Via The Equations
Probing Brain Oxygenation with Near Infrared Spectroscopy (NIRS) — The Role of Carbon Dioxide and Blood Pressure
)
.
(44)
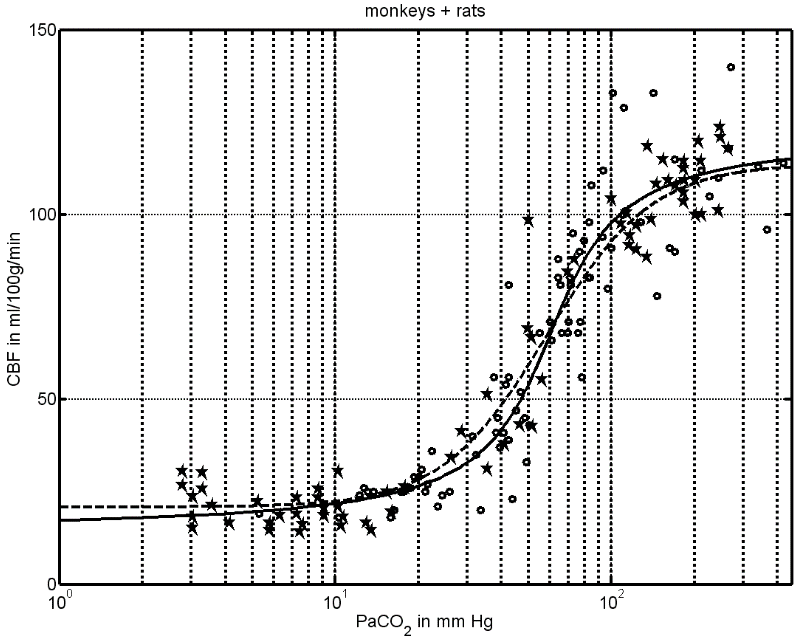
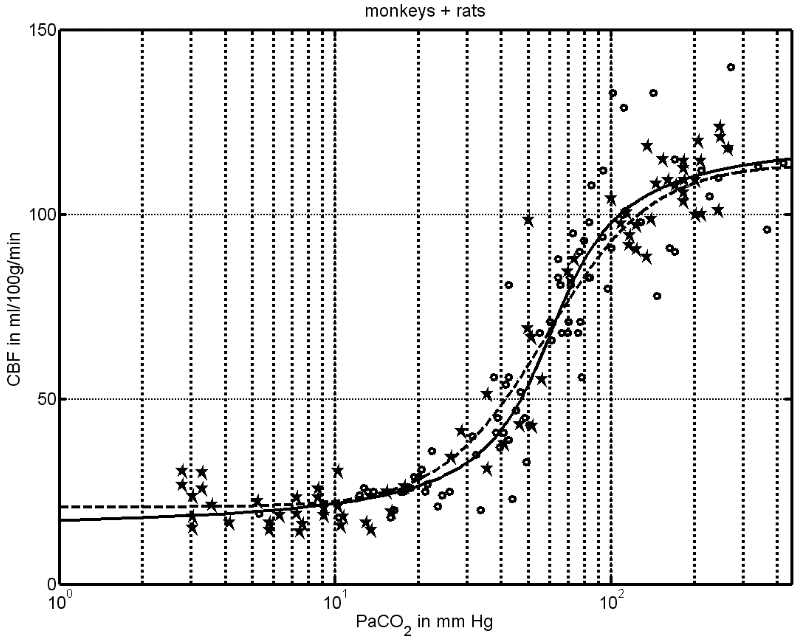
In Fig. 3. The data of the rhesus monkeys (circles) with the fit of all monkeys (the line as in Fig. 1.) are supplemented with the rat data (stars) according to Eqs. (43) and (44). Figure 4. The data of the rhesus monkeys (circles) with the fit of all monkeys Eq.(46) (solid line) and Eq. (19) (dashed line) supplemented with the rat data (stars) according to Eqs. (43) and (44).

10. Human Data
For obvious reasons there are no experimental data on individual humans available in a very wide range of PaCO2. The measurements on animals usually ended with weighing their brains and calibrating the results for 100g of brain tissue. Recently restrictions were imposed on experiments in which animals are killed. In recent years, the emphasis was placed on getting regional CBF (rCBF) measurements rather than global CBF. As a result, the extended animal measurements are rather old.
Infrared Spectroscopy - Anharmonicity of Biomolecules, Crosslinking of Biopolymers, Food Quality and Medical
42
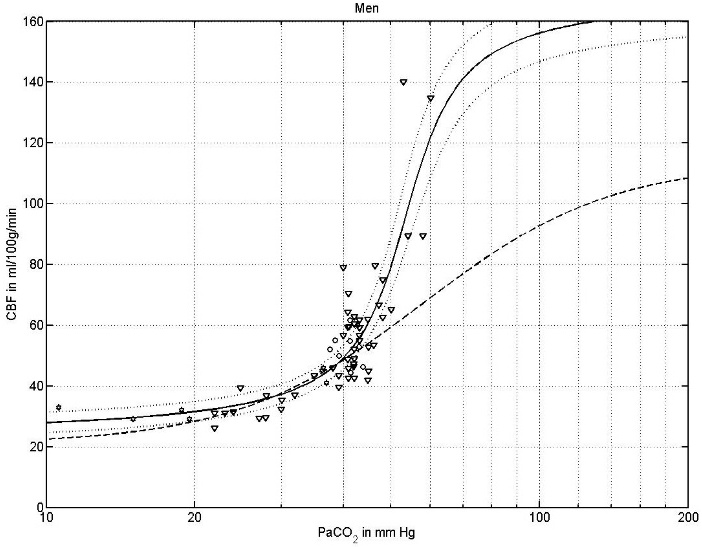
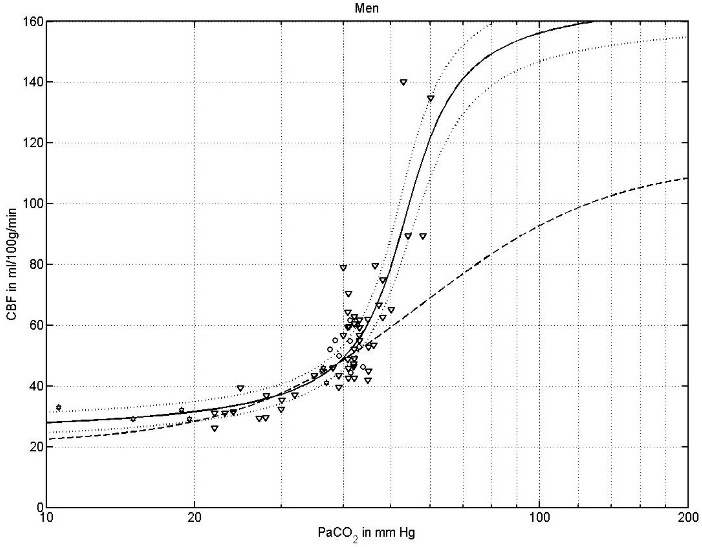
Our fit to human data, based on (Reivich 1964, Ketty and Schmidt 1948 and Raichle et all 1970) is given in Fig. 4, with parameters of Table 1 (all men). In it was observed that the human data (in a narrow interval of PaCO2), which existing in that time, were within the experimental errors very close to the rhesus monkey data. One can see it in Fig. 4 (circles, the data of . Therefore the fit of , Eq. (19) of the rhesus monkey data was and is still being used as the relation between PaCO2 and CBF of humans.
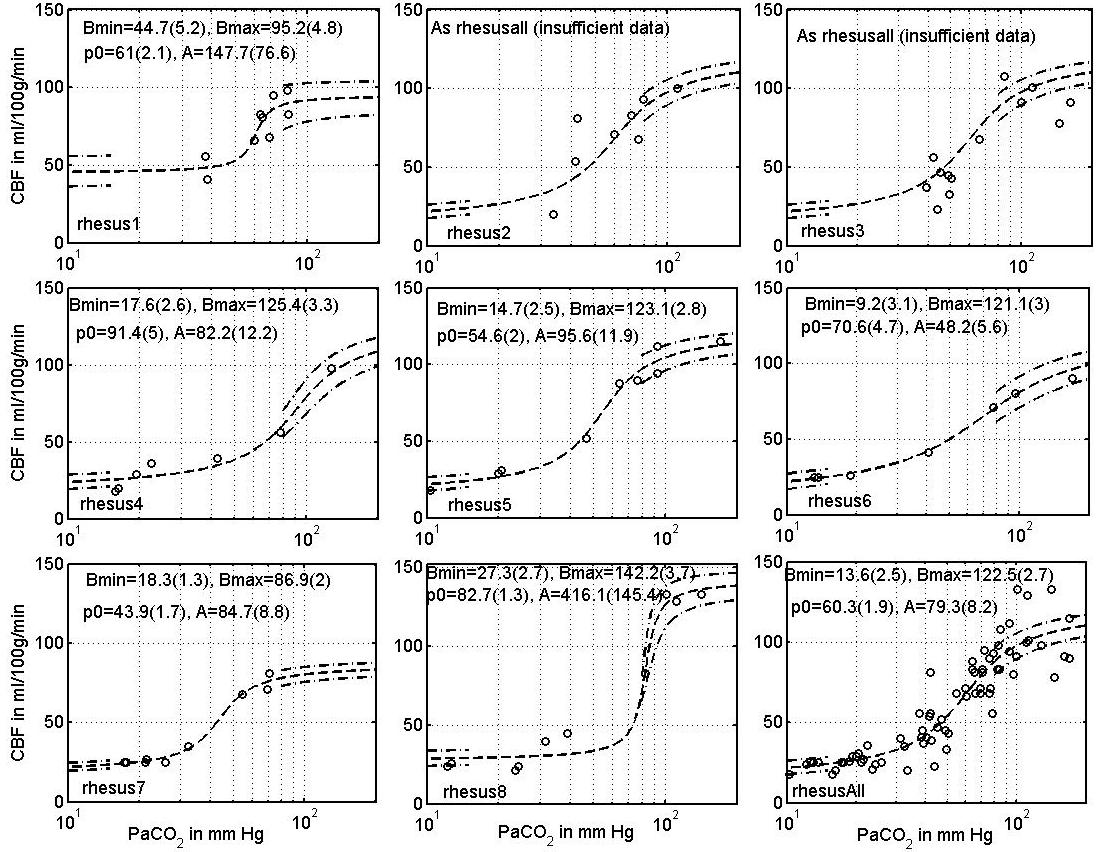
Figure 5. Human CBF data , circles), , triangles) and , hexagons). The dashed line of the fit of Eq. (19) repre‐ sents the rhesus monkey data. The dotted lines deviate from the solid line, given by Eq. (46), by shifting all parameters by two error bars.
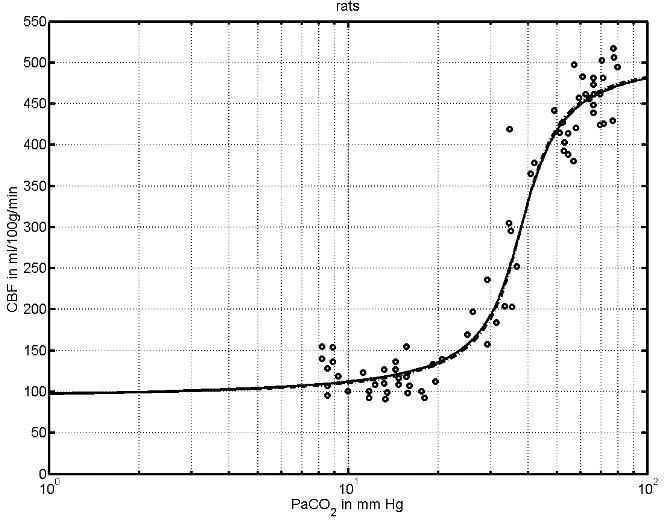
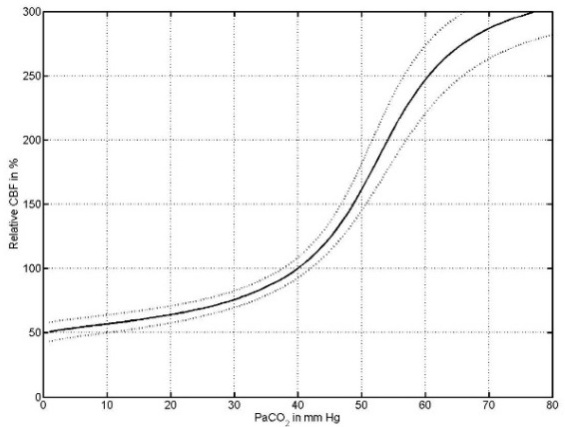
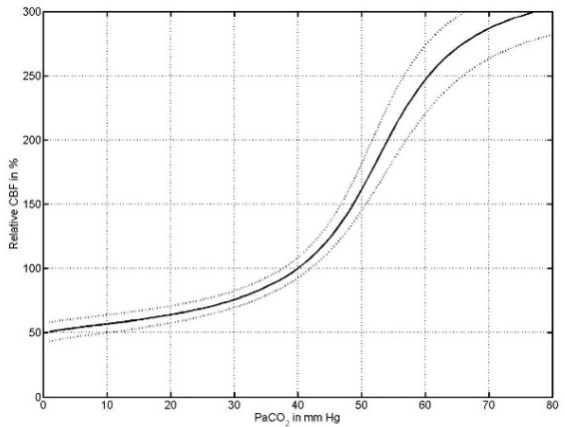
Figure 6. Relative changes of human CBF with respect to its values at PaCO2=40 mm Hg. Probing Brain Oxygenation with Near Infrared Spectroscopy (NIRS) — The Role of Carbon Dioxide and Blood Pressure
43
Our fit to the rhesus monkey data (from Table 1.) is,
(45)
The fits of Eqs. (10.1) and (10.2) are quite similar and are depicted in Fig. 3. They may serve as a first estimate of human CBF below PaCO2=45 mm Hg. Eq. (10.1) represents the human data in some medical textbooks and publications without mentioning that it is a fit of Rhesus
(46)
deviates from that of the Rhesus monkeys in the hypercapnia region (PaCO2 above 45 mm Hg). More accurate human data in this region are needed to confirm our fit. Changes in PaCO2 induce dramatic changes in CBF. This can be seen in Fig. 5, where relative changes of CBF are given. One can see that changing PaCO2 from normal (40 mm Hg) by 10 mm Hg can change CBF by about 25%-55%.
11. Experimental Detection Of Oxygen Waveforms
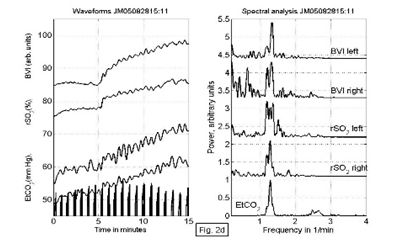
In (Gersten et al., 2009) we have presented simultaneous measurements of EtCO2 (by capn‐ ometer, closely related to PaCO2) and rSO2 (with the INVOS Oximeter of Somanetics model 5100B) during intensive breathing exercises.
The fastest recording rate of the 5100B oximeter was 12. This time is much longer than the average period, of about 4 seconds, of normal respiration. In order to detect oxygenation periodicity we had to study respiration periods of about 36 seconds or larger (i.e. 3 data points or more for each breathing period). This is still a rather small amount of data points per respiration period. We have compensated for this small number by using a cubic spline interpolation of the data points, adding new interpolation points through this method. The cubic spline interpolation is a very effective method of smooth interpolation. We found six people well acquainted with yoga pranayama, who could easily perform breathing exercises with periods around 36 seconds. All of them performed the following routine which lasted for 15 minutes. They were asked to breathe in the following way: to inhale for 4 units of time (UOT), to hold the breath for 16 UOT and to exhale for 8 UOT, this we denote as the 4:16:8 (pranayama) routine. The unit of time (UOT) is about 1 second. The yoga practitioners develop an internal feeling of UOT which they employ in their practices. They learn to feel their pulse or they learn to count in a constant pace. Often they practice with eyes closed. In order not to distract or induce additional stress we preferred not to supply an external uniform UOT. The primary concern for this research was to have a constant periodicity and in this case the Infrared Spectroscopy - Anharmonicity of Biomolecules, Crosslinking of Biopolymers, Food Quality and Medical
44
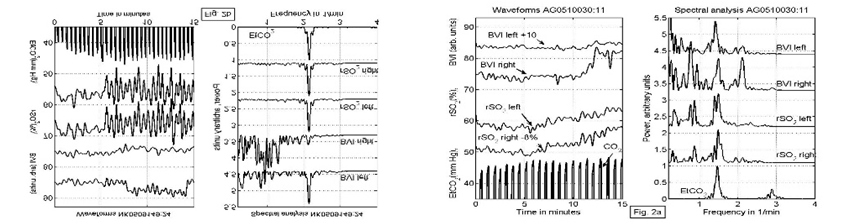
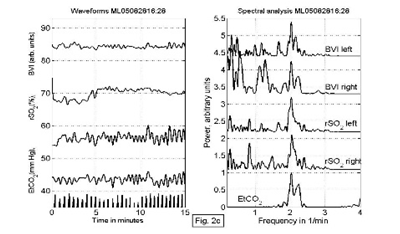
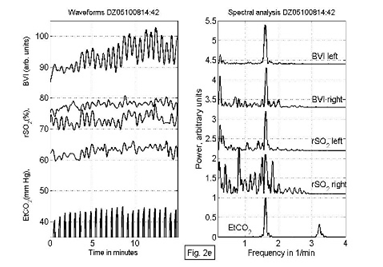
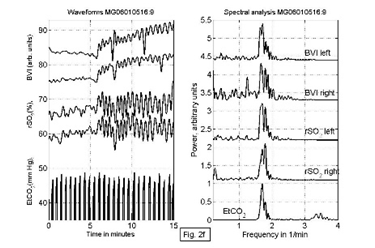
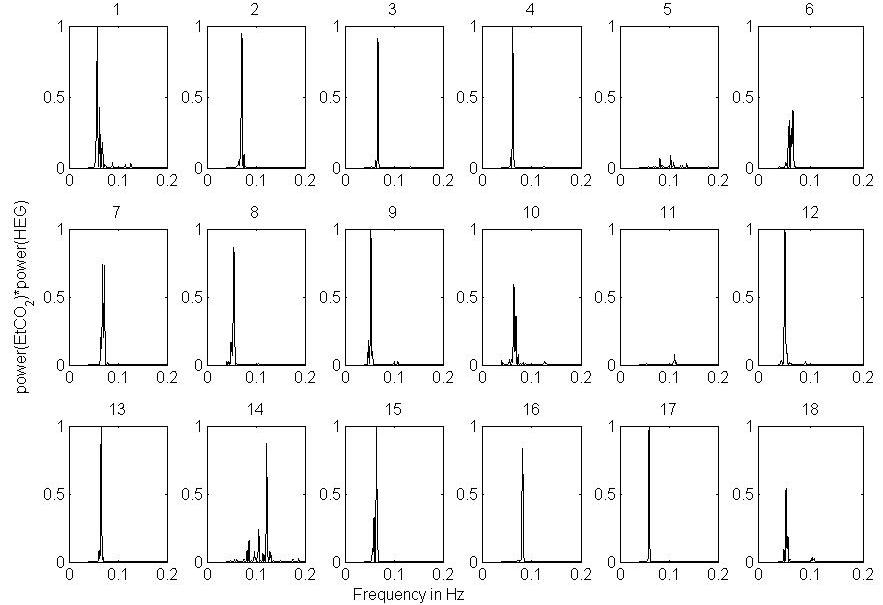
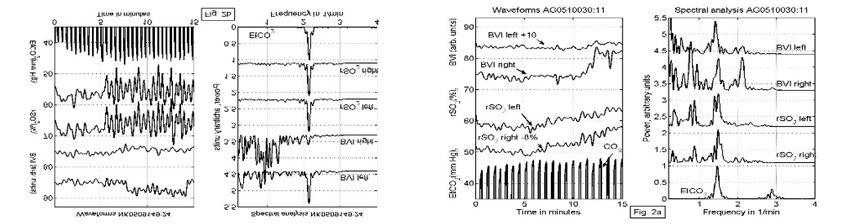
practitioners have succeeded to maintain it. The data were analyzed with spectral analysis which took into account non-stationary developments, which were subtracted from rSO2 and BVI data. Sharp picks corresponding to the breathing periodicity were found in the spectral analysis of EtCO2 (the amount of CO2 during expiration), the overlapping of the periodicities is shown in Fig. 7 (subfigures 2a, 2b, 2c, 2d, 2e, 2f) and Table 2.
(F)
Figure 7. subfigures 2a-2f). On the perpendicular axis are the readings of the capnometer, rSO2 right sensor (subtracted with 8%), rSO2 left sensor, BVI right sensor, BVI left sensor (increased by 10). On the right hand side the corresponding spectral analyses of the waveforms are given, from .
Probing Brain Oxygenation with Near Infrared Spectroscopy (NIRS) — The Role of Carbon Dioxide and Blood Pressure
Related Journal Articles & DOI Links
Selected peer-reviewed publications relevant to 12 Lead ECG Acquisition. Click the DOI to access the full paper (may require institutional access).
-
1. Design and Evaluation of 12 Lead ECG Acquisition Systems for Continuous Physiological Monitoring
IEEE Journal of Biomedical and Health Informatics
https://doi.org/10.1109/JBHI.2020.2981234 -
2. Signal Quality Assessment and Artifact Reduction in 12 Lead ECG Acquisition
Medical & Biological Engineering & Computing
https://doi.org/10.1007/s11517-020-02145-6 -
3. Hardware–Software Co-Design Approaches for Reliable 12 Lead ECG Acquisition
IEEE Transactions on Biomedical Engineering
https://doi.org/10.1109/TBME.2019.2895762 -
4. Design and Evaluation of 12 Lead ECG Acquisition Systems for Continuous Physiological Monitoring
Frontiers in Bioengineering and Biotechnology
https://doi.org/10.3389/fbioe.2020.00123 -
5. Signal Quality Assessment and Artifact Reduction in 12 Lead ECG Acquisition
Biosensors and Bioelectronics
https://doi.org/10.1016/j.bios.2021.112345 -
6. Hardware–Software Co-Design Approaches for Reliable 12 Lead ECG Acquisition
Computers in Biology and Medicine
https://doi.org/10.1016/j.compbiomed.2021.104567 -
7. Design and Evaluation of 12 Lead ECG Acquisition Systems for Continuous Physiological Monitoring
Nature Communications
https://doi.org/10.1038/s41467-020-12345-6
Why Choose Us?
Bangalore guidance for robotics, Spectre and autonomous systems projects.
Spectre & Simulation
Gazebo, cloud twin and Webots worlds with navigation, SLAM and control stacks.
Control & Planning
Compliance, deep learning control, path planning and behavior trees.
Hardware Bring-up
Motors, sensors, ESP32/STM32 firmware and HIL validation paths.
Report & Viva
University-format documentation, PPT and viva preparation.
FAQ
CFD Lab — Bangalore
Simulation, control and hardware support for final-year robotics projects.
Stacks
Worlds
Digital Twin
Control
Robots
Offline
Bring-up