Regular Article
The use of LEDs as a light source for fluorescence pressure
Measurements
Rustem Khasanova, Matthias Elendera, and Stefan Klotzb aLaboratory for Muon Spin Spectroscopy, Paul Scherrer Institute, CH-5232 Villigen PSI,
Switzerland
bSorbonne Universit´e, CNRS UMR 7590, Institut de Min´eralogie, de Physique des Mat´eriaux
Abstract
We discuss the use of commercial high-power light emitting diodes (LEDs) as a light source for fluorescence pressure measurements. A relatively broad light emitting spectra of single color LEDs (in comparison with lasers) do not prevent producing narrow fluorescence lines at least for two widely used pressure indicator materials, namely ruby (Cr3+:Al2O3) and strontium tetraborate (Sm2+:SrB4O7). Strongest responses of both pressure indicators were detected for the green color LEDs with the average wavelength λav ∼530 nm. LEDs might be easily implemented for producing fiber coupled, as well as the parallel light sources. LEDs were found to be efficient to replace laser sources in piston-cylinder cell and diamond anvil cell fluorescence pressure measurement setups.
Keywords
light-emitting diodes; fluorescence; diamond anvil pressure cell; piston-cylinder
1. Introduction
Pressure is a universal tool to tune the electronic structure and, by doing this, to study in a clean and controllable way the coexistence and interplay of different energy scales in a broad variety of materials. In some particular cases, the external pressure may lead to formation of a new, previously unknown, structural phases with unique physical properties which were not detected at ambient pressure conditions. One of the major example is the observation of a nearly room temperature superconductivity in hydrogen rich materials, where the new phases were synthesized inside diamond anvil cells by keeping them at hundreds of gigapascal pressures (see e.g. Refs.
and references therein). One of the drawbacks of pressure experiments is the necessity of using especially dedicated containers (cells), which are suitable for generating high pressures. The key question, in such case, becomes the knowledge of an accurate pressure value (p) arXiv:2305.08243v1 [cond-mat.mtrl-sci] 14 May 2023 inside the cell, which, in most of the cases, differs from the simplified assumption of p = Fap/S (where, Fap and S are the applied force and the area to which this force is being applied, respectively). The most direct way is to look on the response of a so-called pressure indicator, which might be placed inside the cell chamber together with the sample under investigation. Such pressure indicator needs, on the one hand, to be small in order not to occupy much of the cell volume available for the sample and, on the other hand, to be sensitive to the applied pressure.
One of the widely used pressure determination techniques is based on the effect of fluorescence. In such case, the absolute pressure value in the close vicinity of the sample is determined by detecting the pressure induced shift of fluorescence line(s) of the pressure indicator (typically containing Cr3+ or Sm2+ ions). The technique requires the use of an external light source, a special setup allowing to separate optical passes of the direct (excitation) and reflected (fluorecense) lights, and an optical spectrometer.
In current fluorescence systems the excitation source involves, typically, a laser source in the spectral range from the dark blue to the near red. By supplying intensive coherent light, the laser sources allow to measure tiny ruby chips with the dimensions not exceeding 10 −20 µm placed inside the cells.
Note that the use of laser sources should follow strict safety rules, since the laser light exposure can result in damages to the human eye and skin (see e.g. Ref and references therein). Such rules can be easily satisfied at closed laboratories, but it might be difficult to follow them at major user-based facilities among national labs.
However, the coherence property of a laser, which makes it hazardous for the eye even at very low powers, is not a critical condition for fluorescence excitation. The first pressure dependent ruby fluorescent experiments were performed by using angular dispersive light from a mercury lamp source, Ref. . More recently Feng, Ref. , built an optical setup allowing to detect the response of ruby in diamond anvil cell (DAC) by using blue LED with the average wavelength λav ≃430 nm.
In this work we studied the ability of commercial high-power LEDs to be used as a light source for the pressure determination by means of fluorescence. Our tests reveal that a relatively broad light emitting spectra of single color LEDs (compared to monochromatic laser ones) do not prevent formation of narrow fluorescence lines.
The strongest responses for two widely used pressure indicator materials, namely ruby (Cr3+:Al2O3) and strontium tetraborate (Sm2+:SrB4O7), are obtained for green LEDs with λav ∼530 nm. It is demonstrated that LEDs could be easily implemented for producing fiber coupled, as well as parallel collimated light sources. The latter one was found to be efficient to replace laser source in DAC setups and allow to detect a strong fluorescence response from a single (≃15 µm in size) ruby chip.
The paper is organized as follows: Section 2 describes the details of the experi- ment and construction of a ’fiber coupled‘ and ’parallel light‘ LED holder. Section 3.1 presents the measurements of LEDs excitation spectra and the efficiency of fiber cou- pled light sources. The results of fluorescence measurements of ruby (Cr3+:Al2O3) and strontium tetraborate (Sm2+:SrB4O7) pressure indicator materials are summarised in Sec. 3.2. Section 3.3 discusses the possibility of replacing lasers by LED light sources in a piston-cylinder and DAC fluorescence measurement setup. The summary and conclusions follow in Sec. 4.
2. Experimental Details
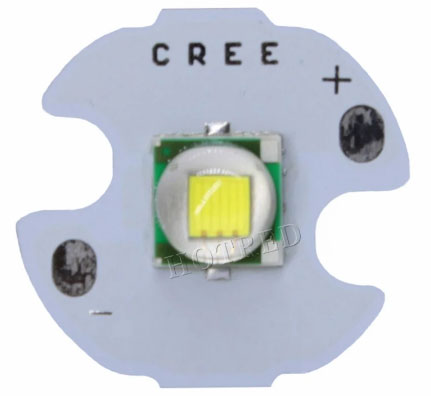
Experiments were performed by using commercial LEDs from CREE. The design with a high-power LED chip mounted on a ø ≃16 mm aluminum PCB (printed circuit board) was selected [Fig. 1 (a)]. LEDs with the maximum electric power (Pel) limited to 3 W were used for studying the efficiency of LED light to excite the fluorescence response of Cr3+:Al2O3 and Sm2+:SrB4O7 and for measurements with the piston- cylinder cell. Both 3 W and 10 W LED versions were used to perform experiments with DAC.
~1.5Mm
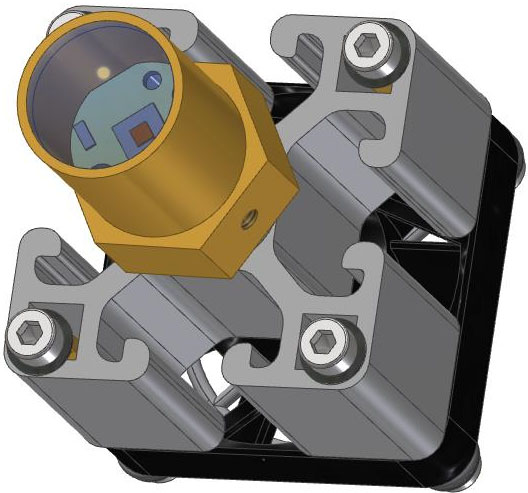
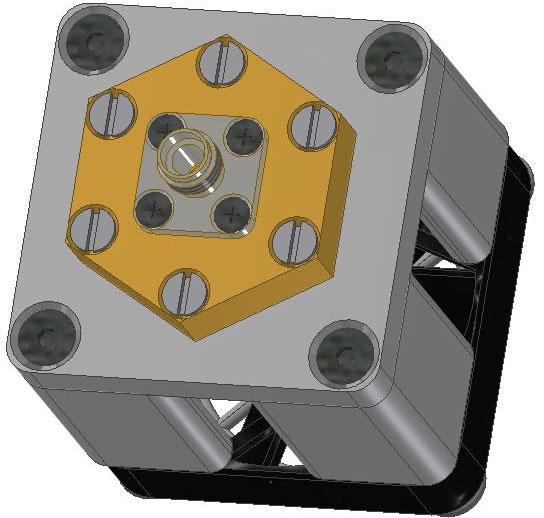
Figure 1. (a) Commercial LED mounted on a ø≃16 mm aluminum PCB (printed circuit board). (b) LED holder with the SMA905 optical fiber output. (c) LED holder with the ’parallel light’ output. The lens focusing distance is ≃18 mm. The distance between the lens and the LED chip (from ≃5 to ≃25 mm) might be changed by replacing the lens holder.
Two type of LED mounts (holders) were constructed [Figs. 1 (b) and (c)]. Both mounts share certain parts [as, e.g., the heat sink (made of 40 × 40 mm2 aluminum profile rail), the cooling fan (40×40×10 mm3, 5 V, 0.05 A), as well as several mounting pieces (screws, washers, spacers, etc.)], but they are different by providing two types of optical outputs. The holder shown in Fig. 1 (b) is equipped with a SMA905 connector and it is used for attaching optical fibers. The holder presented in Fig. 1 (c) allows creating a parallel light output. The light focusing is achieved by changing the distance between the LED and the lens via replacement the lens holder.
The optical measurements were performed by using the broad-band USB4000 (wave- length range: 350 −1000 nm) and the narrow-band HR2000+ (wavelength range: 670 −770 nm) spectrometers from Ocean Optics. The optical fibers with two dif- ferent types of core material (fused silica and PMMA) and various core diameters (from 125 to 1000 µm) were probed. LEDs were powered by using a computer con- trolled DC6006L power supply unit from Fnirsi. Experiments described in Sec. 3.2 were performed by using the RP22 reflection probe from Thorlabs.
3. Results And Discussions
3.1. LED excitation spectra and efficiency of fiber coupled sources Figure 2 shows the emission spectra of seven LED types with different wavelengths [experiments were performed by using fiber coupled LED holders, Fig. 1 (b)]. The characteristics of the studied LEDs are summarized in Table 1. Nearly all LEDs (except
3
the 600 nm one) have relatively narrow line width. The FWHM ranges from ≃12 nm (for 430 nm LED) to ≃34 nm (for 530 nm one). The exception is only the 600 nm LED with FWHM reaching ≃95 nm.
7 3 0 N M
Figure 2. Excitation spectra of seven LED types used in the present study. Figure 3 shows the dependence of the output optical power (Popt) on the applied electric power (Pel) for different LED types. Measurements were performed by using ø = 200 µm optical fiber (the numerical aperture NA=0.29, Ref. ) attached to the end of the SMA905 plug [see Fig. 1 (b)]. The values of the optical power at applied current J = 0.7 A (which corresponds to approximately ∼75% of the maximum electric power of 3 W LED) and the efficiency of fiber coupled LEDs [i.e. the ratio Popt(0.7 A)/Pel(0.7 A)] are summarised in Table 1.
6 0 0 N M
Figure 3. Dependence of the output optical power (Popt) on the applied electric power (Pel) for different LED types. Measurements were performed by using ø = 200 µm optical fiber (the numerical aperture NA=0.29, Ref. ) attached to the end of the SMA905 plug [see Fig. 1 (b)].
4
From the above presented LED test results the following three important points emerge. (i) The full width at half maximum of studied LEDs varies between 12 and 95 nanometers (see Figure 2 and Table 1). These values are similar (or even slightly smaller) in size to the excitation bandwidths of ruby and strontium tetraborate. This allows to select an individual diode light source to supply the optimum excitation wavelength band for different types of pressure gauges.
(ii) LEDs with the wavelengths 395, 430, and 600 nm exhibit optical power output nearly twice as high compared to LEDs ranging from 470 to 530 nm (see Fig. 3). This is the manifestation of the so-called ”green gap“ problem, i.e. the efficiency reduction of green LEDs compared with ultraviolet to blue and orange to infrared ones.
(iii) The area of the 3 W LED lightening chip [≃1.5 × 1.5 mm2, Fig. 1 (a)] is far bigger compared to the cross sectional area of 200 µm optical fiber. This explains ∼0.1−0.2% efficiency of the optical output. Note that the use of 1 mm diameter optical fiber results in more than 20 times higher optical power.
Table 1. Characteristics of studied LEDs. The meaning of the parameters are: λsp is the wavelength as announced in LEDs specification sheet, λav is the average wavelength detected in experiments, FWHM is the full width at the half maximum, Popt(0.7 A) is the output optical power at the end of ø = 200 µm optical fiber (NA=0.29) at applied current J = 0.7 A, and Popt(0.7 A)/Pel(0.7 A) is the optical efficiency.
–
–
3.2. The fluorescence response of ruby and strontium tetraboite Figures 4 and 5 represent the results of fluorescence measurements of ruby (Cr3+:Al2O3) and strontium tetraborate (Sm2+:SrB4O7), respectively. Experiments were performed at ambient pressure by using fiber-coupled LED sources and an opti- cal reflection probe. The pressure indicators were mounted inside especially designed holders allowing easy attachment to SMA905 optical connector.
The fluorescence spectra of ruby [Fig. 4 (a)] is confined in the region of 690−698 nm and it consists of two lines (R1 and R2) which correspond to the transition of chromium from the excited metastable level E2 to the ground state E1. The red emission spectra of Sm2+ in SrB4O7 is located in the range of 680 −740 nm [Fig. 5 (a)]. Eight lines correspond to: 5D0 →7F 0 (685.4 nm), 5D0 →7F 1 (695.4, 698.6, and 704.6 nm), and 5D0 →7F 2 (722.1, 724.2, 727.0 and 733.5 nm) and they are associated with the so-called 4f6 −4f6 intra-configurational transitions of Sm2+ ions.
The data presented in Figs. 4 (a) and 5 (a) imply that LEDs with the wavelengths
2 L I N E
Figure 4. (a) The fluorescence spectra of ruby (Cr3+:Al2O3) at ambient pressure measured by using LEDs with the average wavelength ranging from 395 nm to 600 nm. R1 and R2 denote the corresponding fluorescence lines. (b) Dependence of the normalised intensity of R1 and R2 ruby lines on the LEDs wavelengths. The lines are guides for the eye.
ranging from 395 to 600 nm are suitable for observing the fluorescence response of both, the ruby and the strontium tetraborate, probes. There was no fluorescence sig- nal detected for the 730 nm LED. In this case only the broad intensity distribution corresponding to the excitation spectra of the LED itself (similar to the one presented in Fig. 2) was recorded.
The selection of the most efficient LED type could be made by comparing the dependence of the normalized intensity of fluorescence line(s) as a function of LED’s average wavelengths. The corresponding dependencies for R1 and R2 lines of ruby, as well as for 5D0 →7F 0 and the first 5D0 →7F 1 lines of strontium tetraborate are presented in Figs. 4 (b) and 5 (b), respectively. The best result is obtained for the green light LEDs with the average wavelengths ∼530 nm.
3.3. LED instead of laser light sources for pressure measurements This section discusses the use of LEDs as light sources for pressure determination by means of fluorescence. Two types of pressure cells were tested, i.e. piston-cylinder and the diamond anvil cell (DAC).
3.3.1. Piston-Cylinder Pressure Cell
Experiments were performed using the double-wall type piston-cylinder cell described in Refs. . The optical pressure read was accessed via the ’double-volume‘ setup, where the space inside the cell is split between the ’sample‘ (≃0.3 cm3) and the ’op- tical‘ (≃1 mm3) volumes, respectively. Strontium tetraborate (Sm2+:SrB4O7) was filled inside the ’optical‘ volume and played a role of a pressure indicator. The insertion of the excitation radiation and the read of the fluorescence responce were performed in way described in Fig. 1 of Ref. .
The results obtained using different fiber coupled LEDs were similar to that reported in Fig. 5. Due to the relatively large amount of pressure gauge material possible in such a double-volume setup (∼0.5 −1.0 mm3, Ref. ), the intensive fluorescence
Related Journal Articles & DOI Links
Selected peer-reviewed publications relevant to 12 Lead ECG Acquisition. Click the DOI to access the full paper (may require institutional access).
-
1. Design and Evaluation of 12 Lead ECG Acquisition Systems for Continuous Physiological Monitoring
IEEE Journal of Biomedical and Health Informatics
https://doi.org/10.1109/JBHI.2020.2981234 -
2. Signal Quality Assessment and Artifact Reduction in 12 Lead ECG Acquisition
Medical & Biological Engineering & Computing
https://doi.org/10.1007/s11517-020-02145-6 -
3. Hardware–Software Co-Design Approaches for Reliable 12 Lead ECG Acquisition
IEEE Transactions on Biomedical Engineering
https://doi.org/10.1109/TBME.2019.2895762 -
4. Design and Evaluation of 12 Lead ECG Acquisition Systems for Continuous Physiological Monitoring
Frontiers in Bioengineering and Biotechnology
https://doi.org/10.3389/fbioe.2020.00123 -
5. Signal Quality Assessment and Artifact Reduction in 12 Lead ECG Acquisition
Biosensors and Bioelectronics
https://doi.org/10.1016/j.bios.2021.112345 -
6. Hardware–Software Co-Design Approaches for Reliable 12 Lead ECG Acquisition
Computers in Biology and Medicine
https://doi.org/10.1016/j.compbiomed.2021.104567 -
7. Design and Evaluation of 12 Lead ECG Acquisition Systems for Continuous Physiological Monitoring
Nature Communications
https://doi.org/10.1038/s41467-020-12345-6
Why Choose Us?
Bangalore guidance for robotics, Spectre and autonomous systems projects.
Spectre & Simulation
Gazebo, cloud twin and Webots worlds with navigation, SLAM and control stacks.
Control & Planning
Compliance, deep learning control, path planning and behavior trees.
Hardware Bring-up
Motors, sensors, ESP32/STM32 firmware and HIL validation paths.
Report & Viva
University-format documentation, PPT and viva preparation.
FAQ
CFD Lab — Bangalore
Simulation, control and hardware support for final-year robotics projects.
Stacks
Worlds
Digital Twin
Control
Robots
Offline
Bring-up