Neonatal Pain Detection From Facial Videos
Ashutosh Dhamaniya1†, Anup Kumar Gupta1*†, Trishna Saikia1,
Puneet Gupta1
Technology Indore, 452020, India. †These authors contributed equally to this work.
Abstract
Unaddressed pain in neonates can lead to adverse effects, including delayed devel- opment and slower weight gain, emphasising the need for more objective and reliable pain assessment methods. Hence, automated methods using behavioural and physiological pain indicators have been developed to aid healthcare profes- sionals in the Neonatal ICU. Traditional contact-based methods for physiological parameter estimation are unsuitable for long-term monitoring and increase the risk of spreading diseases like COVID-19. We introduce a novel approach using remote photoplethysmography (rPPG) to estimate pulse signals in a non-contact manner and employ them for neonatal pain detection. The temporal signals acquired from regions-of-interest (ROIs) affected by skin deformations may exhibit lower quality and provide erroneous rPPG signals. Therefore, we incor- porated a quality parameter to select the temporal signals obtained from ROIs that are least affected by skin deformations. Further, we employed signal-to-noise ratio as a fitness parameter to extract the rPPG signal corresponding to the clip that is least affected by noise. Experimental findings demonstrate that the rPPG signals provide useful information for neonatal pain detection, and signals extracted from the blue colour channel outperform those extracted from other colour channels. We also show that combining rPPG and audio features provides better results than individual modalities.
Keywords: Neonatal pain detection, Remote Photoplethysmography (rPPG),
1 Introduction
Pain detection in neonates is a critical aspect of paediatric healthcare. Neonates, espe- cially those in intensive care units, are often subject to procedures that can cause pain . However, their inability to communicate verbally makes pain assessment challenging [1, 4]. Unfortunately, unaddressed pain in neonates can lead to various short-term and long-term complications, including altered pain sensitivity, develop- mental delays, changes in the gray and white matter of the brain, as well as emotional and psychological issues later in life [1, 5, 6]. The current approach to pain assessment relies on the observation of caregivers for specific physiological and behavioural pain indicators . The pain assessment by caregivers is significantly influenced by various factors such as the cognitive bias of the observer, background, gender, identity, and culture [1, 2]. These factors may result in inconsistent pain assessment and treatment.
Hence, an accurate and timely detection of pain is crucial for pain management, as well as the overall well-being of the neonate. However, considering the current constraints in healthcare staffing, evidenced by a substantial shortage of medical personnel glob- ally [2, 7], coupled with the overwhelming workload on existing staff, the development of automated pain detection systems has become imperative.
Existing automated pain assessment methods in neonates primarily rely on behavioural indicators, such as facial expressions, crying, and body movements [1, 8– 11]. A few recent studies have included physiological indicators like heart rate (HR), heart rate variability (HRV), and breathing rate for pain assessment [4, 12, 13].
These physiological measures offer several advantages over behavioural indicators. While behavioural measures are reported to be powerful indicators of pain, they have limitations, especially in infants who may have a reduced ability to express pain behaviourally due to certain disorders or physical conditions, like post-surgery exhaus- tion . This underlines the necessity of incorporating physiological measures for a more comprehensive assessment of neonatal pain. Traditionally, monitoring of vital signs in the Neonatal Intensive Care Unit (NICU) has relied on adhesive electrodes and sensors attached to the skin of the neonate . These sensors record vital signals, which are then converted to a format suitable for display and monitoring. However, this contact-based method can be intrusive and uncomfortable for neonates, potentially interfering with their natural state and responses .
In contrast to contact-based methods, remote photoplethysmography (rPPG) presents a non-contact alternative for capturing physiological data such as HR [16, 17], HRV , respiratory rate (RR) , and blood oxygen saturation (SpO2) . It works on the principle that there is a subtle change in the skin colour of the neonates as blood pumps through it. Digital cameras can capture these subtle variations in light reflected by the skin, enabling HR monitoring without direct physical contact with the neonate . This way, rPPG alleviates the physical discomfort associated with adhesive sensors and minimises the risk of infection, a crucial consideration in the delicate environment of the NICU . However, the performance of the rPPG sig- nal heavily relies on the colour channel, which is used as temporal signal to estimate the rPPG signal. Moreover, it is susceptible to various inevitable noises, such as eye blinking, frequent movements of the face and body, illumination variations, and skin
2
deformations. These factors introduce significant skin colour fluctuations, resulting in erroneous HR estimation. To the best of our knowledge, the applicability of rPPG in neonatal pain detec- tion has not been studied. Also, we believe that despite several challenges in rPPG estimation, it is worth exploring rPPG to detect pain in neonates who cannot commu- nicate their pain verbally due to its non-invasiveness and ability to provide continuous monitoring. Our contributions can be summed up as follows: (1) To the best of our knowledge, we are the first to explore the rPPG signal extracted from facial videos for neonatal pain classification. (2) In the literature, the green colour channel has been considered to contain the strongest photoplethysmographic information. However, our experimental findings indicate that the blue colour channel surpasses the performance of other colour channels for neonate pain detection. (3) We divided the input video into multiple clips to avoid the inevitable noises available in long-duration videos. In these clips, the temporal signals obtained from the region of interest (ROIs) affected by skin deformations may show lower quality due to significant colour variations in the skin. Therefore, we employed a quality parameter to select temporal signals least impacted by skin deformations. Moreover, we have utilised the signal-to-noise (SNR) ratio as a fitness parameter to evaluate the quality of the rPPG signal obtained from each clip. Among all the obtained rPPG signals, we selected the one least affected by the unavoidable noises. (4) Our experimental results demonstrate that rPPG provides useful information for neonatal pain detection. Moreover, we also show that the fusion of the rPPG signal with audio features performs better than the individual modalities.
2 Related Work
In recent years, advancements have been made in automating neonatal pain assess- ment, addressing the shortcomings of traditional methods. The automated methods rely either on behavioural, physiological, or multimodal features for pain detection.
The methods based on behavioural features rely on pain indicators such as facial expression, facial action units, body movement, and crying sounds. The methods based on physiological features rely on vital signs such as HR, HRV, respiratory rate (RR), and oxygen saturation (SpO2) for pain detection. Meanwhile, the multimodal approaches combine two or more behavioural or physiological features for neonatal pain detection.
Initial studies focused on preprocessing face images through cropping, grayscale conversion, and converting them to 1D vectors. Techniques like Linear Discriminant Analysis (LDA) and Principal Component Analysis (PCA) were employed to reduce the dimensionality of these vectors, with the condensed features then classified using Support Vector Machines (SVM) [23, 24]. The study proposed in manually identi- fied facial points based on the Neonatal Facial Coding System ; using the distances between these points for pain prediction. Recent works have employed Gaussian of Local Descriptors (GOLD) and Bag-of-Features (BoF) for handcrafted feature extrac- tion, utilising SVM classifiers for pain detection . Similarly, in , handcrafted features, such as facial geometric features and Local Binary Patterns (LBP), are fed to an SVM for pain detection. Moreover, combining deep features from Convolutional
3
Neural Networks (CNN) with traditional handcrafted features like LBP and Histogram of Oriented Gradients (HOG) has shown significant improvements in pain classification . Comparative studies have also demonstrated that deep learning (DL) architec- tures, particularly CNN variants, surpass traditional features such as LBP, HOG, and Gabor when applied to SVM . Further, pre-trained ResNets and two-stream architectures incorporating spatial and temporal information through cross-stream attention mechanisms have been explored for pain classification [9, 10, 29]. Transfer learning from pre-trained CNNs has also been investigated for feature extraction in pain detection [30, 31].
Apart from facial features, body movement, and crying audio sounds have been identified as strong indicators of pain detection in neonates. Frameworks combining body movement and facial expressions using SVM, CNN, and Long Short-Term Mem- ory (LSTM) networks have been proposed, as well as unsupervised fusion of facial and body skeleton sequences for pain intensity prediction . Audio features such as spectrogram from crying sounds have been analysed using CNNs and SVMs for neona- tal pain assessment [11, 35]. Recent works integrate audio-visual features for a more comprehensive pain assessment .
In several studies, researchers have explored how physiological parameters are cor- related to pain stimuli, and the findings indicate a strong association between pain and physiological parameters such as HR, HRV, and others . Consequently, physi- ological pain indicators are used in conjunction with behavioural indicators like facial expressions and body movement to assess neonatal pain. For instance, in the study , strain-based features from facial expressions and motion features are employed to obtain pain scores. On the other hand, statistical features from physiological param- eters are fed to a Random Forest classifier for pain scores. Finally, majority voting is applied to scores based on behavioural and physiological pain indicators to assess the pain. This study was extended to include audio modality, utilising features like Lin- ear Prediction Cepstral Coefficients and Mel-frequency Cepstral Coefficients (MFCC), enhancing the multidimensional assessment of neonatal pain . Similarly, several studies have been conducted to detect pain in adults . However, to the best of our knowledge, very few works have explored the rPPG technique for detecting pain in adults , and that too has not been applied to neonates either.
Unfortunately, these physiological parameters are traditionally measured using contact-based sensors such as photoplethysmography (PPG), ballistocardiogram (BCG), and electrocardiogram (ECG), which may not be suitable for all scenarios.
For instance, these contact-based techniques are unsuitable in scenarios such as mon- itoring neonates with skin damage and infections or while the neonate is sleeping [16, 46, 47]. Furthermore, the risk of spreading ailments like COVID-19 through sen- sor contact highlights the need for non-contact alternatives in pandemic conditions [14, 17]. To this end, rPPG emerges as a non-contact alternative, leveraging video analysis for physiological parameter estimation without direct skin contact.
3 Proposed Method
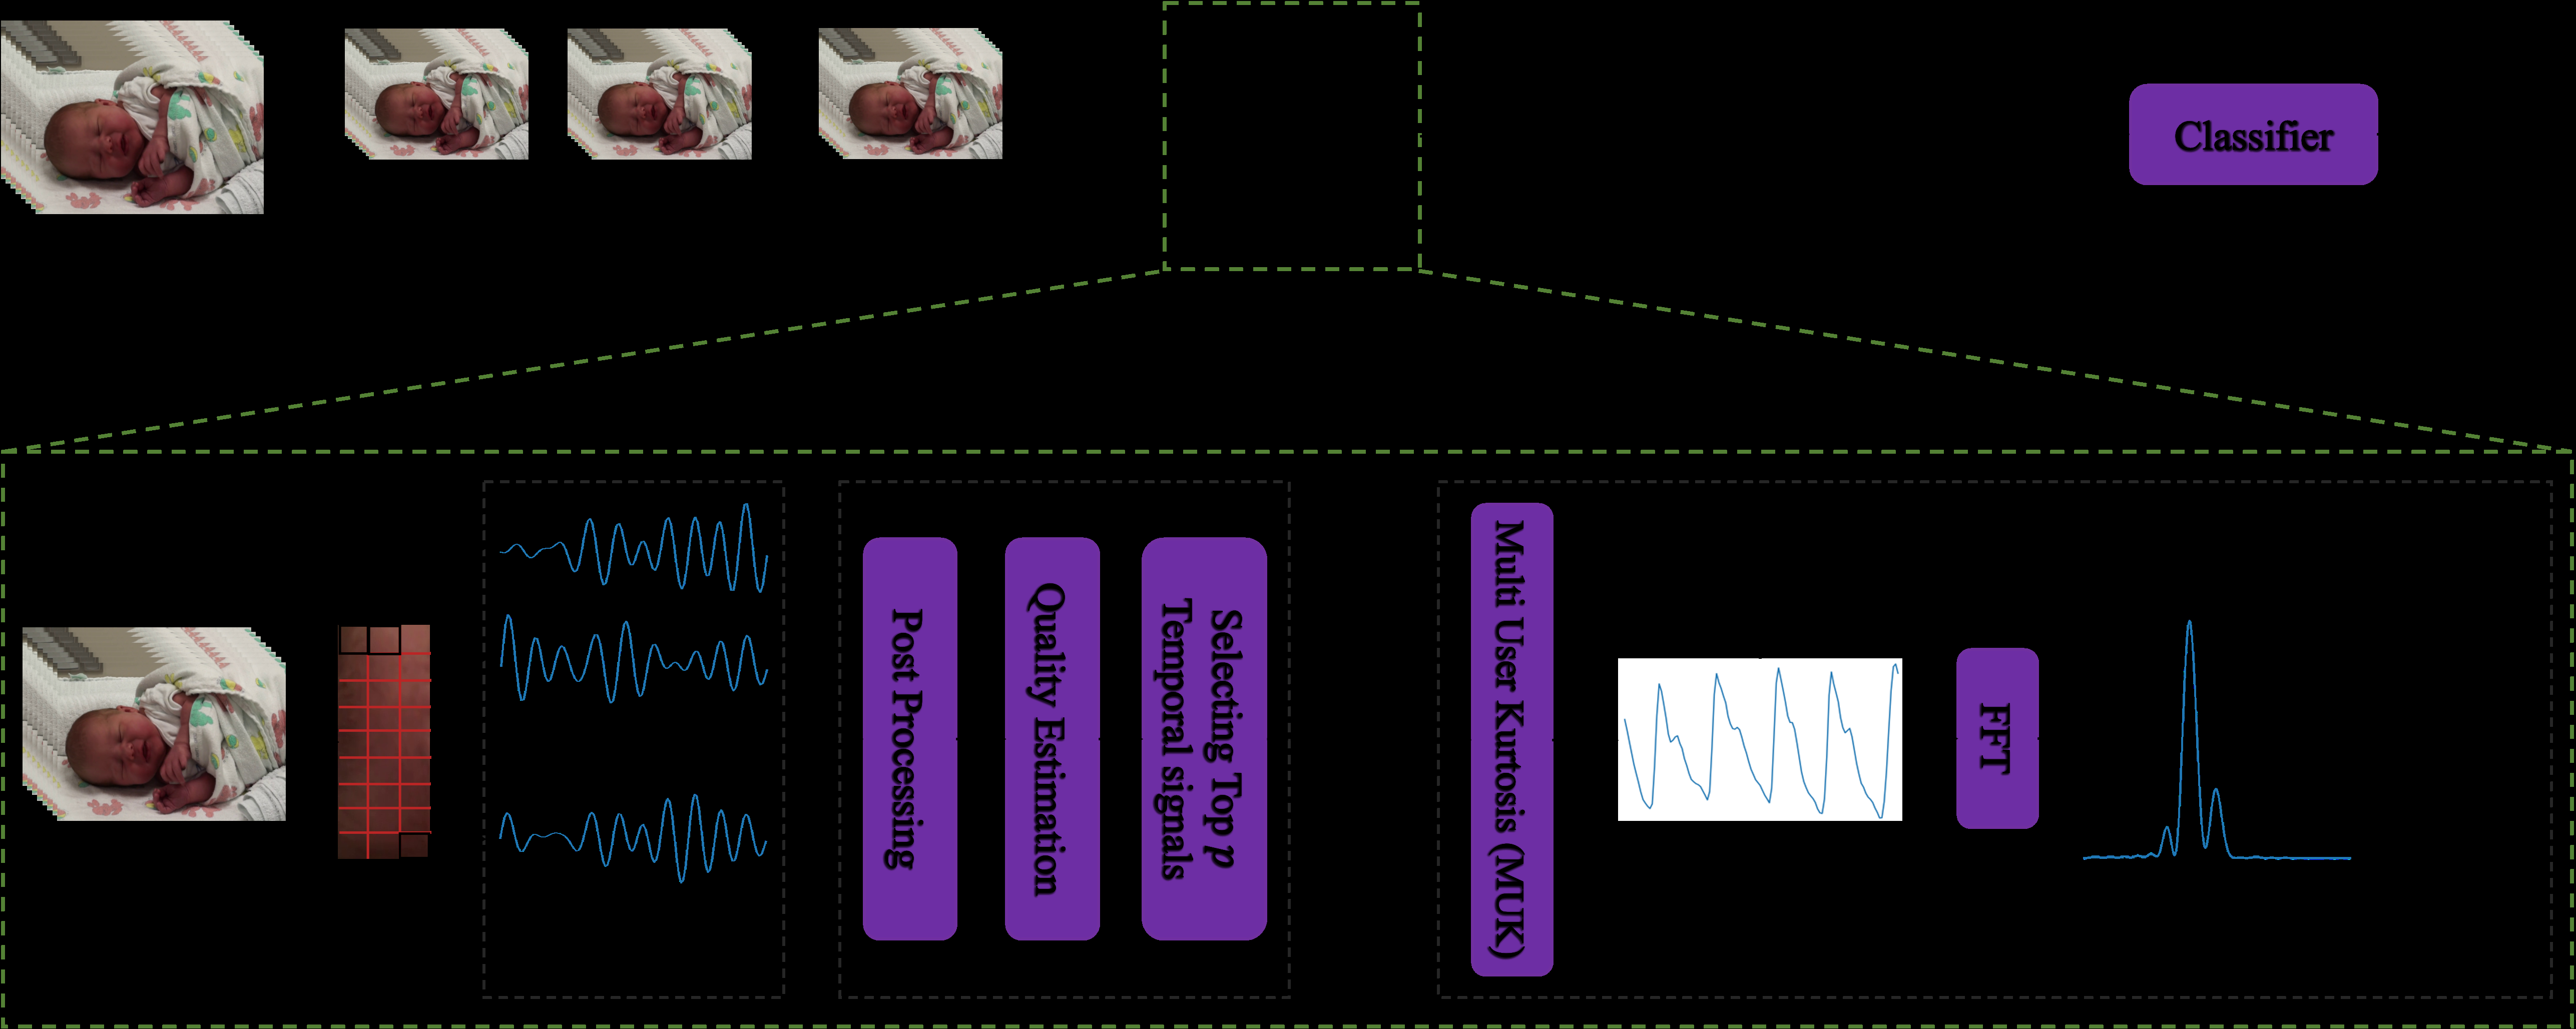
Our proposed method aims to detect neonatal pain utilising rPPG signal extracted from face videos. A flow diagram of the proposed method is shown in Fig 1. Initially, the input video is divided into multiple non-overlapping clips. Subsequently, the rPPG signal is extracted from each clip. To this end, the face region is detected, cropped, and divided into multiple ROIs. Temporal signal corresponding to each ROI is then extracted, along with its quality. The quality is defined such that the temporal sig- nals extracted from the ROIs impacted by skin deformations exhibit lower quality due to significant colour variations. Subsequently, the top p signals are selected based on the quality of the temporal signal. The selected temporal signals are then used to extract the rPPG signal along with the fitness parameter. The fitness parameter pro- vides a low value if the clip contains facial deformations. Eventually, several rPPG signals are extracted so that each rPPG signal corresponds to a clip. Some of these sig- nals are obtained from the clips containing noise, exhibiting low values for the fitness parameter. Also, the rPPG signal exhibiting the lowest deformation can provide the most useful information. Therefore, the rPPG signal with the highest fitness param- eter is selected and fed to the machine learning (ML) classifier for pain and no pain classification.
Fig. 1 The flow diagram of our proposed method. The input video is divided into multiple clips, the face region is detected and divided into ROIs, and temporal signals with higher quality are selected. The selected signals are used to extract the rPPG signal along with the fitness parameter. Finally, the rPPG signal with the highest fitness parameter is fed to the machine learning classifier for pain and no pain classification.
3.1 Clip Extraction
Few frames in long-duration videos are usually impacted by inevitable noises, motion artefacts, and facial expressions, which can corrupt the rPPG signal . To address this issue, has divided the input video into multiple clips and chose the clip that is least affected by noise. This way, noisy frames in some clips do not compromise the quality of the rPPG signal extracted from stable clips. Following this, we divided the input video into multiple clips for neonatal pain detection from face videos. In this
5
direction, a non-overlapping window is applied to the video, dividing it into k clips, each consisting of f frames.
3.2.1 Roi Extraction
After dividing the input video into multiple clips, our method estimates the rPPG sig- nal corresponding to each clip. In this direction, our method initially performs neonatal face detection by employing the YOLOv7Face detection model, which is an extension of the YOLOv7 architecture. It is used for detecting the face and facial landmark points. While the entire facial region of the neonates can be used for temporal signal extraction, noises induced due to eye blinking, lip quivering, and facial expression can impact the quality of the extracted temporal signal [16, 50]. Hence, we select only the forehead region to obtain the rPPG information. Further, the entire forehead region can be considered as a single ROI for the extraction of temporal signals, but different forehead regions exhibit varying degrees of colour variation that can cause signifi- cant performance degradation [16, 46]. Hence, it is recommended in previous studies [16, 46], to use multiple smaller ROIs, extract the temporal signals from these smaller ROIs, and finally employ the obtained temporal signals for estimating the pulse signal.
Going along the same line, we divide the forehead region into multiple non-overlapping square regions to extract the temporal signals. A square region can be considered as an ROI if all its pixels correspond to the skin, similar to the study . Thus, we get sev- eral ROIs in the clip. Also, the previous works have employed a fixed ROI size [16, 17].
However, to cater to the difference in forehead size of each neonate, we employ a dynamic ROI size, which is m times the maximum height and width of the forehead of the neonate. The details of selecting the value of m are provided in section 4.3. Math- ematically, the ROI size, rs is given by, rs = m × max(heightforehead, widthforehead), where max is the maximum operation while heightforehead and widthforehead denote the height and width of the forehead, respectively.
3.2.2 Temporal Signal Extraction
The temporal signals are extracted from each ROI in two stages: first, the RGB signals are obtained, followed by the extraction of temporal signals from these obtained RGB signals. The RGB signals for each ROI are obtained by averaging the pixel values of the blue, green, and red colour channels. Mathematically, the signal bj, denotes the blue colour channel signal for the jth ROI is defined as follows:
Where Bp
j,i denotes the pth pixel blue channel intensity for the jth ROI within the ith frame. Here, nj,i indicates the number of pixels in the jth ROI of the ith frame, and f denotes the total number of frames in a video clip. Similarly, the green gj and red channel rj are computed. Also, the RGB signal for the jth ROI is given by (rj, gj, bj). The temporal signals can be extracted from these RGB signals using either
6
individual colour channel signals from the RGB signals or a weighted combination of two or more colour channels. In our study, we explored individual colour channels and a weighted combination of two or more colour channels as temporal signals in ection 5 and observed that the performance of the blue colour channel temporal signals outperformed others.
3.2.3 Temporal Signal Selection
The obtained temporal signals (tj) can contain noise due to improper illumination, motion artefacts and facial deformation [14, 16, 17]. To alleviate the noise, we employ bandpass filtering on the temporal signals with frequencies ranging from 1.67 Hz to 2.91 Hz because neonates’ specified HR frequency range corresponds from 100 to 175 beats per minute (BPM). Kindly note that the typical HR range of healthy neonates is highly debated . Hence, we take a broad range of the HR frequencies based on multiple studies [40, 51–53]. Mathematically, ˜tj = ψbp (tj), where ψbp denotes the Butterworth bandpass filter, which suppresses the frequencies outside the given frequency range from the signals.
Subsequently, we select some rPPG signal from the entire set (˜t1, ˜t2, . . . , ˜tJ), that are least affected by noise. Our selection process accounts for the susceptibility of temporal signals to noise, especially those influenced by neonatal facial expressions. To this end, we define the quality of each temporal signal such that the temporal signals obtained from ROIs impacted by skin deformation, such as forehead creases, exhibit lower quality. Subsequently, we select those p temporal signals that are least affected by skin deformations, that is, the temporal signals containing higher quality. Hence, we define the quality by leveraging the intuition that the regions with skin deformation will exhibit significant skin colour variations, causing a considerable standard deviation in the amplitude of extracted temporal signals. That is, a temporal signal with a lower standard deviation will provide better rPPG information. Mathematically, Qj denoting the quality of the jth temporal signal, ˜tj is calculated by Qj =
Σ(˜Tj), Where
σ denotes the standard deviation operator. 3.2.4 Pulse Signal and Fitness Parameter Estimation The selected top p temporal signals are processed through the Multiuser Kurtosis algorithm , which performs blind source separation on the signals to separate the pulse component and noise. Further, it identifies and extracts the most periodic component, representing the rPPG signal denoted as Sx
Rp P G, Where X Denotes The Xth
clip of the video. Moreover, we compute the fitness parameter γx corresponding to
S X
rP P G. A high fitness value signifies that the corresponding rPPG signal contains low noise and vice versa . Thus, we define the fitness value by leveraging the intuition that ideally, the amplitude for frequencies other than the HR frequency should be zero, with the highest amplitude value at the HR frequency. However, achieving this ideal scenario is not feasible due to inevitable noise, leading to nonzero amplitude values for frequencies other than HR . Hence, we first compute the pulse spectrum, Px
Rp P G
of rPPG signal by applying Fast Fourier Transform (FFT) on S x
7
the fitness parameter, γx is computed as the SNR ratio of the pulse spectrum, Px rP P G.
(2)
where m denotes the frequency with the highest amplitude in Px
Rp P G, While Α Denotes
the size of the adjacent frequency window. We have selected the frequency range from 1.67 Hz to 2.91 Hz, as discussed above in section 3.2.3.
3.3 Pain Classification
Kindly recall that we have divided the input video into k clips. The rPPG signal is extracted, and its fitness parameter is computed for each of the k clips of the video. Among these clips, some clips contain frames affected by unavoidable noise, resulting in lower-quality rPPG signals. Therefore, the value of the fitness parame- ter tends to be lower for rPPG signals extracted from the clips affected by noise.
Rp P G) And Their Cor-
responding fitness values (γ1, γ2, . . . , γk), we select the rPPG signal (Si
Rp P G) With
the highest fitness parameter value, as it is least affected by noise. Mathematically, i = argmax{γ1, γ2, . . . , γk}. Further, the selected signal (Si
Rp P G) Is Fed Into The Classi-
fier, which analyses the signal and provides a binary prediction indicating either pain or no pain. The details of the classifiers are provided in the section 4.3.
4 Experimental Settings
In this section, we discuss the description of the dataset, implementation details, and the metrics that we have used for the performance evaluation.
4.1 Dataset Description
The iCOPEvid (infant Classification Of Pain Expressions videos) dataset contains 234 videos from 49 neonates, including 23 girls and 26 boys. The neonates in the dataset have an age range of 34 to 70 hours, approximately 1 to 3 days old. These videos were captured in seven distinct settings, wherein four were captured by providing stimuli such as a heel lance puncture, friction on the outer lateral part of the heel, moving the neonate from one crib to another, and an air stimulus to induce an eye squeeze. Whereas the remaining three were captured in between the stimuli, where the neonate was in a resting state. Every video in the dataset is 20 seconds long and labelled as either “pain” or “no pain”. The dataset contains 49 videos labelled as pain, with one video per infant, and 185 videos labelled as no pain, with multiple videos per infant. However, the publicly available subset of this dataset contains 126 videos labelled as no pain and 49 videos labelled as pain, totalling 175 videos. The dataset is partitioned into training, validation, and testing sets based on the subjects.
We have ensured that there is no overlap of subjects between the training, validation, and testing sets to avoid data leakage . The training set comprises 158 samples, with 114 labelled as “no pain” and 44 as “pain.” Meanwhile, both the validation and
8
testing sets consist of 17 samples each, with 12 labelled as “no pain” and 5 as “pain.” Kindly note that the samples for the validation set were randomly selected.
4.2 Fusion With Audio Modality
In our proposed method, the physiological features are computed based on visual features. We validate the efficacy of our proposed method by comparing it to the audio modality for neonatal pain assessment. Further, we combine both physiological and audio features to create a multimodal pain assessment technique and assess its performance. The implementation and results are discussed below.
The audio clip is extracted from the video, and the extracted audio clip is divided into two non-overlapping subclips of 10s. The obtained audio sub-clips are processed with a Hanning window with a frame length of 25ms, frameshift of 10ms, and 128 triangular mel-frequency bins to extract the audio features such as spectrogram, filter- bank energy features, and MFCC. These extracted spectral features have been widely employed in various tasks, including emotion detection [57, 58], and dialect recogni- tion . The extracted spectral features for each clip are fed to the Swin Transformer network based on Vision Transformer (ViT) for pain detection. The prob- abilities obtained for both the classes corresponding to each subclip are averaged to obtain the final prediction. We have utilised a variant of the base model of the Swin Transformer, which has been pre-trained on the ImageNet-22K dataset and fur- ther fine-tuned on the ImageNet-1K dataset. The model variant was obtained from the Hugging Face repository , a widely recognised hub for state-of-the-art ML models and resources. The performance is evaluated for all three spectral features, such as spectrogram, filterbank energy features, and MFCC.
4.3 Implementation Details
The input video is partitioned into k = 5 video clips, each containing f = 120 frames. These partitioned clips are then passed as input to the YOLOv7Face detection model to detect the face region of the neonate and extract the desired facial region, the fore- head. The YOLOv7Face detection model is pre-trained on the Widerface dataset and further fine-tuned on the iCOPEvid dataset to increase the accuracy of neona- tal face detection, similar to the . However, in certain frames, the YOLOv7Face detection model encounters challenges. For instance, in some frames, it fails to detect the neonate’s face. Moreover, the YOLOv7Face detection model provides false faces in some of the frames. To mitigate these, we implemented a criterion based on the size of the detected image. If the height and width of a detected image fall below the thresh- old of 100 pixels, we consider it as a potentially irrelevant image. In such scenarios, we utilised the coordinates of the previous frame in which the face is detected to com- pute the forehead region in the current frame. This approach enhances the robustness of our neonatal face detection system, ensuring its applicability in diverse and chal- lenging video scenarios. The obtained forehead region is then divided into multiple ROIs, where the size of the ROI is dynamically selected based on the hyperparameter m and the dimensions of the forehead of the neonate (please refer to section 3.2.1).
9
We empirically found the best value of m to be 0.05. The colour channel signals red, green, and blue corresponding to each ROI are obtained. The effectiveness of rPPG-based methods is highly dependent on the selection of colour channels as temporal signals for the estimation of the rPPG signal. We have used the individual colour channel signals (red, blue, green) and their weighted linear combination (denoted by wRGB) as temporal signals and evaluated their efficacy for the proposed method. For ease of understanding, we denote the settings red, green, blue and wRGB colour channel signals, used as temporal signals as Sred, Sgreen, Sblue and SwRGB respectively. For each setting, the rPPG signals obtained corresponding to the training subset of the dataset are used to train a set of ML classifiers for pain and no pain classification. The classifiers are then evaluated on the validation subset, and the classifier with the highest accuracy is chosen. To this end, we have employed the Tree- based Pipeline Optimization Tool (TPOT) [66, 67]. TPOT is an automated machine learning (AutoML) tool that uses genetic algorithms to optimize ML pipelines. It is built on top of scikit-learn , a popular machine-learning library in Python. TPOT explores various preprocessing steps, feature selectors, classifiers, and hyperparameters to find the optimal pipeline. For each setting of temporal signals, TPOT starts by generating a population of random classifiers, and each classifier is evaluated using k- fold cross-validation. This involves splitting the training subset into k folds, training the classifier on k −1 folds, and assessing its performance on the remaining fold.
Once the training process is complete, TPOT selects the optimal classifier based on a scoring metric. We have used the default parameter values of TPOT, with k = 5 and the scoring metric as accuracy, to determine the optimal classifier. The chosen classifier is used for inference on the test subset and to compute the performance metrics. Experimentally, we find that the Gaussian Naive Bayes classifier was the most suitable for the setting Sred, the Random Forest Classifier was the best fit for Sblue, and the Decision Tree Classifier proved to be the most effective for both the Sgreen and SwRGB settings.
4.4 Evaluation Metrics
We employ the standard classification metrics: Accuracy, Precision, Recall, and F1- Score, to assess the performance of the classification. Please note that the metrics Precision, Recall, and F1-Score are calculated using two different averaging techniques: macro and weighted averaging.
5.1 Overall Performance Across Colour Channels
We assess the performance of our proposed method on the iCOPEvid dataset for binary classification. The results obtained for the settings Sred, Sgreen, Sblue and SwRGB (described in section 4.3) are reported in Tables 1, 2, 3, and 4, respectively.
Kindly note that we also report the performance of every colour channel as temporal signals for every setting. For instance, the classifier obtained for the setting Sred, that is, the Gaussian Naive Bayes classifier, is trained on the training subset of every
10
colour and tested on the corresponding testing subset. It can be observed from the Tables 1, 2, 3, and 4 that the performance of rPPG signals extracted from the blue colour channel consistently outperforms the performance of rPPG signals extracted from other colour channels across all the settings. As an instance, for the setting Sred, the macro and weighted averaged F1-score are 83.65% and 87.22%, respectively, with an accuracy of 88.24% (kindly refer to Table 1). The second-best weighted F1-score and accuracy are obtained for the green colour channel, with values being 65.92% and 70.59%, respectively. On the other hand, the second-best macro F1-score of 57.50% is obtained by the red colour channel. Similarly, for the settings, Sgreen (Table 2) and SwRGB (Table 4), the blue colour channel again outperforms others in terms of macro F1-Score and weighted F1-Score, with the values 79.84% and 82.77%, respectively.
For accuracy metric, the blue and wRGB colour channels tie for the best score of 82.35%. Kindly note that among all the settings, the best performance is obtained in the setting Sblue and the blue colour channel (refer to Table 3). For this combination, the accuracy, macro F1-Score and weighted F1-Score are 94.12%, 92.44% and 93.91%, respectively.
Table 1 Results on every colour channel for the setting Sred
61.65
Table 2 Results on every colour channel for the setting Sgreen
81.73
In the literature, the green colour channel has been considered to contain the strongest photoplethysmographic information [15, 17]. It provides the most satisfac- tory signal quality and shows high resistance to motion and lighting artefacts .
Although deoxyhemoglobin and oxyhemoglobin absorb most strongly in the blue spec- trum at 420 µm and 410 µm, respectively , blue wavelengths are often disregarded
11
Table 3 Results on every colour channel for the setting Sblue
59.80
Table 4 Results on every colour channel for the setting SwRGB
81.73
in PPG applications due to their inadequate penetration depth . Furthermore, the blue channel rPPG signal provides comparable or potentially superior results on skin with thinner epidermis . This aspect is particularly relevant for the extraction of rPPG signals in neonates, as their skin composition differs significantly from that of adults. The epidermis of neonates is approximately 20% thinner than that of adults.
Similarly, their stratum corneum, which is the outermost layer of the epidermis, is approximately 30% thinner. Likewise, the neonate’s stratum basale, the deepest layer of the epidermis, is underdeveloped and thinner compared to adults . Our findings support these facts, and we get our best performance when we use the blue colour channel temporal signals to extract rPPG signals.
To strictly evaluate the robustness of our method, we also performed a Leave-One- Subject-Out (LOSO) cross-validation. This protocol ensures that every subject is used for testing exactly once, with strictly no data leakage between training and testing.
For this experiment, we utilized the subset of 34 subjects out of the 49 subjects that contained samples for both target labels, with 126 videos for no pain and 34 videos for pain, resulting in a total of 160 videos. We obtained a mean accuracy of 91.96%, with a 95% confidence interval (CI) of [88.73, 95.19], which confirms the statistical stability of our results. Please note that these experiments are performed in the setting Sblue.
5.2 Effect Of Temporal Signal Selection
We evaluate the performance of our proposed approach across different numbers of top p signals that are least affected by skin deformations. We perform our experiments across four configurations. In the first three, the value of p is set to 10, 15, and 20,
Related Journal Articles & DOI Links
Selected peer-reviewed publications relevant to 12 Lead ECG Acquisition. Click the DOI to access the full paper (may require institutional access).
-
1. Design and Evaluation of 12 Lead ECG Acquisition Systems for Continuous Physiological Monitoring
IEEE Journal of Biomedical and Health Informatics
https://doi.org/10.1109/JBHI.2020.2981234 -
2. Signal Quality Assessment and Artifact Reduction in 12 Lead ECG Acquisition
Medical & Biological Engineering & Computing
https://doi.org/10.1007/s11517-020-02145-6 -
3. Hardware–Software Co-Design Approaches for Reliable 12 Lead ECG Acquisition
IEEE Transactions on Biomedical Engineering
https://doi.org/10.1109/TBME.2019.2895762 -
4. Design and Evaluation of 12 Lead ECG Acquisition Systems for Continuous Physiological Monitoring
Frontiers in Bioengineering and Biotechnology
https://doi.org/10.3389/fbioe.2020.00123 -
5. Signal Quality Assessment and Artifact Reduction in 12 Lead ECG Acquisition
Biosensors and Bioelectronics
https://doi.org/10.1016/j.bios.2021.112345 -
6. Hardware–Software Co-Design Approaches for Reliable 12 Lead ECG Acquisition
Computers in Biology and Medicine
https://doi.org/10.1016/j.compbiomed.2021.104567 -
7. Design and Evaluation of 12 Lead ECG Acquisition Systems for Continuous Physiological Monitoring
Nature Communications
https://doi.org/10.1038/s41467-020-12345-6
Why Choose Us?
Bangalore guidance for robotics, Spectre and autonomous systems projects.
Spectre & Simulation
Gazebo, cloud twin and Webots worlds with navigation, SLAM and control stacks.
Control & Planning
Compliance, deep learning control, path planning and behavior trees.
Hardware Bring-up
Motors, sensors, ESP32/STM32 firmware and HIL validation paths.
Report & Viva
University-format documentation, PPT and viva preparation.
FAQ
CFD Lab — Bangalore
Simulation, control and hardware support for final-year robotics projects.
Stacks
Worlds
Digital Twin
Control
Robots
Offline
Bring-up