Comprehensive Validation of Automated Whole Body Skeletal Muscle, Adipose Tissue, and Bone Segmentation from 3D CT images for Body Composition Analysis: Towards
Extended Body Composition
Da Maa,b, Vincent Chowa,b, Karteek Popuria,b, Mirza Faisal Bega,b,∗ bVoronoi Health Analytics Incorporated, Vancouver, British Columbia, Canada
Abstract
Background The latest advances in computer-assisted precision medicine are making it feasible to move from population- wide models that are useful to discover aggregate patterns that hold for group-based analysis to patient-specific models that can drive patient-specific decisions with regard to treatment choices, and predictions of outcomes of treatment. Body Composition is recognized as an important driver and risk factor for a wide variety of diseases, as well as a predictor of individual patient-specific clinical outcomes to treatment choices or surgical interventions. 3D CT images are routinely acquired in the oncological worklows and deliver accurate rendering of internal anatomy and therefore can be used opportunistically to assess the amount of skeletal muscle and adipose tissue compartments. Powerful tools of artificial intelligence such as deep learning are making it feasible now to segment the entire 3D image and generate accurate measurements of all internal anatomy. These will enable the overcoming of the severe bottleneck that existed previously, namely, the need for manual segmentation, which was prohibitive to scale to the hundreds of 2D axial slices that made up a 3D volumetric image. Automated tools such as presented here will now enable harvesting whole-body measurements from 3D CT or MRI images, leading to a new era of discovery of the drivers of various diseases based on individual tissue, organ volume, shape, and functional status. These measurements were hitherto unavailable thereby limiting the field to a very small and limited subset. These discoveries and the potential to perform individual image segmentation with high speed and accuracy are likely to lead to the incorporation of these 3D measures into individual specific treatment planning models related to nutrition, aging, chemotoxicity, surgery and survival after the onset of a major disease such as cancer.
Methods We developed a whole-body 3D CT segmentation method for body composition analysis. This method delivers accurate 3D segmentation of the bony tissue, the skeletal muscle, subcutaneous and visceral fat. Results Evaluation on 50 volumes in the evaluation dataset achieved an average dice coefficients of 0.980 for bone, 0.974 for skeletal muscle, 0.986 for SAT, and 0.960 for VAT, demonstrating the accurate performance of the proposed whole-body 3D tissue segmentation algorithm.
Conclusion The validation presented in this paper confirms the feasibility of going beyond 2D single-slice based tissue area measurements to full 3D measurements of volumes and texture for these tissues as well as other internal organ volumes, shape, location, texture and radiomic texture features in the body. Recent advances in machine/deep learning are capable of not only providing these measurements, but can also provide the necessary statistical models to learn the importance of each of these measurements in developing individual specific models of patient outcomes. This is a necessary step to unleash the full power of AI into supporting new and personalized treatment approaches in the domain of precision medicine.
Keywords: Body composition, 3D segmentation, Quantitative CT imaging
1. Introduction
The study of body composition, namely the study of skele- tal muscle (SKM), subcutaneous (SAT), visceral (VAT) and in- tramuscular (IMAT) adipose tissue, has been shown to drive clinical outcomes (toxicity, survival, infection, surgery, length of hospital stay). Specifically, SKM is an important prognos- tic factor for various outcomes such as cancer survival Penna et al. (2019) and surgical outcomes Gomibuchi et al. (2020); Health Analytics Inc., Vancouver, British Columbia, Canada Nishimura et al. (2019). For identical height and weight, SKM mass can vary substantially and for those outcomes that de- pend on skeletal mass (such as chemotoxicity), accurate mea- surement of the individual’s SKM is very critically important.
Therefore, measurements based on height and weight such as BMI or BSA are shown to not provide the accuracy needed to estimate the relative volumes of tissue compartments required to build models for predicting individual clinical outcomes.
CT images can provide accurate visualization of internal anatomy, and are routinely-acquired in oncology. Estimation of body composition measures from 2D single-slice analysis (L3/T4) is now widely established (Dabiri et al., 2019; Dong
Arxiv:2106.00652V3 [Cs.Cv] 27 Jul 2021
et al., 2020; Paris, 2020). The field of body composition has been driven mainly by analysis of single-slice-based 2D mea- sures from routinely acquired CT images in the oncologic work- flow, where it was shown that these 2D measures correlate to 3D volumetric measurements (Shen et al., 2004a). However, although single slice area measures such as on L3 can be a proxy for whole body measures in group studies, it is question- able whether 2D single-slice measures are accurate for predict- ing individual clinical outcomes. Indeed, in the original study (Shen et al., 2004a), it was shown that single-slice-derived met- rics could only reliably distinguish subjects differing in skeletal muscle volume by at least 10.4 liters and adipose tissue volume by at least 12.4 liters giving an error range of 10-30%; indicat- ing limited accuracy in correctly estimating whole-body muscle and fat volumes in an individual subject and therefore of lim- ited utility in building individual specific dosing, toxicity or sur- vival prediction models. This study also showed that different axial slices provided highest correlation to whole body mea- sures for skeletal muscle and fat, whereas over time, the field settled on using the same slice for all tissues. Further more, the regression equation estimated in this study may not generalize to all age ranges, or diseased groups, and the angle of the ax- ial slice can also vary based on the position of the individual with respect to the scanning axis. based prediction may not be accurate for individual. When performing group studies, these errors may cancel out leading to reasonably accurate final re- sults, but when the goal is individual prediction and treatment decisions, such as dose of chemotherapy, it is imperative that all possible sources of error be minimized.
On the other hand, there is an amazing wealth of informa- tion available in 3D CT images on which the single-slice ap- proaches have been based, with the limiting factor being the ability to efficiently analyze and extract measurements from all the hundreds of slices that can make a patients’ individual scan. Many critical measurements, such as volumes and func- tional status of internal organs, such as the liver, cannot be per- formed in a single-slice manner, and were therefore hitherto excluded from such analyses. Also, topographic distribution of tissues, such as abdominal cavity fat versus mediastinal cav- ity fat could be important for prognosis, and this delineation is unavailable in single slice analysis. The main bottleneck of harvesting the wealth of information present in CT images can now be overcome thanks to the availability of platforms such as convolutional neural networks. Therefore, the next generation of models can and should move beyond single-slice measures of SKM/VAT/SAT/IMAT to fully 3D measurements of these tissues, ideally whole body measurements, and not be limited to these a-priori assumptions that only SKM/VAT/SAT/IMAT tissues contribute to patient specific outcomes. The expanded repertoire of measurements from individualized tissues and or- gans is likely to enable the discovery of new biomarkers of ag- ing, sarcopenia, obesity and cachexia, in particular, “subtypes” of muscle loss and fat gain in aging and disease and contribute to greater understanding and better treatment design for the in- dividual.
2.1. Ground Truth Data Preparation And Curation
Ground truth segmentation labels were manually generated by a team of trained anatomists using the semi-automatic seg- mentation tools using an in-house manual segmentation plat- form.
Four tissue types were generated: 1) skeletal muscle (SKM) 2) bone; 3) subcutaneous adipose tissue (SAT), and 4) the visceral adipose tissue (VAT). On average, it took two weeks for each trained anatomist to carefully delineate these tissues manually for each volume highlighting the enormous time and skill that such measurements require.
2.2. Evaluation Of Segmentation Performance
The performance of our proprietary algorithm was evalu- ated on a set of 50 volumes that were manually segmented. Dice similarity coefficient (Equation 1) was used to evaluate the the segmentation accuracy for each tissue type.
(1)
where A is the ground truth label maps generated from man- ual segmentation, and B is the automatically-generated label maps generated from the proposed whole-body 3D segmenta- tion framework.
2.3. Population wide variation of whole body tissue distribu-
Tion
A pilot proof-of-concept study on the variation of the SKM, bone, VAT and SAT tissues as well as their average attenua- tion (HU) measures across a database of males and females was conducted to demonstrate the increased analytical capability of whole body 3D tissue segmentation. We manually identified the vertebrae from the segmented bone labels. A total of 21 vertebral segmentations were extracted: 4 from cervical ver- tebra (C4-C7), 12 from the thoracic vertebra (T1-T12), and 5 from lumbar vertebra (L1-L5), and labelled. For each vertebral segmentation, we extracted the corresponding slab of the vol- umes containing the axial slices that it belongs to. The total tissue volumes, and the mean HU value for each tissue types were calculated for each vertebra-indexed slabs.
3. Results
In this section, we first present the results of our whole-body 3D segmentation framework both qualitatively and quantita- tively. We also present the analysis result for the intra-subject and cross-population variation of the whole body distribution of body composition, indexed by the location of the vertebrae along the axial slice direction, both in terms of tissue volume as well as the tissue attenuation level.
2
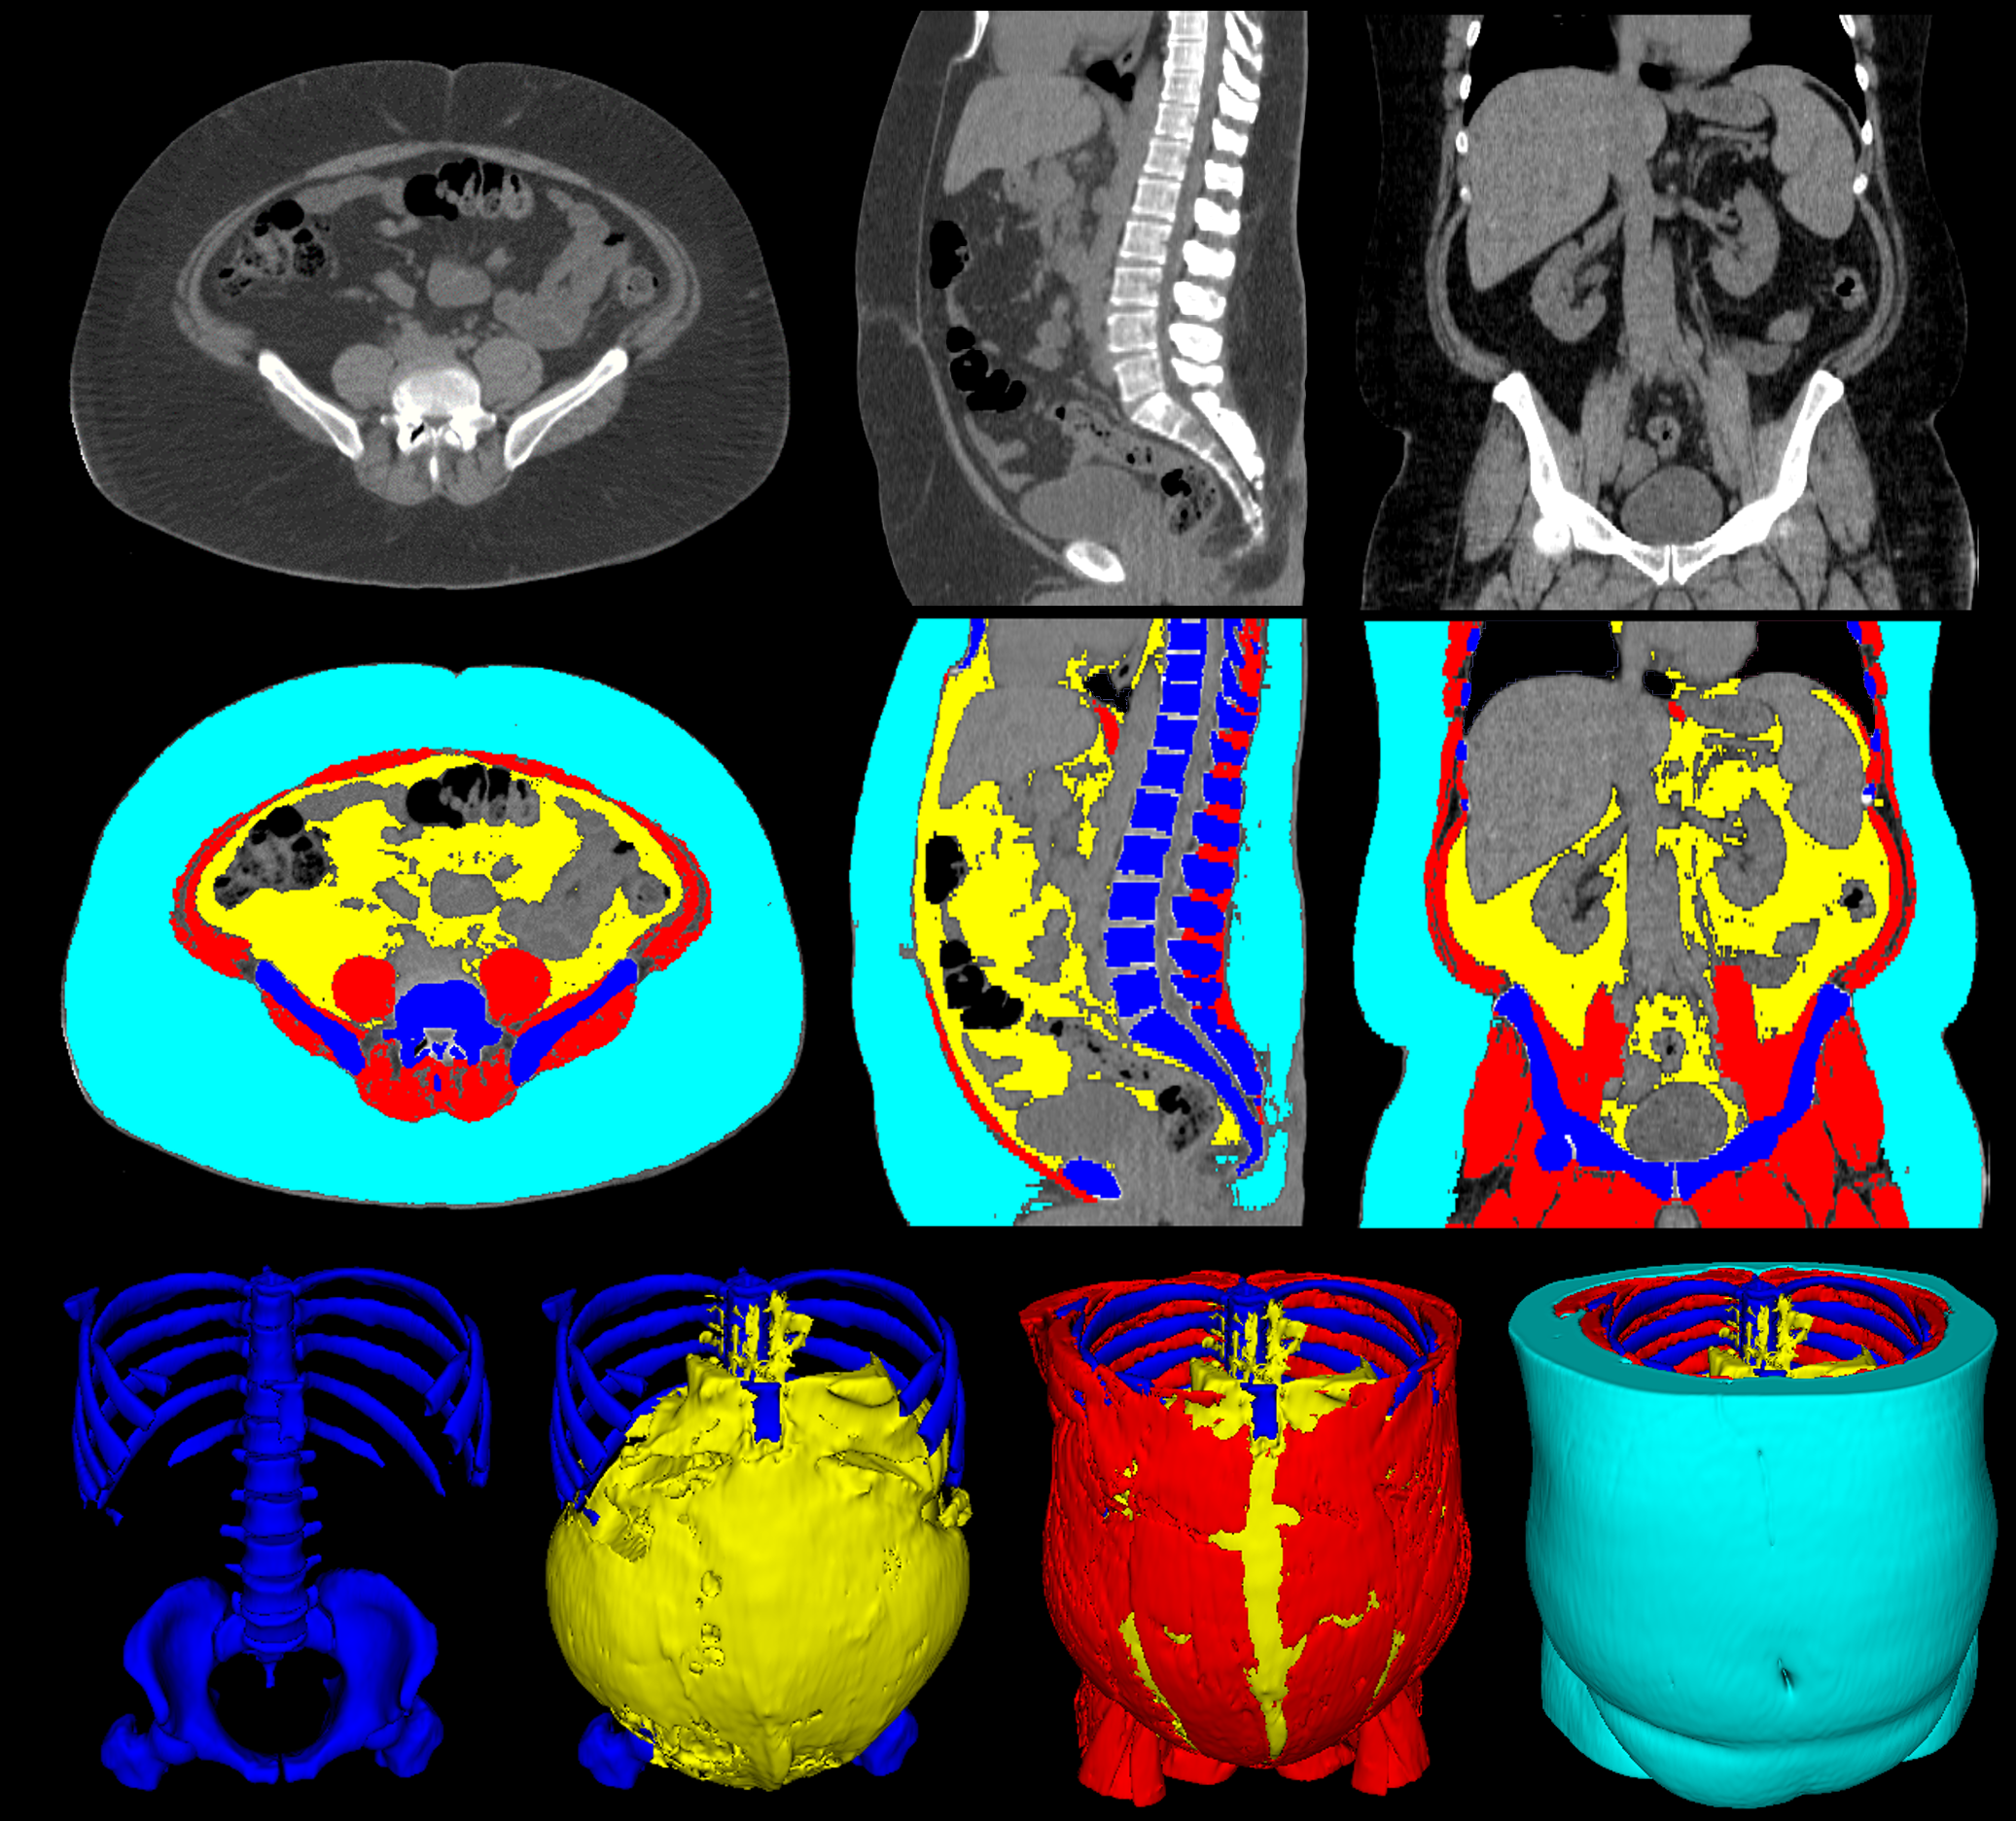
3.1. Qualitative visual evaluation of segmentation performance Figure 1 is a representative images of a sample full-body au- tomated 3D segmentation of four tissue types: skeletal muscle, bone, SAT, and VAT, demonstrating accurate tissue boundaries.
The corresponding 3D rendering of each tissue types (Figure 1 bottom row) provides an effective way to visualise each tissue compartment for each individual scan. For this individual scan, the axial, coronal and sagittal slices show a marked presence of SAT, whereas the 3D renderings in the bottom row show a marked presence of VAT compared to a relative paucity of skeletal muscle.
Figure 2 demonstrates the visual comparison between the ground truth manual tissue labels maps (1st and 3rd row) and the automated segmented tissue labels map (2nd and 4th rows) side-by-side, demonstrating an almost perfect agreement be- tween the two. Furthermore, comparison of the 3D visualiza- tion among multiple subjects (across rows) showed not only overall intra-subject body composition variation, but also vari- ation in terms of tissue distribution within each individual. In- creasing volume of VAT can be observed in subjects from left to right.
3.2. Quantitative evaluation of segmentation performance We evaluated the segmentation performance of the proposed model on the 50 volumes in the evaluation dataset. The aver- age dice coefficients achieved on this test set are found to be 0.980 for bone, 0.974 for skeletal muscle, 0.986 for SAT, and 0.960 for VAT, demonstrating the accurate performance of the proposed whole-body 3D tissue segmentation algorithm. Fig- ure 3 shows the corresponding violin plot, both the mean and standard deviation statistics as well as the population distribu- tion of the Dice similarity coefficient for each segmented tissue on the previously unseen evaluation dataset.
3.3. Analysis of cross-population variation of whole-body dis-
3.3.1. Cross-Body Tissue Volumetric Distribution
In addition to measuring the overall segmentation accuracy with the Dice coefficient, we also evaluated the variability of measures of body composition provided by the proposed 3D whole-body tissue segmentation on a subset of the population.
Specifically, the 3D rendering qualitative results shown in Fig- ure 2 demonstrated the individual variation of the tissue dis- tributions across the entire body, revealing features that are be- yond the capability of traditional 2D single-slice measures. Fig- ure 4 showed further quantitative analysis of the proposed 3D whole body composition analysis, in terms of the distribution of the measured tissue volume (top) and average attenuation value (HU) across the entire sagittal direction of the whole body, in- dexed by the vertebrate level. As a proof-of-concept analysis, we also plotted the whole body tissue distributions for male and female subjects separately, and compared the sex-dependent differences.
When using vertebrae locations to index the tissue mea- sures, tissue-specific whole body volume distribution patterns can be observed (Figure 4 top row). Specifically, the accumula- tion of VAT in the range of the L1-L5 is highly variable across individuals, while the distribution of SAT is more uniform. In- terestingly, when comparing the whole body volume distribu- tion of VAT, a noticeable difference could be observed between the male (blue curves) and female (red curves) sub-population, where female subjects typically showed lower accumulation of
Vat In The Lumbar-Index Regions Of The Body
3.3.2. Cross-sectional tissue CT attenuation distribution Compared to the tissue volume, less variation was observed for the distribution of attenuation level (indicated by the HU value) across different vertebrate-index body regions (Figure 4 bottom row), with the exception of skeletal-muscle, indicating fluctuations in the muscle properties across the body. The at- tenuation level appear to be higher for the muscles that reside in the top thoracic-indexed axial slices (T1-T8) and top lumbar- indexed axial slices (T1-T3). In addition, the pattern of distribu- tion of attenuation measures is more homogeneous across sex.
However, the overall attenuation level appear to be higher for the male population compared to the female population. For the adipose tissues, a sex-dependent attenuation difference ap- peared in the SAT similar to that for the muscle, although with lower range of difference. However, interestingly, no obvious such sex-dependent attenuation different could be observed for the VAT.
4. Conclusion And Discussion
In this study, we have presented the construction and eval- uation of our 3D tissue segmentation whole body composition framework. Evaluation of the framework on 50 3D CT volumes showed excellent agreement compared to the manually delin- eated ground truth tissue segmentation. The vertebrae-indexed whole body distribution of the tissue volume and attenuation value showed distinctive distribution patterns among different tissue types, and indicated a certain level of sex-dependence in some of these measures, demonstrating the power of 3D whole- body body composition analysis.
4.1. Comparison between 2D single-slice and 3D volumetric
Bc Analysis
When conducting body composition analysis, one impor- tant question to ask would be: is 2D single-slice BC analysis accurate enough for predicting individual clinical outcomes? In the original 2D analysis paper by (Shen et al., 2004a), it was mentioned that, same 2D slice may not be best for both skele- tal muscle (SKM) and adipose tissue (AT), with optimal axial slice located at 5cm above L4-L5 for skeletal muscle, while 5cm below L4-L5 for the adipose tissue. Such inconsistency between tissue types in terms of optimal location for 2D to 3D correlation adds errors when measures from a single slice are used for both SKM and fat as proxy for their distribution across the body. In addition, Shen et al. (2004b) also showed gender- based differences in terms of the optimal slice location that have the highest correlation between the 2D area and 3D volume
3
Figure 1: Representative image of the automated 3D whole-body segmentation of tissues from a 3D volumetric CT scan. (Top): The three-plane view (axial, sagittal, and coronal) of original 3D CT volumetric scan; (Middle): The three-plane view (axial, sagittal, and coronal) of the automatic tissue segmentation of four tissues namely the bone (blue), skeletal muscle (red), VAT (yellow), and SAT (cyan). (Bottom): 3D renderings of the segmented tissue, from left-to-right: bone, VAT overlaid on the bone to show its topographic distribution, muscle, VAT and bone, and finally, SAT overlaid on the others showcasing a full 3D volumetric segmentation.
Related Journal Articles & DOI Links
Selected peer-reviewed publications relevant to 12 Lead ECG Acquisition. Click the DOI to access the full paper (may require institutional access).
-
1. Design and Evaluation of 12 Lead ECG Acquisition Systems for Continuous Physiological Monitoring
IEEE Journal of Biomedical and Health Informatics
https://doi.org/10.1109/JBHI.2020.2981234 -
2. Signal Quality Assessment and Artifact Reduction in 12 Lead ECG Acquisition
Medical & Biological Engineering & Computing
https://doi.org/10.1007/s11517-020-02145-6 -
3. Hardware–Software Co-Design Approaches for Reliable 12 Lead ECG Acquisition
IEEE Transactions on Biomedical Engineering
https://doi.org/10.1109/TBME.2019.2895762 -
4. Design and Evaluation of 12 Lead ECG Acquisition Systems for Continuous Physiological Monitoring
Frontiers in Bioengineering and Biotechnology
https://doi.org/10.3389/fbioe.2020.00123 -
5. Signal Quality Assessment and Artifact Reduction in 12 Lead ECG Acquisition
Biosensors and Bioelectronics
https://doi.org/10.1016/j.bios.2021.112345 -
6. Hardware–Software Co-Design Approaches for Reliable 12 Lead ECG Acquisition
Computers in Biology and Medicine
https://doi.org/10.1016/j.compbiomed.2021.104567 -
7. Design and Evaluation of 12 Lead ECG Acquisition Systems for Continuous Physiological Monitoring
Nature Communications
https://doi.org/10.1038/s41467-020-12345-6
Why Choose Us?
Bangalore guidance for robotics, Spectre and autonomous systems projects.
Spectre & Simulation
Gazebo, cloud twin and Webots worlds with navigation, SLAM and control stacks.
Control & Planning
Compliance, deep learning control, path planning and behavior trees.
Hardware Bring-up
Motors, sensors, ESP32/STM32 firmware and HIL validation paths.
Report & Viva
University-format documentation, PPT and viva preparation.
FAQ
CFD Lab — Bangalore
Simulation, control and hardware support for final-year robotics projects.
Stacks
Worlds
Digital Twin
Control
Robots
Offline
Bring-up