1
Expanded flow rate range of high-resolution nanoDMAs via improved sample flow injection at the aerosol inlet slit.
Abstract
High-resolution DMAs requiring hundreds of lit/min of sheath gas flow Q to classify 1 nm particles have not been previously examined and optimized under the modest Q values (tens of lit/min) needed to classify particles well above 10 nm. Here we study the resolving power R (based on the relative half width of the transfer function) of the Halfmini DMA, at sample flow rates q>1 lit/min. The charge-reduced electrosprayed ovalbumin protein used as test aerosol has an accurately determinable Gaussian mobility distribution, which limits the measurable R to at most 25-30. Non-ideal DMA response can however be precisely probed by comparing measured peak widths with the convolution of the protein’s mobility distribution with the triangular Knutson-Whitby distribution associated to the finite qi/Q ratio. For the unmodified Halfmini DMA, R departs considerably from ideal at qi/Q values as modest as 2%, revealing a problem with the aerosol inlet flow. This imperfection is not removed by either increasing or decreasing the slit width, nor by reorienting axially the sample flow jet as it merges with the sheath gas. By introducing a ring with many perforations upstream of the inlet slit, which favors a more symmetric distribution of the sample flow over the slit perimeter, R values close to ideal are approached with qi/Q ratios as large as 6-12%. This improvement enables (in principle) classification of particles larger than 30 nm.
Running Title: Improved Dma Inlet Slit Flow
Key words: Differential Mobility Analyzer; inlet slit; Flow instability; Mixing layer;
Nanoparticles; Upper Size Range
Published in Journal of Aerosol Science, 113, 265-275 (2017)
1. Introduction
Differential mobility analyzers are capable of classifying an impressive range of particle sizes, from several hundred nm down to small sub-nanometer ions. For a cylindrical DMA of inner and outer electrode radii R1, R2 charged by a voltage difference V, and with classification length L, when the sample aerosol inlet and outlet flows qi and qo are matched (qi=qo=q), the selected target mobility ZV is related to the sheath gas flow rate Q
2Πlv
.
(1)
While arbitrarily small Z (large particle diameter) values may be classified at sufficiently small Q, a size limit is imposed by the need to achieve a certain resolving power, defined here as the inverse of the relative width of the mobility peak for a monomobile aerosol:
(2A)
Conventionally V is the voltage at the maximum of the mobility peak and ΔV is the full peak width at half height. However, for relatively wide peaks where the position of the peak maximum is not as precisely defined as the two voltages V+ and V- at half height, a definition based only on the pair of values V+ and V- is preferable. One possibility is to substitute V in (2a) either by the arithmetic or the geometric mean of V+ and V-. Here we adopt the alternative simpler but nonstandard definition based on the ratio of these
(2B)
Besides its simplicity, definition (2b) enjoys the practical advantage that the inferred resolving power is independent of whether the peak is represented in terms of mobility or the inverse mobility variable proportional to DMA voltage.
For a non-diffusing aerosol with matched inlet and outlet flow rates, R follows from the triangular transfer function of Knutson and Whitby (1975) as
(3)
which for small q/Q is very close to q/Q. Accordingly, since a finite sample flow q is required in order to obtain a measurable aerosol output, Q must be at least qR, resulting approximately in the following ideal minimal mobility for non-diffusing particles:
(4)
Table 1: Ideal upper size range for two DMAs, assuming Rq=20 Lit/min.
108
a Knutson and Whitby 1975. b Fernandez de la Mora and Kozlowski 2013. c Kallinger et al. 2011. d Value assumed for the purpose of this calculation
3
Table 1 compiles for reference the characteristics of three DMAs, with corresponding ideal largest classifiable particle diameters, assuming Rq=20 lit/min. The respective dmax would be 346 nm, 43 nm and 165 nm for Rq=10 lit/min (163 nm 24 nm and 85 nm for Rq=30 lit/min). These ideal upper size limits are substantial for the 2 cm long Halfmini DMA, particularly considering that it is designed to handle laminarly sheath gas flow rates in excess of 800 lit/min in order to classify 1 nm particles with R>40. However, one cannot take for granted that the assumed ideal behavior will be met in practice at Q much smaller than the design values. The fluid dynamics of DMAs is in fact particularly delicate and prone to instabilities in the region where the sample gas enters the classification region, where a mixing layer forms between the aerosol and sheath gas streams, generally having different speeds. Although such mixing layers are always unstable under inviscid conditions, they may be expected to be stable at sufficiently small Reynolds numbers for
(5)
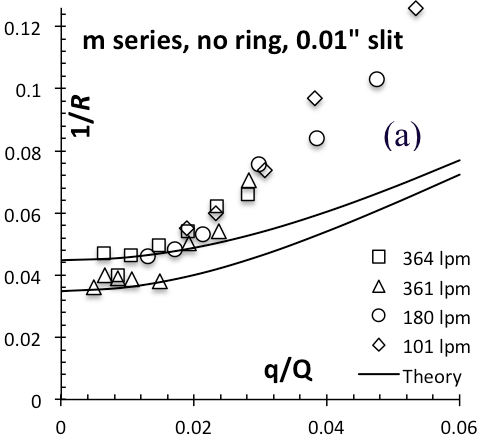
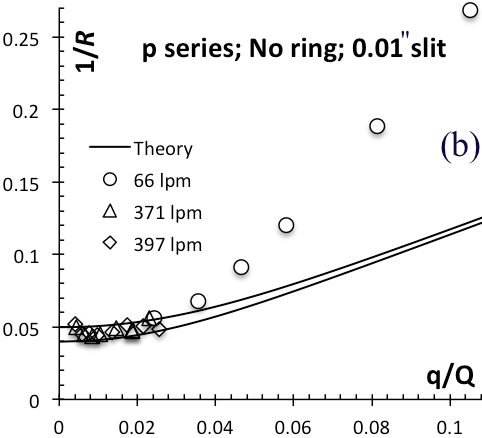
where ν is the kinematic viscosity of the sample gas. This expectation is met in reality by the Halfmini DMA at small enough qi, where high resolving powers are achieved even though the sheath gas velocity is much larger than the aerosol velocity. However, as shown in Figure 1a, the resolution of this DMA drops substantially below the ideal value (see section 2) at increasing q/Q. As a result, the upper particle diameter limit compatible with a given resolving power is considerably smaller than the ideal values listed in Table 1. This non-ideality has other undesirable consequences, even when analyzing 1-5 nm particles. For example, due to high diffusion losses in this size range, recent tandem DMA studies of clusters have required relatively large sample flow rates (Attoui et al., 2013a, b), which reduce the resolution, limiting the ability to distinguish clusters containing n and n+1 molecules with relatively large n. For these and other related reasons, the present work investigates the source of non-idealities arising at the aerosol inlet slit of the Halfmini DMA, as well as several approaches to moderate or cancel them.
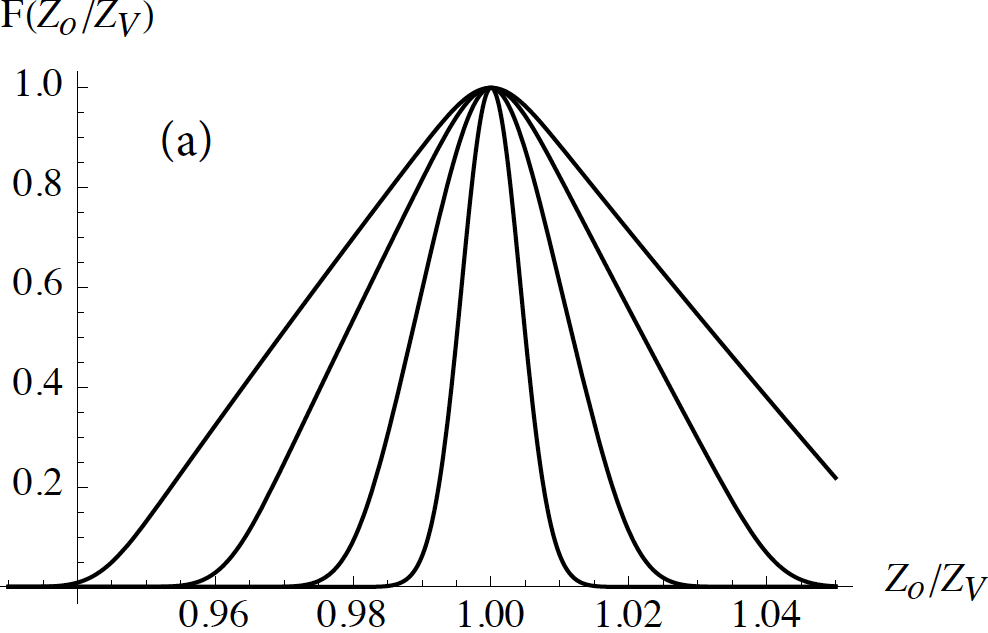
Figure 1: Peak width for an ovalbumin aerosol analyzed by two Halfmini DMAs, both showing large departures at q/Q>2% from the ideal behavior (accounting for the finite width of the test aerosol; Section 2). (a) earlier DMA model (m series) with radially pointing aerosol jet. (b) New DMA (p series) with axially pointing aerosol jet A major source of non-ideality will be seen to be associated to lack of axisymmetry of the aerosol stream as it enters the analyzing region. The average flow rate per unit slit length is q’=q/(2πR2), but asymmetries make q’ dependent on the angular position θ along the slit
4
perimeter, resulting in local q’ values considerably larger than the average, especially in the slit region near the inlet tube bringing the aerosol sample. This asymmetry naturally results in a θ-dependent width of the DMA response function. It also increases the local Reynolds number of the entering aerosol jet, promoting mixing layer instabilities at unnaturally low q values. The aerosol inlet asymmetry has been considered in the past, but we are not aware of a satisfactory solution. TSI’s widely used 3071 DMA includes means evidently intended to produce a relatively axially symmetric sheath gas stream, but has no obvious analogous elements to provide an axisymmetric aerosol flow. For undisclosed reasons, the Vienna DMA (Reischl et al., 1991) introduces the sample aerosol tangentially. According to Rosell et al. (1996) the resulting swirl “… plays the positive role of transporting the aerosol into the full circumference of the DMA, though at the cost of inducing certain instabilities in the main analyzer flow”. These instabilities took the form of a doubly humped transfer function. Filling much of the annular space upstream the inlet slit with a ring resulted in a single peak, apparently by dampening the swirl, though “at the cost of a non-uniform entering aerosol flow, which increases locally the ratio qi/Q, thus decreasing resolution.” This precedent led Eichler (1997) to design the annular inlet chamber of his own DMA such that the resistance for the gas to flow along the circumference of a relatively wide annulus would be much smaller than that required to cross the relatively narrow slit. Unfortunately this design was not tested at the small q/Q ratios relevant to classify large particles. A limited number of unpublished subsequent tests in the Herrmann and the Halfmini DMAs explored the effect of widening or narrowing the inlet slit, but were not successful at removing the unnaturally large resolution loss observed at increasing q. Since the pressure drop across the slit increases quadratically with the inverse slit width, these failures suggested that Eichler’s strategy might not suffice to solve the problem. However, a more systematic investigation was not pursued. Our current goal is accordingly to fill this gap.
2. Theoretical loss of resolution due to the lack of a monomobile size standard For an aerosol with a Dirac distribution of mobilities centered at Z, the ideal DMA output aerosol concentration at a target mobility ZV [related to the DMA control variables via
With
q’=q/Q.
(7)
For an aerosol with a mobility distribution f(Z), the ideal aerosol output concentration F(ZV) for a DMA setting ZV includes contributions from a range in input Z values, given
Q'
)dZ .
(8)
As we shall see, the mobility distribution of the ovalbumin aerosol primarily used in this
(9)
for which the convolution integral (8) may be written analytically as (10b), in terms of the
The Second Group Y=Azo
2 is a measure of the intrinsic mobility width of the protein sample used, simply associated to the maximum resolving power Ro that can be measured
(11)
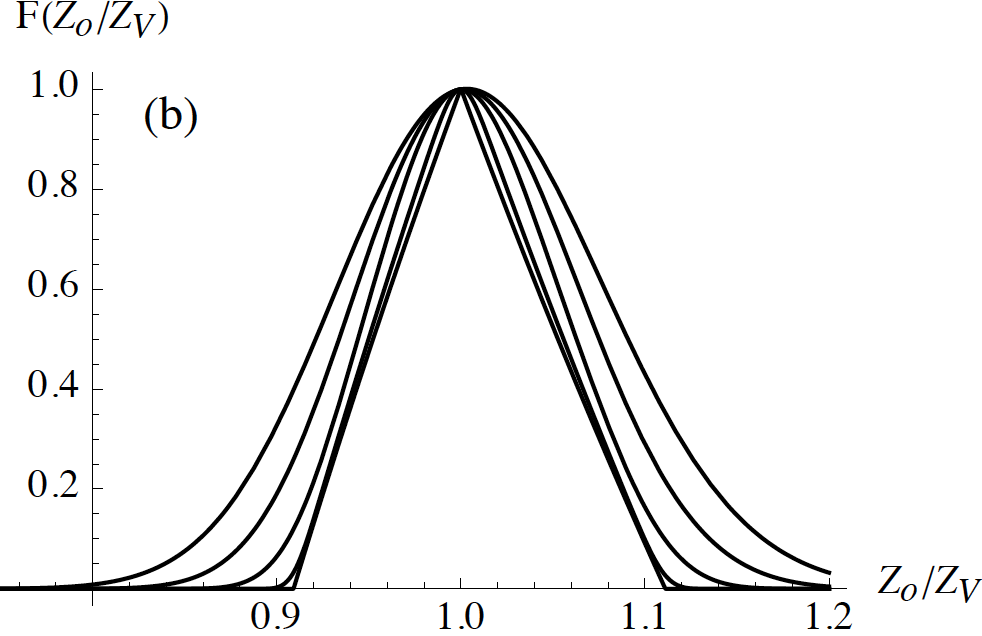
Figure 2: (a, b) Normalized peak shapes predicted by Equation (10b) for various (Ro, q’) pairs. (a): Ro=100, q’=10-7, 0.02, 0.04, 0.06 (center to sides). (b): q’=0.1,Ro=1899, 60, 19, 10.4, 7.35 (center to sides). (c) Ra(Ro, q’) curves from Equation (10) for 1/Ro=0; 0.01; 0.02; 0.03; 0.04; 0.05; 0.06; 0.07; 0.08 (bottom to top). The straight dotted line is Ra=q/Q.
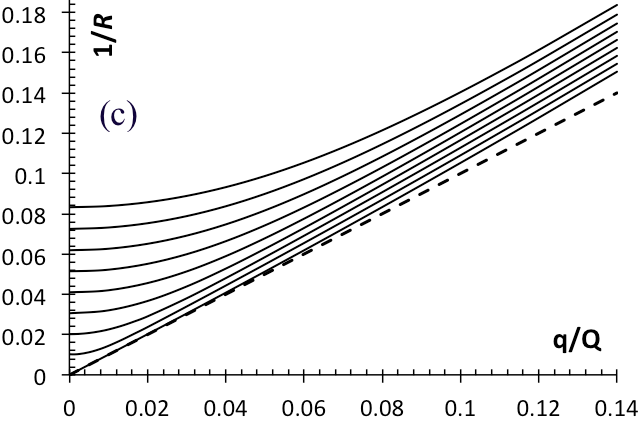
Several instances of normalized peak shapes are given in Figures 2a-b for various values of the parameters Ro and q’. At q’=0.1, in (b), for large Ro (narrow mobility standard) the curves are close to the ideal triangle. At Ro=60 the triangle is distorted primarily at its vertices. The inverse of the half width ΔZV of these distribution normalized by Zo is an apparent resolving power, to be referred to as Ra. Ra is a function of the two dimensionless groups Ro and q’ represented in Figure 2c versus q’ for selected Ro values: Ra= Ra(Ro, q’).
(12)
The indicated values of the parameter Ro associated with each line may also be read approximately from the graph as the limit of the function Ra(Ro, q’) as q’→0. The predicted curves are approximately horizontal at q’=0, with an apparent resolving power determined by the quality of the mobility standard, with little q’ dependence. Figure 2 shows that the ideal Knutson-Whitby curve (3) is substantially modified by the use of an imperfect mobility standard. For instance, for 1/Ro=0.04, at q’=0.04, 1/Ro is displaced from 4% to 5.71%. Figure 2c includes two lines going through the origin (corresponding
-1
= q’, corresponding to the conventional definition of the resolving power, while the curved continuous line is equation (3). This apparently small difference does in fact reduce noticeably the differences to be observed between theory and experiments.
While Equation (10) applies approximately to our weakly-diffusing protein particles having a finite mobility distribution, one may argue that it applies equally to our alternative standard of diffusing monomobile particles (C12) by simply substituting the diffusive broadening (also Gaussian; Stolzenburg, 1988; Tammet, 1970; Rosell et al., 1996) in lieu of the intrinsic width. The main practical difference between both situations is that the intrinsic width of the protein standard is independent of Q (weak diffusive broadening) while the diffusive peak width of our ion standard scales with Q-1/2.
3. Experimental
General considerations for generating size standards above 5 nm. A key obstacle complicating the precise determination of DMA performance in the size range of tens of nm has been the lack of methods to produce highly monomobile aerosols in the size range above 5 nm. Prior to the development of electrospray ionization (Fenn et al, 1989), the conventional means to produce a test aerosol to characterize one DMA was size classification of a polydisperse aerosol with another DMA (ideally identical to the first DMA; Rader and McMurry, 1986), combined with a deconvolution process to infer the individual DMA transfer functions from the measured transfer function of both DMAs in tandem (TDMA). Here we follow a hybrid of the electrospray and the TDMA methods.
We use electrosprayed protein ions as the test aerosol, which is, however, not exactly monomobile due to the coexistence of a range of protein structures. The associated R for an electrosprayed protein may nonetheless be as large as 25-30 (Fernandez de la Mora, 2015). Unlike the output of the first DMA in the TDMA method, the intrinsic mobility distribution of the protein standard may be measured accurately. Indeed, proteins are small enough to be classifiable with high-resolution DMAs previously characterized with exactly monomobile molecular standards. Classification of a protein aerosol does not generally narrow down its size distribution, because the process of interconversion of one protein structure into another occurs in times short compared to the classification time.
Accordingly, the protein standard method relies on one DMA alone, and is free from the problematic TDMA hypothesis that two different DMAs have identical responses. Some form of inversion is still necessary to extract DMA transfer function information from its measured convolution with the natural width of the protein standard. However, an inversion process is not essential to identify and correct DMA imperfections. We will simply use the results of section 2 on the theoretical response of the ideal triangular Knutson-Whitby transfer function combined with the measured protein size distribution, to infer unambiguously the ideal response of the DMA to our imperfect protein aerosol.
Comparison of this theoretical ideal response to the real measured response directly reveals whether or not flow problems exist (as in Figure 1), and suggests schemes to correct them.
Materials
Two test aerosols generated by positive mode electrosprays were used. One involved the dimer ion of tetradodecylammonium bromide (C12; Fluka) dissolved at about 1 mM in ethanol. The other relied on charge-reduced Ovalbumin ions. A Stock solution 90 µM of ovalbumin (Sigma, lyophilized, lot #SLBK1399) and used without further purification) was first prepared in deionized water (no buffer) and kept in a refrigerator. 1.8 µΜ protein solutions were freshly prepared before each set of measurements by adding 2 µL of the stock solution to 100 µl of one of two buffers: either 100 mM aqueous triethylammonium formate (TEAF) or 100 mM aqueous ammonium acetate. Charge-reduced mobility spectra for the buffers were taken right before adding the protein, to verify that they were completely free from involatile impurities that would form particle residues. The just prepared protein solutions were equally seen to be free from residues, but slowly evolved producing a high-mobility peak whose height increased over a time scale of 1 hour. The two buffers led to similar rates of protein degradation.
7
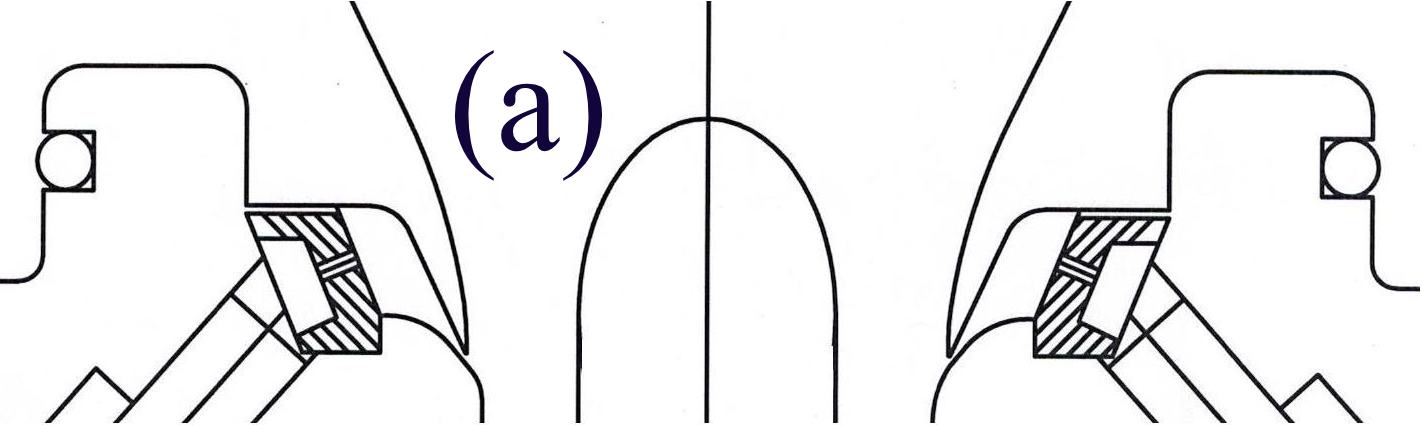
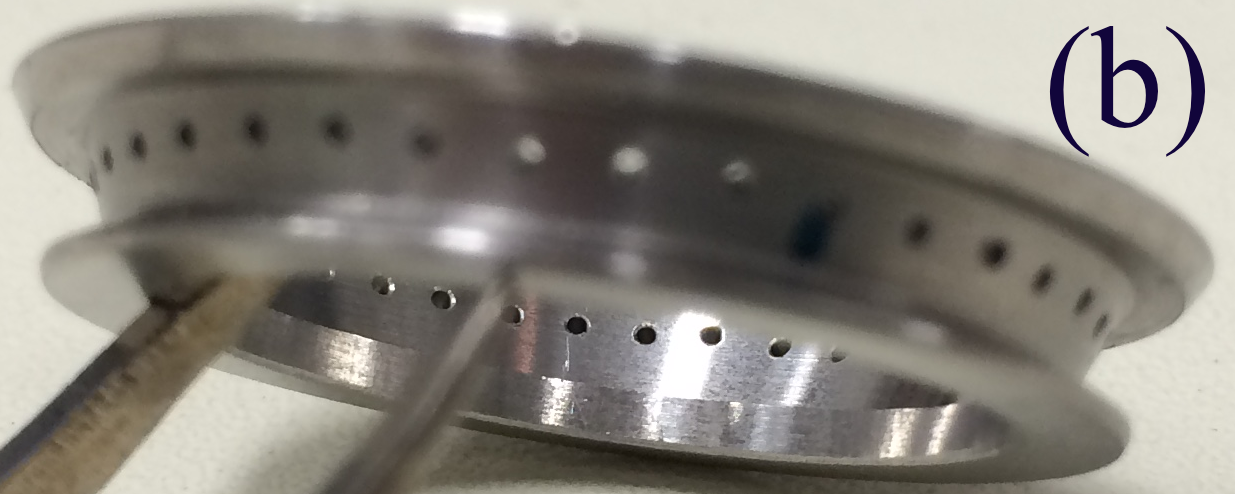
Figure 3: Elements controlling the flow pattern at the aerosol inlet slit. (a) Side view sketch of the new annular chamber preceding the inlet slit. Notice the curved and down- aiming lower lip in the slit, and the perforated ring (ruled) interposed between the aerosol inlet tube and the slit. (b) Image of the 24-hole ring with 0.02” perforations.
DMA. Key characteristics of the cylindrical Halfmini DMA used are listed in Table 1. Several geometrical variations were tested. In the original version (m-series; Fernandez de la Mora & Kozlowski, 2013) the sample aerosol jet projecting into the analyzing region at the inlet slit has a substantial initial radial velocity. The sample jet might then conceivably separate from (and then reattach to) the outer DMA electrode, creating a recirculation bubble that could periodically shed vortices at large enough q. In order to moderate this risk, a new DMA geometry (p-series) was manufactured where, not only the upper lip of the inlet slit, but also its lower lip are directed substantially downwards. In addition, a relatively large radius of curvature is introduced on the lower slit lip following the exit channel, such that the aerosol jet curves gently into the axial direction, reducing its tendency to separate (Figure 3a). Tests of this slit configuration showed slight performance improvements at moderate q/Q (Figure 1b), but were still far from ideal. In order to correct for possible lack of axisymmetry in the aerosol jet entering the analyzing region, a substantial restriction in the path of the aerosol inlet flow was introduced between the inlet slit and the end of the 3 mm ID tube bringing the aerosol from outside the DMA (lower right and left corners of Figure 3a). This restriction is a ring with a number N of symmetrically arranged holes (Figure 3a,b). This perforated ring concept was previously applied to a completely new though still untested DMA design aimed at classifying 60 nm particles (Perez-Lorenzo and Fernandez de la Mora 2017), and owes much to Mr. Luis J. Perez Lorenzo. Three rings were tested, with N values of 24, 36 and 72. The hole diameters D on the first two rings were 0.020” (0.5 mm), all aligned in a single row in the middle of the ring (figure 3b). The 72-hole ring had three rows of 24 holes, with all diameters of 0.020” in one row, all diameters of 0.028” in another row, and a third row with a mix of fourteen 0.020” holes, eight 0.028 holes and two holes blocked by broken drills. The individual jets formed by each of these orifices have substantial Reynolds numbers. For instance, at q=10 lit/min, D=0.02” Reo=4q/(NπDν) = 1180 for N=24 and Reo=787 for N= 36. These jets surely become turbulent even at q below 10 lit/min. Much of the jet momentum and turbulence, however, is damped and spread laterally as the jet collides with the wall of the upper lip and flows towards the slit exit (Figure 3a). For the hybrid 72 hole ring, assuming that the exit velocity (driven by a fixed pressure drop) is the same for both hole diameters and equal to q/(N1πD1
N2Πd2
2/4)=81.6 cm/s at q=10 lit/min, Reo = 381 and 272 for the 0.028” and 0.02” orifices. Besides the cylindrical bullet-shaped inner DMA electrode (Reischl, 1991) characterized in Table 1, a slightly conical inner electrode with a 2o half angle, reaching a radius of 4 mm at the outlet slit, was tested with the 24 and 36-hole rings. This shape is meant to
8
accelerate the flow in the analyzing region, stabilizing the boundary layer at arbitrarily large Q (Hoppel, 1970; Fernandez de la Mora 2002). Another potentially important variable is the height δ of the inlet slit, which determines the velocity of the annular aerosol stream as it mixes with the sheath gas, U=q/(2πR2δsin30o). δ can be controlled by adding shim stock pieces between the DMA parts containing the upper and lower lips of the inlet slit, without affecting the centering or the leak-tightness of the instrument. Three configurations were tested with δ= 0.010”, 0.015” and 0.020”.
The sample inlet flow rate qi varied from 1.2 to 10 Lit/min. It was controlled and measured by a valve and a ball flowmeter that was calibrated in that full flow rate range. The sample gas (filtered and dried laboratory compressed air) passes through an electrospray chamber, and entrains the electrosprayed species into a charge-reduction chamber (Kaufman et al. 1996) containing a nickel ring coated with 10 mCi of the beta emitter Ni-63. The interior wall of the Ni-63 coated ring is 1” long and 1” in diameter. The electrospraying chamber is separated from the charge-reducing chamber by a 50% transparent metal screen meant to avoid penetration of negative ions from the charge reduction chamber into the electrospray chamber (Fernandez de la Mora 2015). The charge-reduced electrospray species created in this chamber then enter into the polydisperse aerosol inlet to the DMA. The DMA-selected monodisperse aerosol is captured by a fast (<100 ms response time) and sensitive (0.12 fA noise) Faraday cup electrometer commercialized by SEADM (Fernandez de la Mora et al, 2016), which measures the current I carried by the sampled gas. Its flow rate qo is not controlled, but is automatically equal to qi because the sheath gas flow circuit operates in closed loop, with a refrigeration system and a HEPA filter following the blower. The sheath gas flow rate Q was controlled by fixing the speed of rotation of the blower, but was not directly measured. Instead, Q is determined from the voltage V at the center of the most mobile peak appearing in a I(VDMA) spectrum, according to the relation (1). Z is the electrical mobility under ambient conditions of either the C12
+ (Zc12=0.714 And 0.493 Cm2/V/S For
the monomer and dimer ions, according to Ude and Fernandez de la Mora, 2005) or the Ovalbumin+ ion (ZOva=0.0671 cm2/V/s, according Fernandez de la Mora, 2015) used as mobility standards. The ratio ZV/Q for the DMA with the conical inner electrode was found to be 1/0.866 times larger than for the cylindrical bullet by operating the two DMAs under identical flow conditions and recording the ratio of voltages (Vcyl/Vcone=0.866) at which the ovalbumin ion appeared.
Raw mobility spectra were obtained by fixing all flow rates and the setting of the electrospray source, sweeping the voltage VDMA of the inner electrode while grounding the outer electrode, and recording (in a computer, with the help of a data acquisition card) the aerosol current collected as a function of VDMA. The high voltage power supply used was from Applied Kilovolts (±10 kV, 30 ms response time from +10 to -10 kV).
3. Results
3.1 Effect of the new downward aerosol entry geometry. Figure 1 compares peak widths in the earlier m series inlet configuration and the new p series inlet configuration (depicted in Figure 2), neither including a perforated ring. One can see a slight resolution increase in the new design (b), but the strong non-ideality already discussed in relation to Figure 1a survives in Figure 1b. No improvements were observed either with the conical
Related Journal Articles & DOI Links
Selected peer-reviewed publications relevant to 12 Lead ECG Acquisition. Click the DOI to access the full paper (may require institutional access).
-
1. Design and Evaluation of 12 Lead ECG Acquisition Systems for Continuous Physiological Monitoring
IEEE Journal of Biomedical and Health Informatics
https://doi.org/10.1109/JBHI.2020.2981234 -
2. Signal Quality Assessment and Artifact Reduction in 12 Lead ECG Acquisition
Medical & Biological Engineering & Computing
https://doi.org/10.1007/s11517-020-02145-6 -
3. Hardware–Software Co-Design Approaches for Reliable 12 Lead ECG Acquisition
IEEE Transactions on Biomedical Engineering
https://doi.org/10.1109/TBME.2019.2895762 -
4. Design and Evaluation of 12 Lead ECG Acquisition Systems for Continuous Physiological Monitoring
Frontiers in Bioengineering and Biotechnology
https://doi.org/10.3389/fbioe.2020.00123 -
5. Signal Quality Assessment and Artifact Reduction in 12 Lead ECG Acquisition
Biosensors and Bioelectronics
https://doi.org/10.1016/j.bios.2021.112345 -
6. Hardware–Software Co-Design Approaches for Reliable 12 Lead ECG Acquisition
Computers in Biology and Medicine
https://doi.org/10.1016/j.compbiomed.2021.104567 -
7. Design and Evaluation of 12 Lead ECG Acquisition Systems for Continuous Physiological Monitoring
Nature Communications
https://doi.org/10.1038/s41467-020-12345-6
Why Choose Us?
Bangalore guidance for robotics, Spectre and autonomous systems projects.
Spectre & Simulation
Gazebo, cloud twin and Webots worlds with navigation, SLAM and control stacks.
Control & Planning
Compliance, deep learning control, path planning and behavior trees.
Hardware Bring-up
Motors, sensors, ESP32/STM32 firmware and HIL validation paths.
Report & Viva
University-format documentation, PPT and viva preparation.
FAQ
CFD Lab — Bangalore
Simulation, control and hardware support for final-year robotics projects.
Stacks
Worlds
Digital Twin
Control
Robots
Offline
Bring-up