And The Influence Of Hearing Impairment
Maartje M. E. Hendrikse1*, Theda Eichler1, Giso Grimm1, Volker Hohmann1 1Auditory Signal Processing and Cluster of Excellence “Hearing4all”,
Abstract
When listening to a sound source in everyday-life situations, typical movement behavior can lead to a mismatch between the direction of the head and the direction of interest. This could reduce the performance of directional algorithms, as was shown in previous work for head movements of normal- hearing listeners. However, the movement behavior of hearing-impaired listeners and hearing aid users might be different, and if hearing aid users adapt their self-motion because of the directional algorithm, its performance might increase. In this work we therefore investigated the influence of hearing impairment on self-motion, and the interaction of hearing aids with self-motion. In order to do this, the self-motion of three hearing-impaired (HI) participant groups, aided with an adaptive differential microphone (ADM), aided without ADM, and unaided, was compared, also to previously measured self-motion data from younger and older normal-hearing (NH) participants. The self-motion was measured in virtual audiovisual environments (VEs) in the laboratory. Furthermore, the signal-to-noise ratios (SNRs) and SNR improvement of the ADM resulting from the head movements of the participants were estimated with acoustic simulations. A strong effect of hearing impairment on self-motion was found, which led to an overall increase in estimated SNR of 0.8 dB for the HI participants compared to the NH participants, and differences in estimated SNR improvement of the ADM. However, the self- motion of the HI participants aided with ADM and the other HI participants was very similar, indicating that they did not adapt their self-motion because of the ADM.
Key words: hearing aids, adaptive differential microphone, self-motion
Introduction
Typical movement behavior in everyday-life situations can lead to a mismatch between the direction of the head and the direction of interest when listening to a sound source. This can happen because people do not always look in the direction of interest, for example when the sound source is not visible or when they get distracted, and because they do part of the movement with their eyes (Hendrikse, Llorach, Hohmann, & Grimm, 2019a). Moreover, in multi-talker conversations it is natural to sometimes look away from the active speaker for social reasons (Vertegaal, Slagter, Van Der Veer, & Nijholt, 2001). For directional hearing aid algorithms this would mean that they are not always facing in the optimal direction, which could reduce their performance. This was described by Hendrikse, Grimm, & Hohmann (2020) as the effect of misalignment. They showed that natural variances in head movements of normal-hearing listeners can indeed result in a different performance of directional algorithms across individual listeners because of misalignment, and that this is a large effect. Ricketts (2000), Abdipour et al. (2015), and Boyd et al. (2013) have also shown an effect of head movement on directional algorithms. It is not yet known whether the movement behavior of hearing-impaired listeners and hearing aid users is different in everyday-life listening situations. There are studies that investigated the influence of hearing impairment and directional microphones on orienting behavior (Brimijoin, McShefferty, & Akeroyd, 2010; Brimijoin, Whitmer, McShefferty, & Akeroyd, 2014), showing that hearing impairment and directional microphones are associated with an increased complexity of orienting behavior towards auditory-only targets. So, there could also be changes in everyday-life listening behavior associated with hearing loss and hearing aid use. Perhaps hearing aid users adapt their head movement behavior when using a directional algorithm, which might lead to a better performance of the algorithms.
In this study we therefore investigate how hearing loss and hearing aids with and without a directional algorithm affect self-motion. We talk about self-motion, i.e. the rotation and translation of the head and torso along with the movement of the eyes, rather than movement behavior here, because we cannot measure psychological aspects such as the intent of the motion due to the limited ecological validity of the laboratory environment (Grimm, Hendrikse, & Hohmann, 2020; Hohmann, Paluch, Krueger, Meis, & Grimm, 2020). To identify whether potential changes in self-motion are relevant in the context of hearing research, we also investigate their influence on the signal-to-noise ratio (SNR) and SNR improvement provided by the directional algorithm.
To do this, older hearing-impaired listeners with and without hearing aid experience were recruited. The participants listened to the virtual audiovisual environments (living room, lecture hall, cafeteria, street and train station) from (Hendrikse et al., 2019a), with some small adaptations to adjust the difficulty. Meanwhile their head, eye and body movements were measured. The hearing loss of the experienced hearing aid users was compensated. For half of the experienced hearing aid users, the sound was processed with a directional algorithm in addition to the hearing loss compensation. An adaptive differential microphone (“ADM”), after Elko & Pong (Elko & Pong, 1995), was chosen as directional algorithm, because adaptive differential microphones are often used in commercial hearing aids. Binaural rendering with head-tracking controlled simulation of self-motion was used to render the sound. The self-motion of the participants was analyzed and compared to that of the normal-hearing participants measured in previous work (Hendrikse et al., 2019a). Moreover, the influence of the self- motion of each participant group on the SNR and the SNR improvement by the ADM was analyzed using acoustic simulations. Estimating the SNR improvement of the ADM also for the participant groups who did not actually use the ADM allowed us to determine whether the aided participants with ADM adapted their self-motion to improve its performance.
It has been shown that hearing-impaired listeners with asymmetric hearing loss successfully make use of head movements to increase the level of the target (Brimijoin, McShefferty, & Akeroyd, 2012). This
3
strategy might not maximize the SNR, but it can help to improve it. Grange & Culling showed that young normal-hearing listeners had difficulty to find a beneficial head orientation (Grange & Culling, 2016). Both studies from Brimijoin et al. and Grange & Culling were performed without visual cues.
When visual cues are present it has been shown that participants usually look at the target speaker (Hendrikse, Llorach, Grimm, & Hohmann, 2018; Hendrikse et al., 2019a), but differences were found between younger and older normal-hearing participants in the relative amount of movement that was done with the head and the eyes (head-eye ratio). Therefore, we hypothesize that hearing impaired listeners and hearing aid users, like normal-hearing listeners, look at the target speaker. We also expect that hearing impaired listeners and hearing aid users orient their head differently, resulting in an increased SNR compared to normal-hearing listeners. If this is the case, the head-eye ratio will differ from normal-hearing listeners. In line with this, we expect that the participants using the ADM adapt their head orientation to increase the SNR improvement of the ADM.
Participants
A total of 30 older (50-80 years, mean age 72.2 years) hearing-impaired (HI) participants was included in this study. The participants were native German speakers and did not suffer from neck- or back- problems, dizziness or epilepsy. All participants had a moderate, symmetric, sensorineural hearing loss resembling the N3 standard audiogram according to Bisgaard et al. (Bisgaard, Vlaming, & Dahlquist, 2010). The participants were divided into three groups: unaided, aided with ADM and aided without ADM. In the unaided group, nine participants were included who did not wear a hearing aid in everyday life, or had a hearing aid for less than two years. The remaining 21 participants had a hearing aid for more than two years (mean 9.7 years), and wore the hearing aid on average 10.7 hours a day.
These 21 hearing aid users were randomly distributed over the aided without ADM (10 participants) and aided with ADM (11 participants) groups.
Environments And Tasks
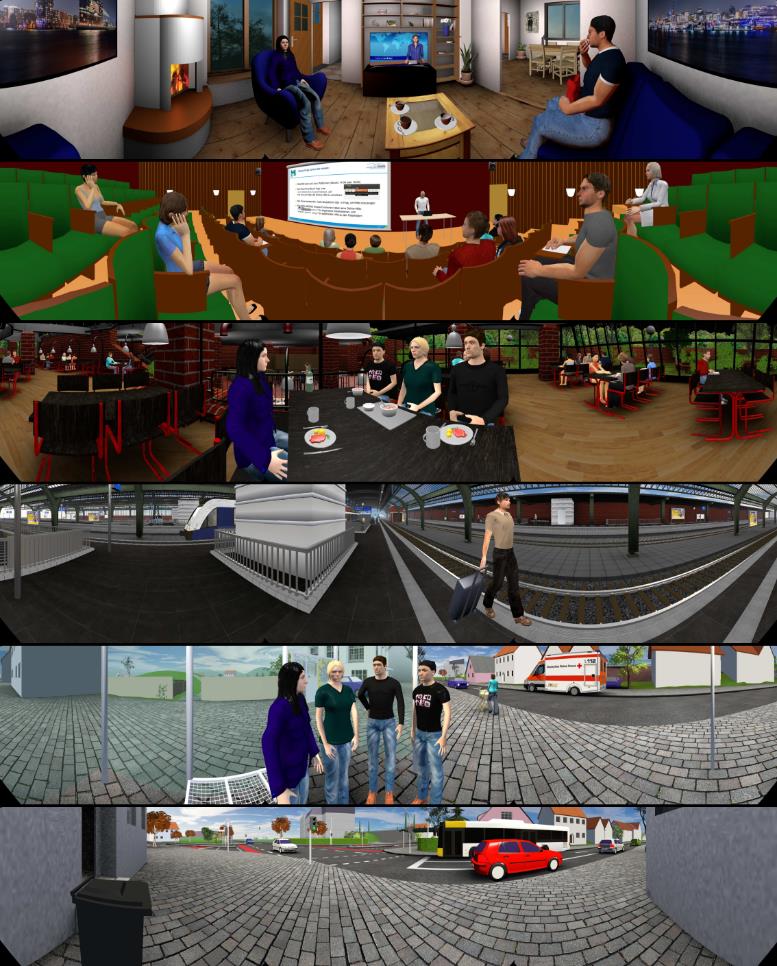
The virtual audiovisual environments (VEs) from Hendrikse et al. (Hendrikse et al., 2019a; Hendrikse, Llorach, Hohmann, & Grimm, 2019b) were used in this study, with a few small adaptations. These VEs represented: listening to the news in a living room, listening to a lecture in a lecture hall, listening to a multi-person conversation in a cafeteria, listening to announcements in a train station, listening to a multi-person conversation at a bus stop on a street (hereafter: streetactive), and waiting at a cross- section (hereafter: streetpassive). The cafeteria VE was presented twice. During the first presentation (hereafter: cafeterialisteningonly VE) the task of the participant was to follow the conversation between the animated persons at the table. The second presentation (hereafter: cafeteriadualtask VE) tested the hand- eye coordination of the test persons in addition. The subjects were asked to follow the conversation and at the same time, on the Purdue Pegboard (Tiffin & Asher, 1948), insert one pin after the other into the holes. A more detailed description of the VEs, including presentation levels, can be found in Appendix 1, pictures are shown in Figure 1. Hendrikse et al. concluded that these VEs were sufficiently realistic, but some suggestions for improvement were made based on the comments of the participants. Most importantly, the conversations in the cafeteria VE were seen as unrealistic by the participants, because no Lombard speech was included in these conversations, making them too hard to understand in such a noisy environment despite realistic SNR. Therefore, new conversations were recorded and implemented including Lombard speech, with three actors (Gerken, Hendrikse, Grimm, & Hohmann, 2020). To achieve this, the three actors in the conversations were listening to cafeteria noise via headphones while their speech was recorded.
4
Figure 1: Pictures of the virtual audiovisual environments (VEs) from Hendrikse et al. (Hendrikse et al., 2019a, 2019b). From top to bottom: living room, lecture hall, cafeteria, train station, streetactive, and streetpassive.
When recording the self-motion of the participants, it was important that they made an effort to understand the target and did not “give up”. Therefore, the SNR of the VEs was adjusted individually to ensure a better level of difficulty. For the individual adjustment, the 70% speech reception threshold (SRT70) of the participants was measured with the Oldenburg matrix sentence test (OLSA; Wagener, Brand, & Kollmeier, 1999) in the diffuse background noise of the cafeteria. The mean SRT70 of 10 NH participants was subtracted from the individual SRT70 and the overall noise level reduced by this difference. This way, the noise level was on average reduced by 6.8 ± 2.5 dB for the HI participants.
Three of the VEs, living room, lecture hall and cafeteria, were presented while the participants were seated on a chair and the other two VEs, train station and street, were presented while the participants were standing. In each VE a target was defined that they had to attend to. Before the actual measurement, the participants could listen to each VE (without target) for about 30 seconds to get familiar with the environment. After the presentation of each VE, the participants had to fill in a content- based multiple-choice questionnaire to make sure they were paying attention to the target.
Setup
This section explains how the virtual audiovisual environments were presented to the participants, and how the self-motion was measured. The measurements were conducted in the audio lab in Oldenburg, for illustrations see Hendrikse et al. (2018). The setup was placed in a sound-treated room, and the equipment was attached to a cloth-covered metal frame, with a diameter of 3.5 m, that reduced environmental sounds, light and room reflections.
Visual Presentation
The visual stimuli were projected onto a cylindrical, acoustically transparent, screen using three projectors (NEC U321H). The combined field of view was about 300°. A graphics card (Nvidia Quadro m5000) performed the warping necessary for projecting onto a cylindrical screen. This process was manually calibrated. The virtual visual environments had been created in Blender (version 2.78a, Roosendaal, 1995) and were rendered using the built-in game engine of this software package. A simulation of movement parallax was added to increase the presence and involvement of the participants. This changed the visual perspective according to the small sways and slight translations the participants made. The position of the virtual camera and the virtual listening position (see next section) was displaced by half of the physical displacement of the head to account also for the displacement relative to the projection screen and loudspeakers, that is, a head translation of 10 cm would be equivalent to a camera/listening position translation of 5 cm in the virtual environments.
Audio Presentation
The virtual acoustic environments had been created using the software package TASCAR (version 0.202-0.204; Grimm, Luberadzka, & Hohmann, 2019). The overall noise level in all VEs was adjusted individually according to the SRT70 scores of the participants as described in the ‘Environments and tasks’ section, for presentation levels see Appendix 1. The signals were rendered for a loudspeaker layout of 29 loudspeakers. The loudspeakers were arranged in a 16-loudspeaker horizontal ring array at ear level (first loudspeaker at 11.25° from frontal direction, with 22.5° spacing), two 6-loudspeaker ring arrays at +45° and -45° elevation (first loudspeakers at 0° and 30° azimuth from frontal direction, respectively, with 60° spacing), and one pole loudspeaker (90° elevation, directly above the participant). However, in the current study the signals were not played back over loudspeakers, but over headphones (Sennheiser HDA 200). To achieve this, the rendered signals were convolved with previously measured head- and hearing-aid-related impulse responses (HARIRs; in-ear, plus three hearing aid microphone positions on each side) for the mentioned loudspeaker layout. The impulse responses were recorded as described in Grimm, Schwarte et al. (2020). A preliminary version of the recordings by Grimm, Schwarte, et al. (2020) was used during the measurements in this study, which contained an error in the channel order for the upper and lower loudspeaker rings. The influence of this error on self-motion was assessed in the additional experiment (Appendix 2), by comparing to the final HARIRs from Grimm, Schwarte, et al. (2020). The effect of the error on self-motion was found to be negligible. After convolution, the resulting signals for the front hearing aid microphones were played back over headphones for the unaided group of participants. The HARIRs from the front hearing aid microphones were chosen instead of the in-ear signals to make sure a difference in self-motion would be due to the hearing loss compensation. For the aided group without ADM also the HARIRs from the front hearing aid microphones were used, and hearing loss compensation was applied. For the aided group with ADM, the signals resulting from convolution with HARIRs from front and rear hearing aid microphones were used as input for the ADM, and hearing loss compensation was applied to the ADM output. Moreover, the head translations in the horizontal plane and the head yaw measured by the head movement sensor were sent to TASCAR, and the position of the acoustic receiver adjusted accordingly, so that the presented audio changed according to the head movements the participants made (binaural rendering with head-tracking controlled simulation of self-motion). The audio was processed with a block size of 1024 samples.
Hearing Loss Compensation And Adm
The hearing loss compensation and ADM were applied using the open master hearing-aid software (openMHA version 4.9.0, Herzke, Kayser, Loshaj, Grimm, & Hohmann, 2017). The hearing loss compensation was performed based on the measured audiogram of the participants, using the CR2 NAL-RP fitting rule. CR2 NAL-RP is based on the linear NAL-RP fitting rule developed by the National Acoustics Laboratories (Byrne, Parkinson, & Newall, 1990). In addition, it adds a compression of 1:2,
6
with a knee point at the narrow-band levels corresponding to 65 dB SPL LTASS, and a noise gate to make sure soft sounds are not maximally amplified. The implementation of the ADM in the openMHA is based on the algorithm described by Elko & Pong (1995). The signal was processed with the ADM before applying the hearing loss compensation.
Sensors
Six infrared cameras (Qualisys Miqus M3) were used to measure the head and torso movements. These tracked the subjects' movements via highly reflective markers attached to the headphones (head movement), and the right and left shoulder pads of a vest (torso movement). The three axes of rotation were recorded: roll, pitch and yaw, as well as the translation on these axes. The motion was recorded by the motion tracking software Qualisys (version: 2019.3.4780) with a sampling frequency of 200 Hz.
The eye movement was measured by a custom-made wireless electrooculogram sensor (EOG). One electrode was placed on the temple next to each eye. The measured signal was sent via WLAN with a sampling rate of 33 Hz and a resolution of 16 bits. Thus the eye movement in horizontal plane could be measured with an accuracy of approximately ±10°. The drift in the eye movement data was approximated by linearly extrapolating the data and then smoothing with a moving-average filter with a length of 500 samples. This approximated drift was subtracted from the eye movement data.
The calibration of the sensors was done with a cross projected onto the screen. To align the head movement sensor with the head direction, the participants were asked to adjust the markers on the headphones until the cross was placed as accurately as possible in the direction of their nose. To calibrate the EOG sensor, the cross was displaced 5-30° to the left or right. The participants were asked to follow the cross with their eyes, accidental head movements were compensated for. After switching between the standing/sitting environment, calibration was repeated. To obtain the gaze trajectories, the head- and eye-movement trajectories were resampled to the same time line with a 120-Hz sampling rate and summed. The TASCAR and LabStreamingLayer (Medine, 2016) software packages were used for time synchronization and data logging.
Analysis Of Self-Motion
To analyze how hearing impairment and hearing aids with and without a directional algorithm affect self-motion, the self-motion of the three HI participant groups, unaided, aided without ADM and aided with ADM, is compared. The movement measures from Hendrikse et al. (2019a) are calculated. These include: the standard deviation of the gaze trajectories (GazeStd); the standard deviation of the head trajectories (HeadStd); the mean speed of the gaze trajectories (GazeSpeedMean); the mean speed of the head trajectories (HeadSpeedMean); the number of gaze jumps, normalized by the duration of the VE (NGazeJumps); the absolute head angle relative to torso over the absolute gaze angle relative to torso (HeadGazeRatio). Furthermore, the root-mean-squared (RMS) error between the direction of the target and the head (TargetHeadRMS) or gaze direction (TargetGazeRMS) was calculated to check how accurately the participants oriented towards the target. In the VEs with multi-talker conversations, the direction of the active speaker at each time point was taken as target direction, and in the lecture hall the direction of the lecturer. In the train station and streetpassive VEs no target direction could be defined, so the TargetHeadRMS and TargetGazeRMS were not calculated in these VEs.
Acoustic Simulations
The acoustic simulation method from Hendrikse, Schwarte, et al. (2020) was used to estimate the SNRs resulting from the individual head movement trajectories of the HI participants in the VEs. In the acoustic simulations, the rendered signals for the 29-loudspeaker layout as described in the ‘Audio presentation’ section were effectively rotated and shifted according to the measured head yaw and
7
head translations of the participants. This resulted again in 29-channel loudspeaker signals, now including the movement. Then, the signals were convolved with the final HARIRs from Grimm, Schwarte, et al. (2020), resulting in hearing aid microphone signals. The acoustic simulations were done separately for the target and noise signals, so that the SNR could be calculated. From the hearing aid microphone signals, the better-ear SNR was calculated using segmental SNR after Quackenbush et al. (1988), with 200-ms non-overlapping windows. By comparing these SNRs between participant groups, differences might become apparent that were not visible in the analysis of self-motion, and it can be analyzed whether differences are relevant for assessing acoustic communication ability. As input for the acoustic simulations, the same SNR was used for all HI participants, namely the SNR resulting from the average noise level reduction of 6.8 dB, so that the results could be compared between participants.
In addition, the hearing aid microphone signals resulting from the acoustic simulations were processed with the ADM using the openMHA. To be able to calculate the SNR after processing with the ADM, the method described by Hagerman & Olofsson (2004) was applied. The better-ear SNR was calculated from the processed signals as described in the previous paragraph. It was analyzed how the ADM would have improved the SNR for the different head movement trajectories by taking the difference between the SNRs of the hearing aid microphone signals processed with the ADM and the unprocessed signals for each head movement trajectory (SNRimprovementADM). Because the acoustic simulations were done separately from the recording of the self-motion, this could be done for the head movement trajectories of all participants, regardless of their aided condition when recording the self-motion. Estimating the SNR improvement of the ADM also for the participant groups who did not actually use the ADM allowed us to determine whether the aided participants with ADM adapted their self-motion to improve its performance. Since no target source was defined in the streetpassive VE, the SNR measures could not be calculated there.
Data From Previous Study
The previously recorded self-motion data of 21 younger normal-hearing (NH) and 19 older NH participants was also included in the analyses, and is available online (Hendrikse, Llorach, Hohmann, & Grimm, 2019c). The self-motion of the NH participants was also measured in the previously- mentioned VEs, but at a different SNR than the self-motion of the HI participants. Only the cafeteria VEs were different, because the original target conversations with four talkers from the previous study were exchanged for the Lombard conversations with three talkers in the current study. Another difference is that the VEs were presented to the NH participants via loudspeakers, and to the HI participants over headphones. The influence of wearing headphones on self-motion was assessed in an additional experiment by comparing to presentation via loudspeakers (Appendix 2) to check whether a comparison between the NH and HI self-motion data is valid. No difference in self-motion was found between headphone and loudspeaker presentation. The measures from the ‘Analysis of self-motion’ section were also calculated for the self-motion data of the NH participants.
In Hendrikse, Grimm, et al. (2020), the NH self-motion data was used in acoustic simulations to estimate the SNRs resulting from the individual head movement trajectories. The acoustic simulation method was revised to make it more accessible, which did not change the outcome, and the scripts were published in a database (Hendrikse, Schwarte, Grimm, & Hohmann, 2020). The estimated SNRs for the NH self-motion data from this database were also used in the current study for comparison to the estimated SNRs for the HI self-motion data. However, because the average noise level reduction of 6.8 dB relative to the NH participants was applied in the acoustic simulations for the HI participants, and the target conversations in the cafeteria VEs were different, the estimated SNRs resulting from the self-motion of the HI and NH participants could not be compared directly. To allow for a comparison, the SNRs without movement (always facing frontal direction) for the VEs from the current and previous study were taken as a reference (Table 1), and the SNRs including the head movement of the HI and
8
NH participants were calculated relative to this reference (SNRrelative). The SNRimprovementADM data for the NH participants was also taken from the database and included in the comparison. A different SNR could influence the performance of the ADM, being a nonlinear algorithm, so a comparison between HI and NH data should be taken with care.
Table 1: Reference SNRs without movement (always facing frontal direction) for each participant group.
10.5 Db
*Data from previous study.
Statistics
A multiway ANOVA was done for the movement measures GazeStd, HeadStd, GazeSpeedMean, HeadSpeedMean, NGazeJumps and HeadGazeRatio. The participant group (unaided, aided without ADM, aided with ADM, and the NH younger and NH older participants from previous work) was included as a between-participants factor. In previous work a significant effect of the different VEs on the self-motion was found, so the environment was included as a within-participant factor, but only to check for interaction effects with the participant group. Similarly, two separate multiway ANOVAs were done for the TargetHeadRMS and TargetGazeRMS measures, and the SNR measures SNRrelative and SNRimprovementADM, but without the train station and/or streetpassive VEs. To correct for multiple comparisons (Cramer et al., 2016), the false discovery rate was controlled with the Benjamini- Hochberg procedure (Benjamini & Hochberg, 1995) for the grouped results of all ANOVAs.
Analysis Of Self-Motion
The main effects of the multiway ANOVAs for the movement measures are shown in Table 2. The outcomes show that there is a strong effect of the participant group on the HeadGazeRatio, and a weaker effect on the GazeStd. Moreover, there are weak interaction effects between the participant group and environment for all measures except HeadSpeedMean. In the following, the measures that have a significant effect of the participant group are analyzed in more detail. Because all these measures also had significant interaction effects, pairwise comparisons (with Bonferroni correction) were done to check for differences between participant groups in each VE.
Table 2: Main effects of multiway ANOVAs for the movement measures.
Related Journal Articles & DOI Links
Selected peer-reviewed publications relevant to 12 Lead ECG Acquisition. Click the DOI to access the full paper (may require institutional access).
-
1. Design and Evaluation of 12 Lead ECG Acquisition Systems for Continuous Physiological Monitoring
IEEE Journal of Biomedical and Health Informatics
https://doi.org/10.1109/JBHI.2020.2981234 -
2. Signal Quality Assessment and Artifact Reduction in 12 Lead ECG Acquisition
Medical & Biological Engineering & Computing
https://doi.org/10.1007/s11517-020-02145-6 -
3. Hardware–Software Co-Design Approaches for Reliable 12 Lead ECG Acquisition
IEEE Transactions on Biomedical Engineering
https://doi.org/10.1109/TBME.2019.2895762 -
4. Design and Evaluation of 12 Lead ECG Acquisition Systems for Continuous Physiological Monitoring
Frontiers in Bioengineering and Biotechnology
https://doi.org/10.3389/fbioe.2020.00123 -
5. Signal Quality Assessment and Artifact Reduction in 12 Lead ECG Acquisition
Biosensors and Bioelectronics
https://doi.org/10.1016/j.bios.2021.112345 -
6. Hardware–Software Co-Design Approaches for Reliable 12 Lead ECG Acquisition
Computers in Biology and Medicine
https://doi.org/10.1016/j.compbiomed.2021.104567 -
7. Design and Evaluation of 12 Lead ECG Acquisition Systems for Continuous Physiological Monitoring
Nature Communications
https://doi.org/10.1038/s41467-020-12345-6
Why Choose Us?
Bangalore guidance for robotics, Spectre and autonomous systems projects.
Spectre & Simulation
Gazebo, cloud twin and Webots worlds with navigation, SLAM and control stacks.
Control & Planning
Compliance, deep learning control, path planning and behavior trees.
Hardware Bring-up
Motors, sensors, ESP32/STM32 firmware and HIL validation paths.
Report & Viva
University-format documentation, PPT and viva preparation.
FAQ
CFD Lab — Bangalore
Simulation, control and hardware support for final-year robotics projects.
Stacks
Worlds
Digital Twin
Control
Robots
Offline
Bring-up