IRACST – Engineering Science and Technology: An International Journal (ESTIJ), #Equal contribution, first author. 3D Printing-Assisted Energy Loss Testing of Artificial Aortic
William T. Brinkman, Md2
The Heart Hospital Baylor Plano, Plano TX 75093, USA Abstract—With development of additive manufacturing, the 3D printing technology has become more common nowadays. We designed and 3D printed a cost-effective liquid fluid pressure measurement device which can convert liquid pressure to air pressure. Air pressure was measured by a low-cost manometer in this study. The device can measure pressure drop across artificial aortic heart valves at different flow rate conditions. The main objective of this study is to utilize the 3D printing technology to measure pressure loss through artificial aortic heart valves. From the measured pressure drop, the energy loss of flow that occurs through the artificial aortic heart valves can be estimated. In the experiment, both mechanical and biological (bovine skin) aortic heart valves have been tested at several different flow rate conditions. By doing so, we were able to measure energy loss at different flow rates through the valves to test which type and size of heart valve has lowest energy loss during operation. . Lower energy loss of the blood through the valve should have lower burden to patient’s heart. This study provides an example of a new application of additive manufacturing in liquid fluid pressure measurement device and showed an acceptable performance in experiment.
Keywords-component; 3D Print, Aortic Heart Valves, Presuure Measurement.
Introduction
A heart consists of four main valves: the mitral valve, tricuspid valve, aortic semilunar valve and the pulmonary semilunar valve. The functions of the mitral and tricuspid valves are to control the blood flow from the atria to the ventricles2. The primary function of the aortic and pulmonary valves is to transport blood out of the ventricles. The aortic valve is located on the left side of the heart and is the gateway between the body and the heart3. It opens when the left ventricle squeezes to pump the blood out and then shuts close in the middle of heart beats to keep the blood flow from prolapsing.

Aortic valve diseases occur in different forms, namely aortic regurgitation and aortic stenosis4. Aortic regurgitation occurs when blood flow is going the opposite way, which is result of the aortic valve closing only partially5. Another disease, aortic stenosis, is when the valvar structure does not open completely, so the body is deprived of blood flow because the heart does not pump enough blood6. Some common causes and symptoms of aortic valve diseases can be congenital (detected from birth) or can be acquired as the patient becomes older.
Leaflet configuration is the arrangement of the leaf like flaps of muscle, which are primarily found in heart valves. All valves in a heart have different functions, but for the means of this paper, the aortic valve will be the focus7. The formation of the semilunar valves begins at four weeks from the beginning of the gestation period, which is when the heart also starts to beat for the first time8, 9. During this early stage in the development of the fetus, the formations of the valves are extremely fragile, and they will move around the structure of the heart. The aortic, pulmonary and tricuspid valves typically have a trileaflet structure, whereas the bicuspid valve has a bileaflet structure10, 11.

Energy loss of an aortic valve typically occurs through the orifice area of the valve, which is the gap between the openings of the leaflets. Since the flow of blood is one continuous motion, the abruptions in the energy are found at the “stops”, in this case, the various valves inside the heart. Through the aortic valve, the energy loss occurs once the oxygenated blood is pushed from the left atrium, to the left ventricle, through the aortic valve, to the aorta, and then through the rest of the body. This is because the kinetic energy of the blood moves upwards through the valve and to the aorta, resulting in a minute amount of energy loss of blood flow specifically through the aortic valve.

For the purposes of our experiment, 3D printing was used to fashion a pressure system as well as placement pieces for the aortic valves. By doing so, there was a limited amount of energy loss as well as proper structure for where the aortic valve was held into place, also assisting with minimizing the energy loss.
With the use of 3D printing, a modern method was implied to complete the scientific analysis of energy loss through artificial aortic valves.
As some previous research and experiments have shown, the energy loss of aortic valve mainly is calculated from flow speed gradients1. Doppler flow speed measurement has been used which is costly. Moreover, the energy loss of aortic valves is not only from flow speed gradients but also from flow pressure drop.
As the solution would flow through the valves, the energy loss and pressure drop were determined with the help of a low-cost manometer and flow meter. The device is capable of measuring various liquid pressure difference at different flow rate conditions with no flow speed difference between inlets and outlets of the valve. To measure the pressure difference between the flow before going through the valves and after going through the valves, a cost-effective liquid fluid pressure measurement device which can convert liquid pressure to air pressure was designed and 3D printed. Air pressure was measured by a low- cost manometer in this study. The main objective of this study is to design customized fluid pressure measurement devices that fit IRACST – Engineering Science and Technology: An International Journal (ESTIJ), with various artificial aortic heart valves with irregular contours using the 3D printing technology and to measure pressure loss through artificial aortic heart valves. From the measured pressure drop, the head loss of the artificial aortic heart valves can be estimated to find energy loss. In the experiment, both mechanical and biological (bovine skin) aortic heart valves have been tested at several different flow rate conditions
Experiment
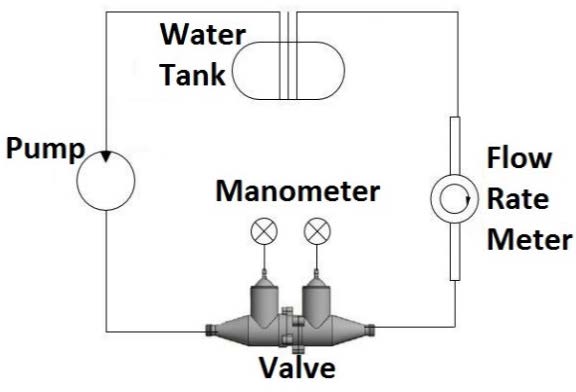
To measure energy loss of biological and mechanical aortic valves, flow pressure difference between the inlet and outlet of the valves need to be measured. Fig. 1 shows a schematic diagram of the experimental setup. The experiment was performed with artificial heart valves, pump, water tank, flow meter, and manometer. The water flow rate from the water tank was measured by a liquid flow rate meter with 0.25 liter per min resolution. To maintain the flow velocity at constant level which could eliminate the dependency of flow rate on energy loss measurement, we have used a flow rate controller. The difference pressure was measured by air pressure manometer with a digital readout. The water pump can deliver up to 5.5 gallons per minute of flow rate.
A. Experiment Materials
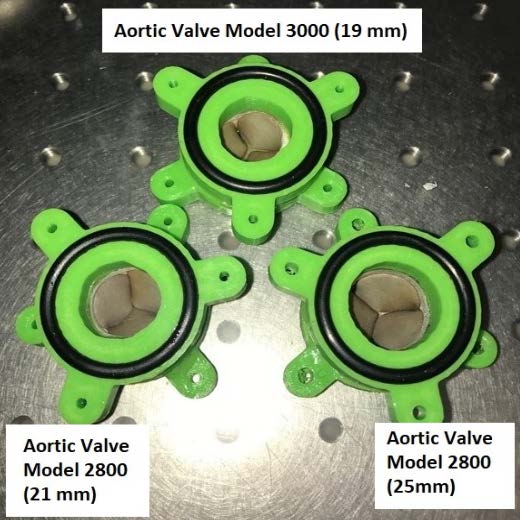
In this experiment, totally four aortic valves had been tested which are Edward Lifesciences Perimount Magna Aortic Valve
Thermafix Process Model 3000Tfx (19 Mm Diameter),
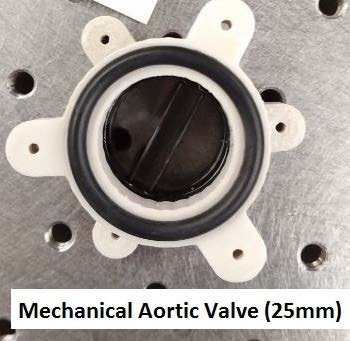
Edward Lifesciences Perimount RSR bioprosthesis Aortic Valve Model 2800 (25 mm diameter), Edward Lifesciences Perimount RSR bioprosthesis Aortic Valve Model 2800 (21 mm diameter), and Mechanical Aortic Bileaflet Valve (25 mm diameter).
B. 3D Printing Instrustments
Auxiliary parts to assist the pressure drop measurement across the valves were designed and 3D-printed. These auxiliary plastic adaptors were used to fit the specific needs for this experiment. Since the shape of biological valves is irregular, the interfacial contours of the biological valves needed to be designed by matching those of 3D printed adaptors. Each valve is sandwiched between and adhered with two pieces of printed adaptors by water-proofed epoxy, as Figure 2 and Figure 3 show.
After adhesion, each specimen is connected to the 3D printed pressure measurement device as the location 1 showed in Figure 4. Between the connections, O-rings are used on each side to avoid leakage. As Figure 2 shows, the plastic adaptors were printed by ABS (acrylonitrile butadiene styrene) which has higher strength and relatively smooth surface. Not only valve adaptors, the whole pressure drop measurement device was designed and 3D printed by ABS.
Figure 1 The Characterization of the Entire Experiment Instrument. Flow direction is counter-clock wise. Testing valve is in the middle place of 3D printed measurement device. Manometer measures the pressure drop in front of the valve and behind the valve.
Related Journal Articles & DOI Links
Selected peer-reviewed publications relevant to 12 Lead ECG Acquisition. Click the DOI to access the full paper (may require institutional access).
-
1. Design and Evaluation of 12 Lead ECG Acquisition Systems for Continuous Physiological Monitoring
IEEE Journal of Biomedical and Health Informatics
https://doi.org/10.1109/JBHI.2020.2981234 -
2. Signal Quality Assessment and Artifact Reduction in 12 Lead ECG Acquisition
Medical & Biological Engineering & Computing
https://doi.org/10.1007/s11517-020-02145-6 -
3. Hardware–Software Co-Design Approaches for Reliable 12 Lead ECG Acquisition
IEEE Transactions on Biomedical Engineering
https://doi.org/10.1109/TBME.2019.2895762 -
4. Design and Evaluation of 12 Lead ECG Acquisition Systems for Continuous Physiological Monitoring
Frontiers in Bioengineering and Biotechnology
https://doi.org/10.3389/fbioe.2020.00123 -
5. Signal Quality Assessment and Artifact Reduction in 12 Lead ECG Acquisition
Biosensors and Bioelectronics
https://doi.org/10.1016/j.bios.2021.112345 -
6. Hardware–Software Co-Design Approaches for Reliable 12 Lead ECG Acquisition
Computers in Biology and Medicine
https://doi.org/10.1016/j.compbiomed.2021.104567 -
7. Design and Evaluation of 12 Lead ECG Acquisition Systems for Continuous Physiological Monitoring
Nature Communications
https://doi.org/10.1038/s41467-020-12345-6
Why Choose Us?
Bangalore guidance for robotics, Spectre and autonomous systems projects.
Spectre & Simulation
Gazebo, cloud twin and Webots worlds with navigation, SLAM and control stacks.
Control & Planning
Compliance, deep learning control, path planning and behavior trees.
Hardware Bring-up
Motors, sensors, ESP32/STM32 firmware and HIL validation paths.
Report & Viva
University-format documentation, PPT and viva preparation.
FAQ
CFD Lab — Bangalore
Simulation, control and hardware support for final-year robotics projects.
Stacks
Worlds
Digital Twin
Control
Robots
Offline
Bring-up