Abstract
Modern wearable devices are embedded with a range of noninvasive biomarker sensors that hold promise for improving detection and treatment of disease. One such sensor is the single-lead electrocardiogram (ECG) which measures electrical signals in the heart. The benefits of the sheer volume of ECG measurements with rich longitudinal structure made possible by wearables come at the price of potentially noisier measurements compared to clinical ECGs, e.g., due to movement.
In this work, we develop a statistical model to simulate a structured noise process in ECGs derived from a wearable sensor, design a beat-to-beat representation that is conducive for analyzing variation, and devise a factor analysis-based method to denoise the ECG. We study synthetic data generated using a realistic ECG simulator and a structured noise model. At varying levels of signal-to-noise, we quantitatively measure an upper bound on performance and compare estimates from linear and non-linear models. Finally, we apply our method to a set of ECGs collected by wearables in a mobile health study.
Introduction
Heart disease is the leading cause of death worldwide, causing over 17.9 million deaths annually with over 600,000 of those deaths in the United States alone [10, 5]. A major challenge in combating heart disease is early identification of high risk individuals. Recently, wearable devices have enabled individuals to passively track biomarkers of health throughout their day-to-day life, as opposed to sporadically in the clinic. While these devices hold promise for combating heart disease by allowing for rich longitudinal tracking of biomarkers across large populations of patients, recordings may be noisier than their clinically recorded counterparts.
Electrocardiograms (ECGs), which measure the electrical activity in the heart, are one such biomarker for monitoring cardiovascular activity. Clinical ECGs measure the electrical activity across twelve different spatial views (i.e., leads) of the heart. In addition to standard use, clinical ECGs have been analyzed with pattern recognition algorithms (e.g., neural networks) to make a variety of predictions, including arrhythmias [11, 12], measures of heart failure , and risk of future adverse events .
Some modern wearables, however, measure the electrical activity at two locations to produce a single lead. In an uncontrolled setting, a single-lead ECG may feature artifacts (e.g., due to movement) or more noise compared to clinical ECGs — in some extreme cases these artifacts render the ECG unrecognizable. This noise motivates the need for methods to denoise these ECGs.
We propose a generative model for temporally-structured artifacts in ECGs and a two-step denoising procedure rooted in factor analysis. Our approach estimates both the temporal structure of perturba- tions across ECGs, and the per-ECG noise amplitude. In a simulation study, we compare performance of simple baselines (e.g., sample averages) to more complex nonlinear methods (e.g., variational ∗Work done during an internship at Apple.
Machine Learning for Mobile Health Workshop at NeurIPS 2020, Vancouver, Canada.
Arxiv:2012.00110V1 [Stat.Ml] 30 Nov 2020
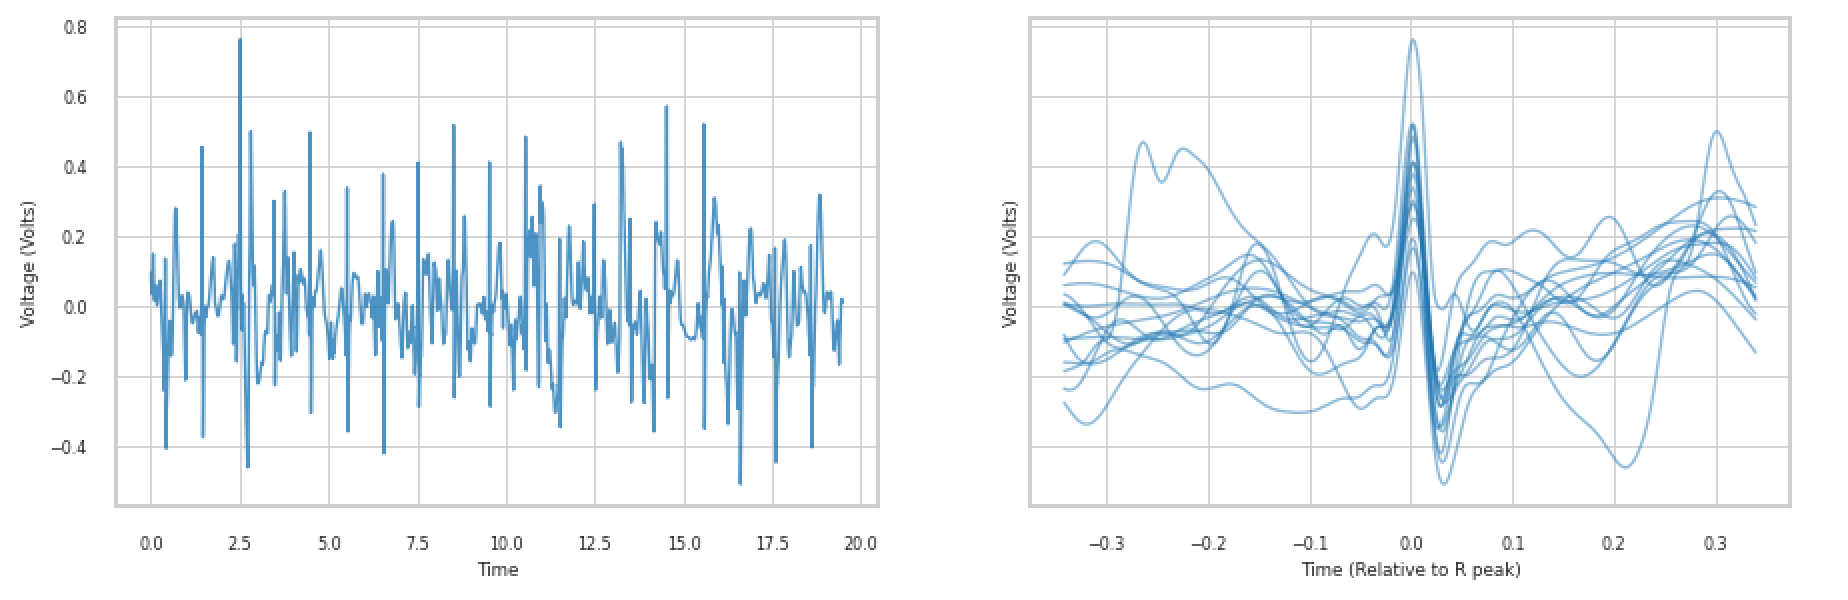
Figure 1: (Left) An example single-lead ECG trace with relatively high noise compared to most measurements. (Right) The same ECG trace represented with the R-peak aligned for each beat. autoencoders ) at varying signal-to-noise ratios on synthetic data, comparing reconstruction error.
The relative performance of each estimator depends on the signal-to-noise ratio, and our factor analy- sis approach consistently performs well and is simpler than nonlinear methods. Finally, we apply our method to a subset of ECG records from the Apple Heart and Movement Study2 to demonstrate its efficacy and statistical properties.
Data Description
Electrocardiograms (ECGs) measure the voltage of the electrical activity of the heart via electrodes placed on the skin (e.g., on the wrist for some wearables). The cardiac muscle cycles through depolarization and repolarization events, resulting in a structured temporal signal. Deviations can indicate cardiac abnormalities or disease. Each heartbeat consists of 3 main components: (1) P wave: depolarization of the atria, (2) QRS complex: depolarization of the ventricles, and (3) T wave: repolarization of the ventricles.
The data collected by wearables have additional sources of variation (see Figure 1). There is heterogeneous noise across samples — where each sample is a full ECG recording — typically due to the sensitivity of the wearable to movements and non-ideal conditions. Cardiac cycle lengths are also heterogeneous, due to changes in heart rhythm either or environmental factors such as exercise.
Additionally, noise is temporally correlated across beats within an ECG sample.
Beat-Aligned Representation
We first segment each ECG sample into a sequence of beats using a wavelet-based algorithm that delineates the P, QRS, and T waves as proposed in . This delineated representation of the ECG allows us to compare the variability from beat-to-beat within a single ECG trace by aligning each beat b ∈{1, . . . , B} relative to its position to the R peak, shown in right of Figure 1. For the rest of this work, we assume that the data are collected at a consistent frequency across all ECG samples allowing us to deal with vectors instead of functions, though this can be handled via functional versions of our denoising methods.
Model
We propose a structured noise model for beat-aligned ECG observations. Within sample i, we model
(1)
where Xi,b, θi, ϵi,b ∈Rd represent the observed ECG beat, denoised ECG beat, and the noise, respectively. The denoised ECG beat θi represents a per-sample canonical beat; structured beat-to- beat variation will be considered in future analysis. ECG noise exhibits temporal correlation structure 2http://www.bwhresearch.org/appleheartandmovementstudy/
With Variable Noise Levels (Τ ∼
Unif(2, 20)).
0.660
with varying levels of amplitude, motivating a shared covariance K, where we set tr(K) = d for identifiability. In order to have a fixed-vector length for each beat across all samples, we fix d so that parts of the beat between the preceding T and succeeding P wave are clipped.
The inferential goal is to recover θi for each ECG sample from a dataset of observed ECGs, {Xi,b}i,b. The simplest approach is to average the aligned beats — this is standard practice to remove beat- to-beat variability during exercise stress tests . On the other end of the spectrum, a nonlinear latent variable model (e.g., a variational autoencoder) can learn complex global structure to denoise individual ECG samples, but can require large datasets and be difficult to train.
We propose an estimator in between these two extremes — a two-step approach that first estimates the covariance structure of the global noise K and per-ECG amplitudes τi, and then applies factor analysis to a rotation of the observed data. To estimate K, we pool information across all observed beats; to estimate the noise amplitude of τi we leverage the multiple observed beats within each recording i. Given an estimate of K and τi, we transform each observation Xi,b so that stochastic variation has (approximately) diagonal structure, suitable for standard factor analysis. The resulting factor analysis estimate is un-transformed to produce the de-noised ECG beat estimate. Further details of this estimator are in Appendix B.3.
In addition to the average beat and VAE, we evaluate the performance of the oracle Bayes estimator , an idealized (and impractical) estimator that serves as an upper bound on estimation performance. We also evaluate a mixture of factor analyzers model that extends the two-step factor analysis estimator with a flexible learned prior. All estimators are described in detail in Appendix B.
Experiments
The denoising methods were run on two datasets: (1) Simulated data where a known ground truth and known noise structure exists and (2) ECGs from a large study where no ground truth data exists. This setup allows us to analyze the statistical properties of the methods in a controlled simulated setting and then study properties of the real data. In the simulated setting, we compare the different estimators using the mean squared error of the estimated beat to the ground truth — this metric averages over the estimator’s ability to reconstruct the amplitude and morphology of the ECG beat.
Simulated Data
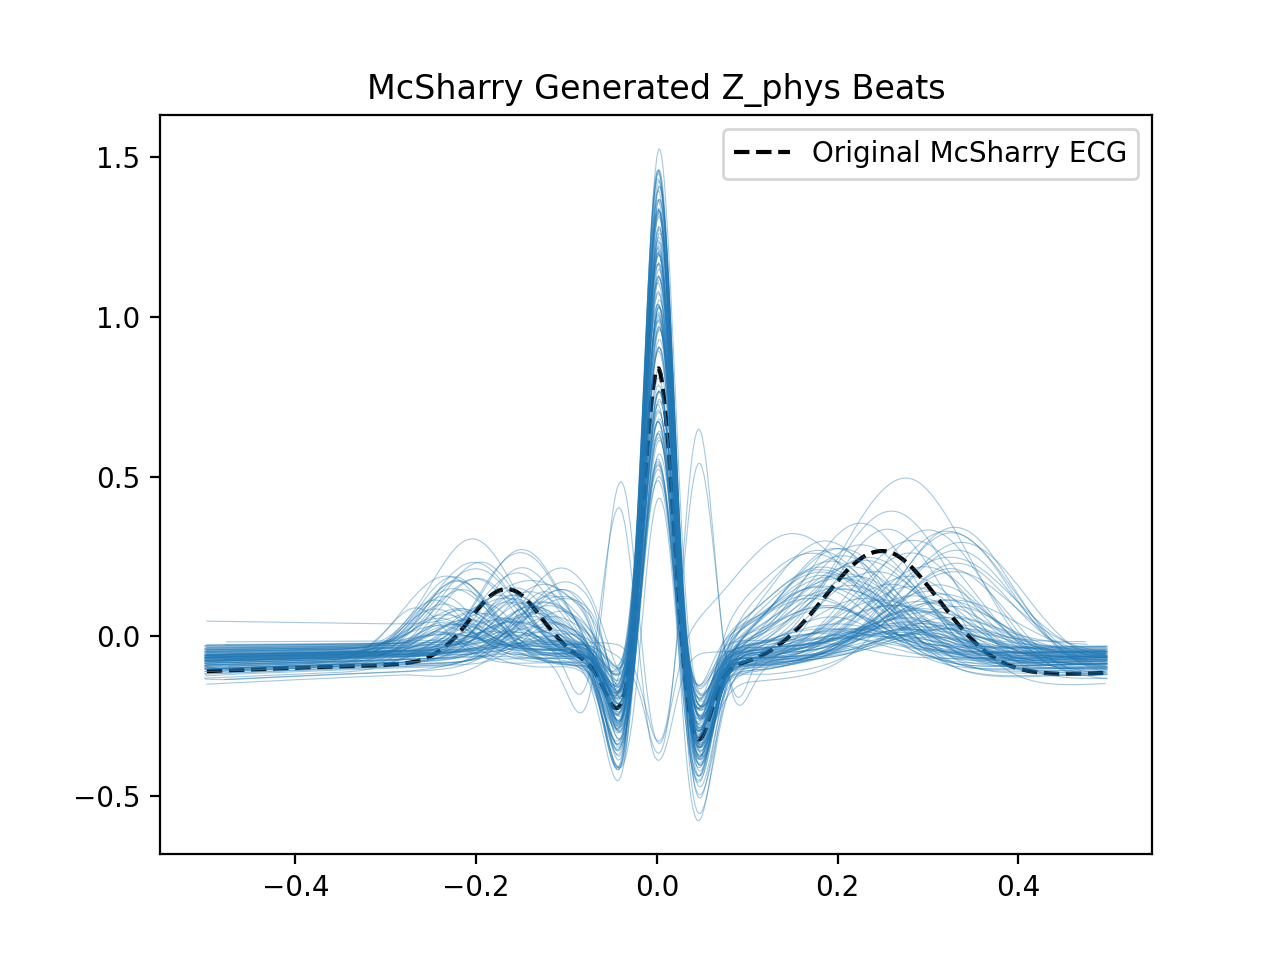
The simulated dataset is generated by solving the initial value problem of the following coupled ODE model proposed in as detailed in Appendix C. To induce variation in the denoised ECG typically present in real data due to factors such as subject-level physiology or environmental factors, the original parameters in the ECG are jittered and randomly sampled resulting in variation in ECG beats as shown in Figure 2.
We apply the methods described above to the realistic case of B = 20 and τi ∼Unif(2, 20) for ground-truth and estimated values of K and τ. The noise covariance K is chosen based on that induced by a Matérn covariance kernel with observations at frequency 500 Hz. The oracle Bayes approach is the best case performance we can expect, and we compare our factor analysis-based approaches (linear, post-hoc corrected, and nonlinear) against the standard MLE baseline as shown in Figure 2. The latent space dimension and other hyperparameters for the linear methods were tuned based on the Scree plot where eigenvalues which decayed with a slope of larger than −0.8 was chosen as the cutoff. The latent dimension was fixed to 20 for the VAE.
(B)
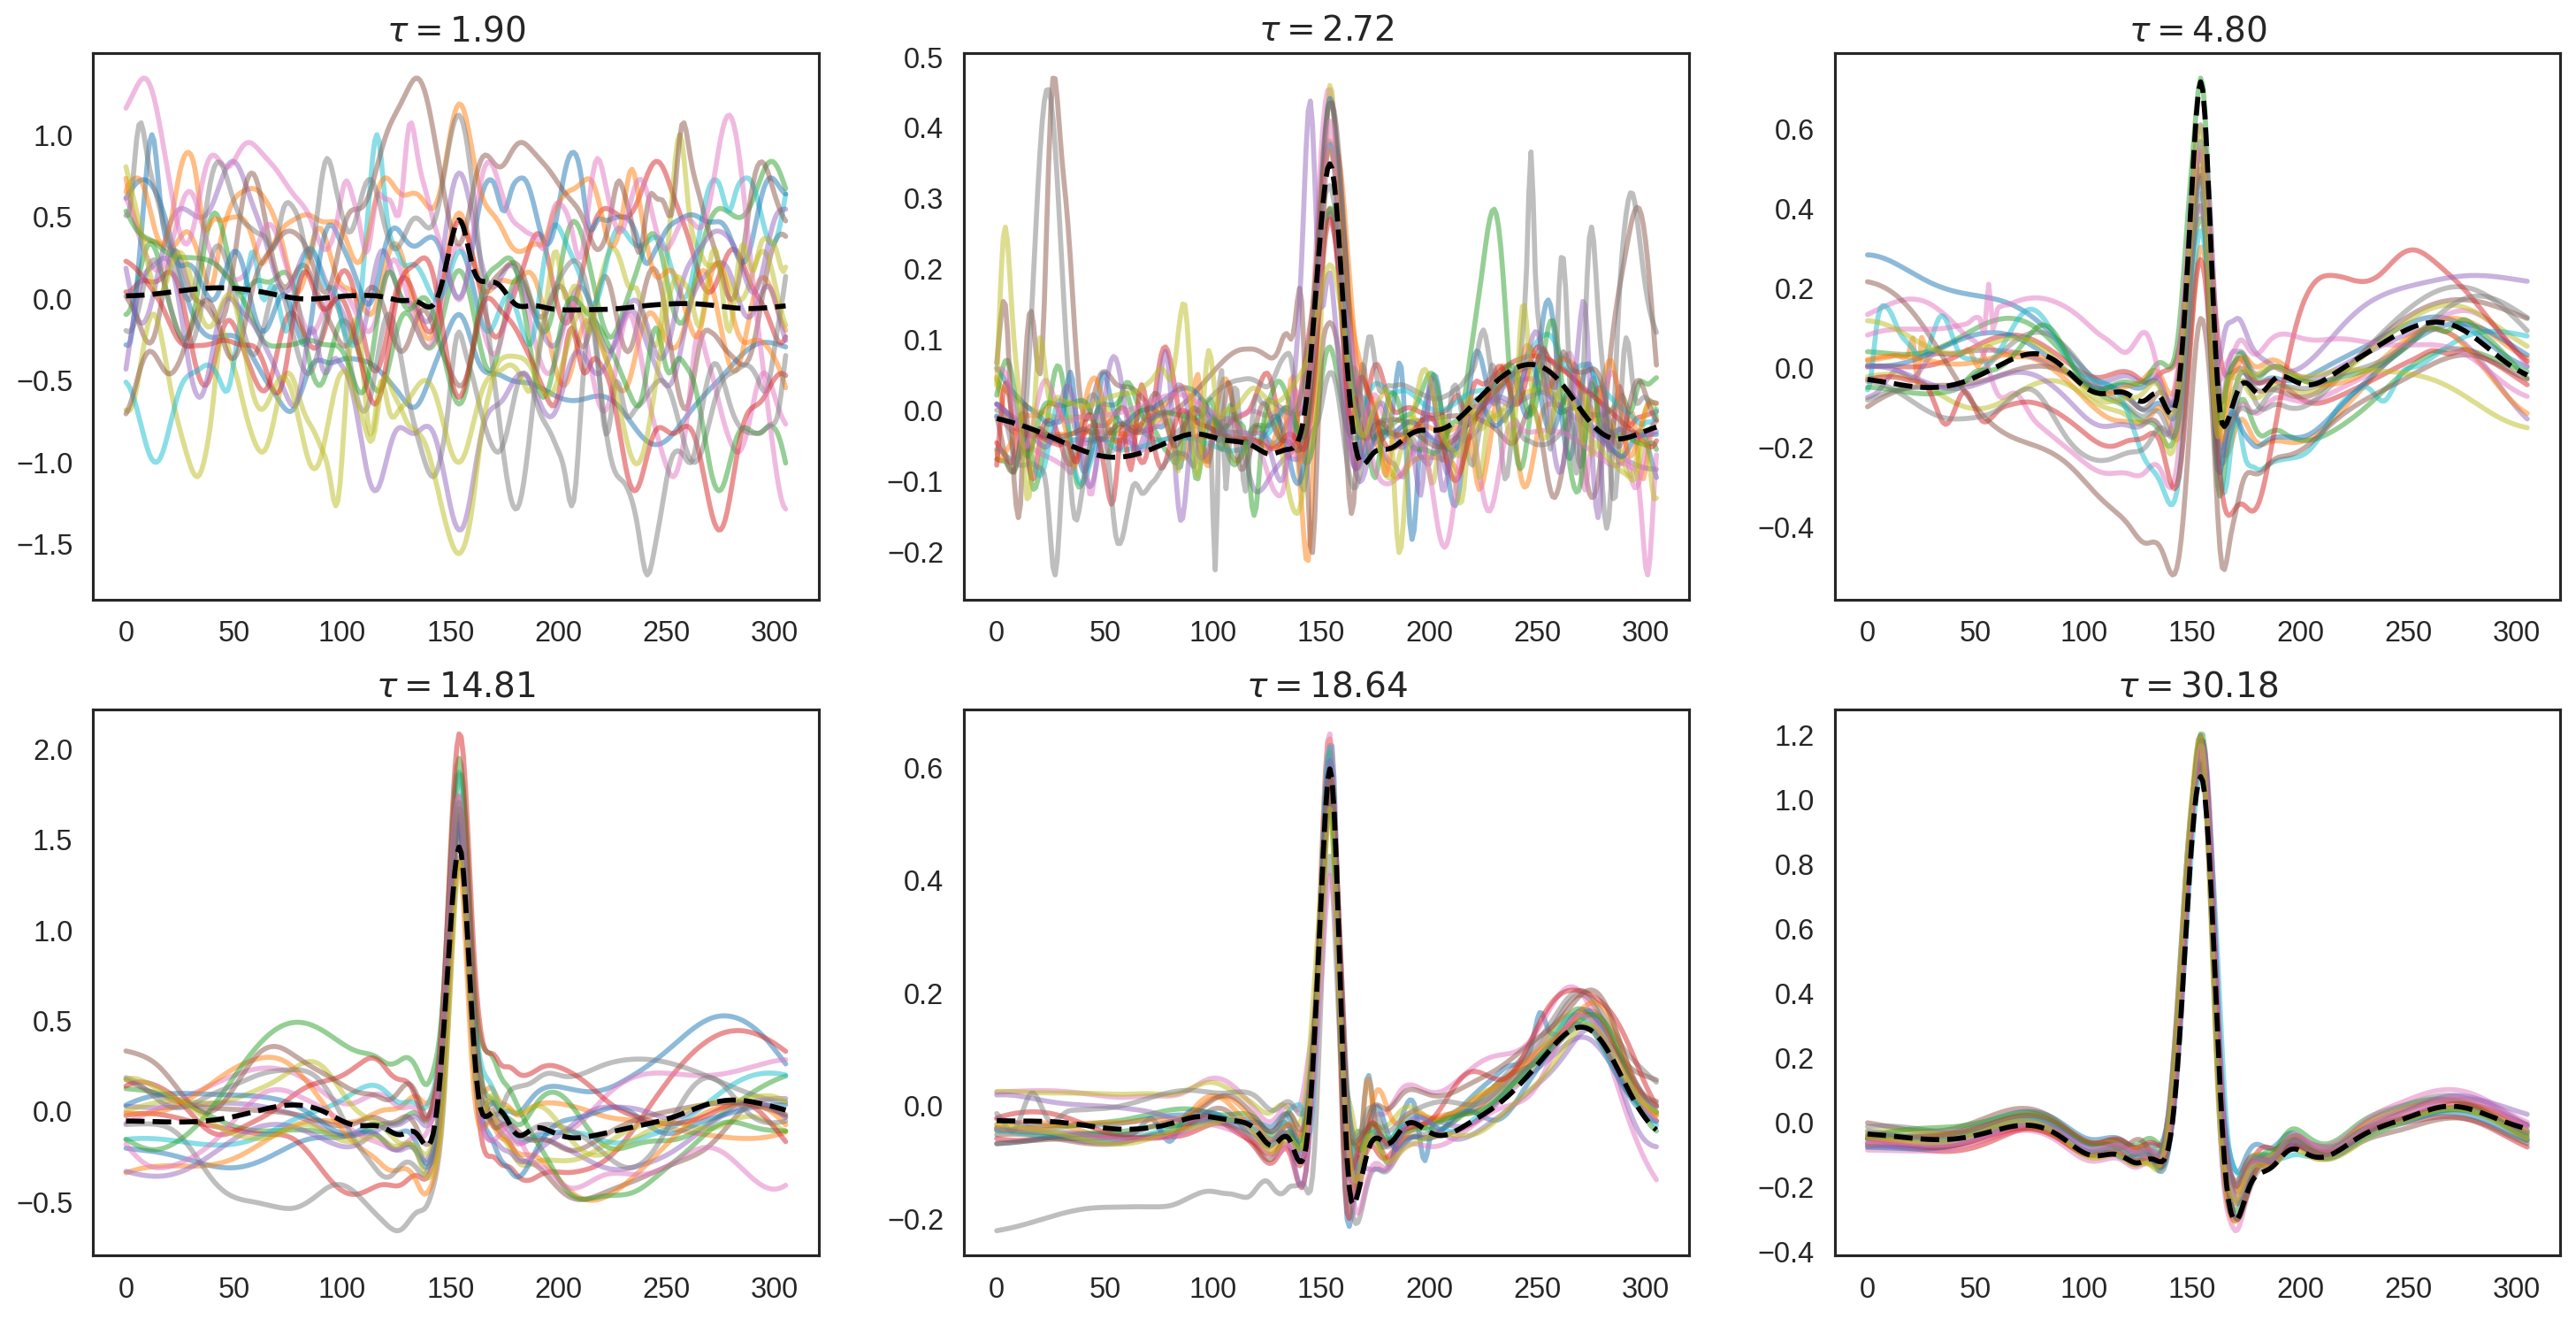
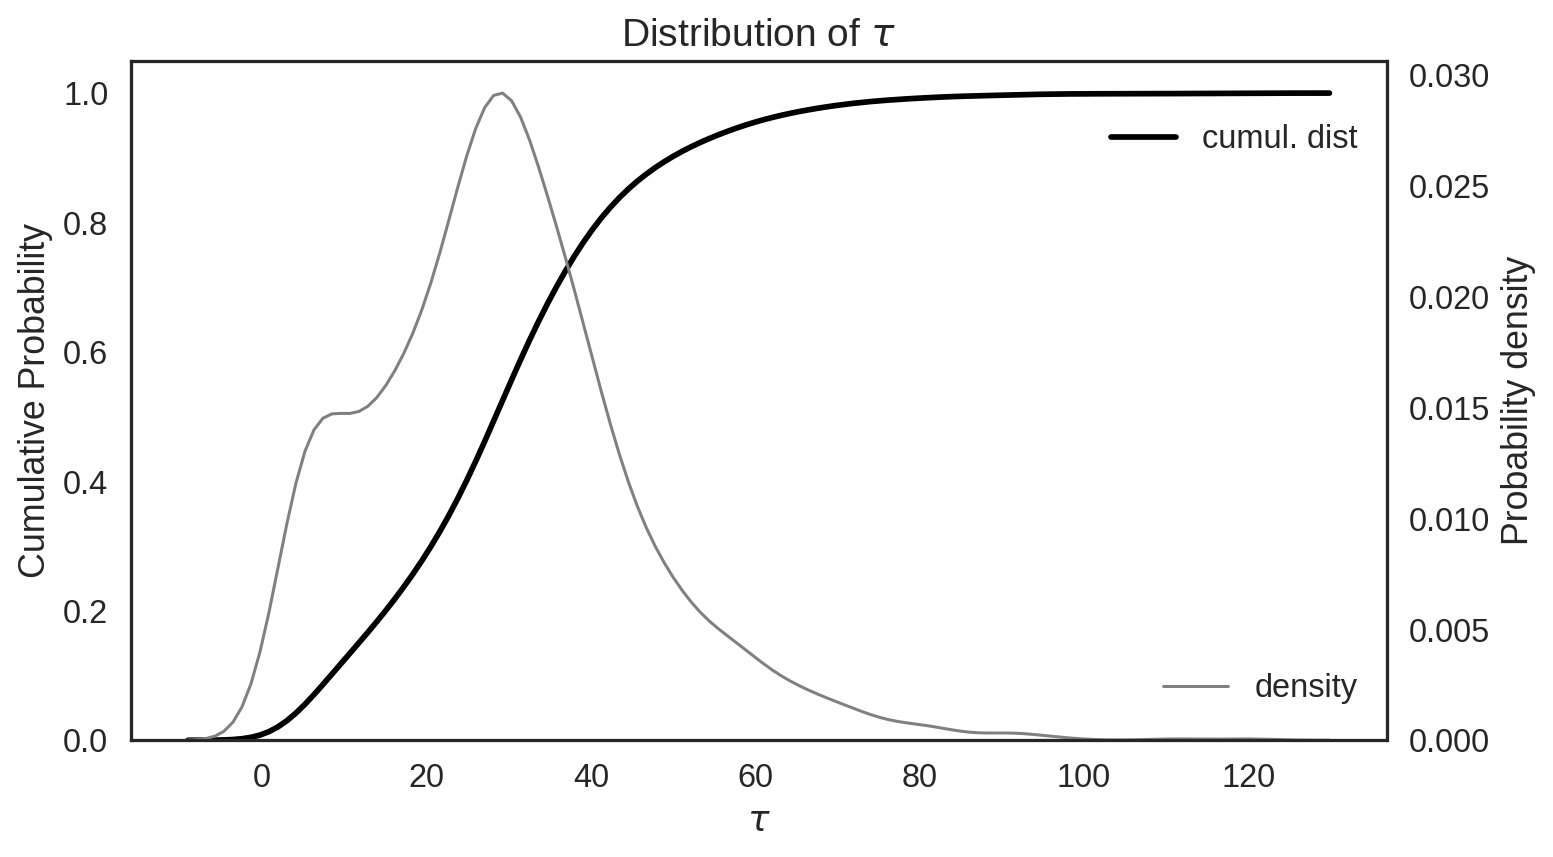
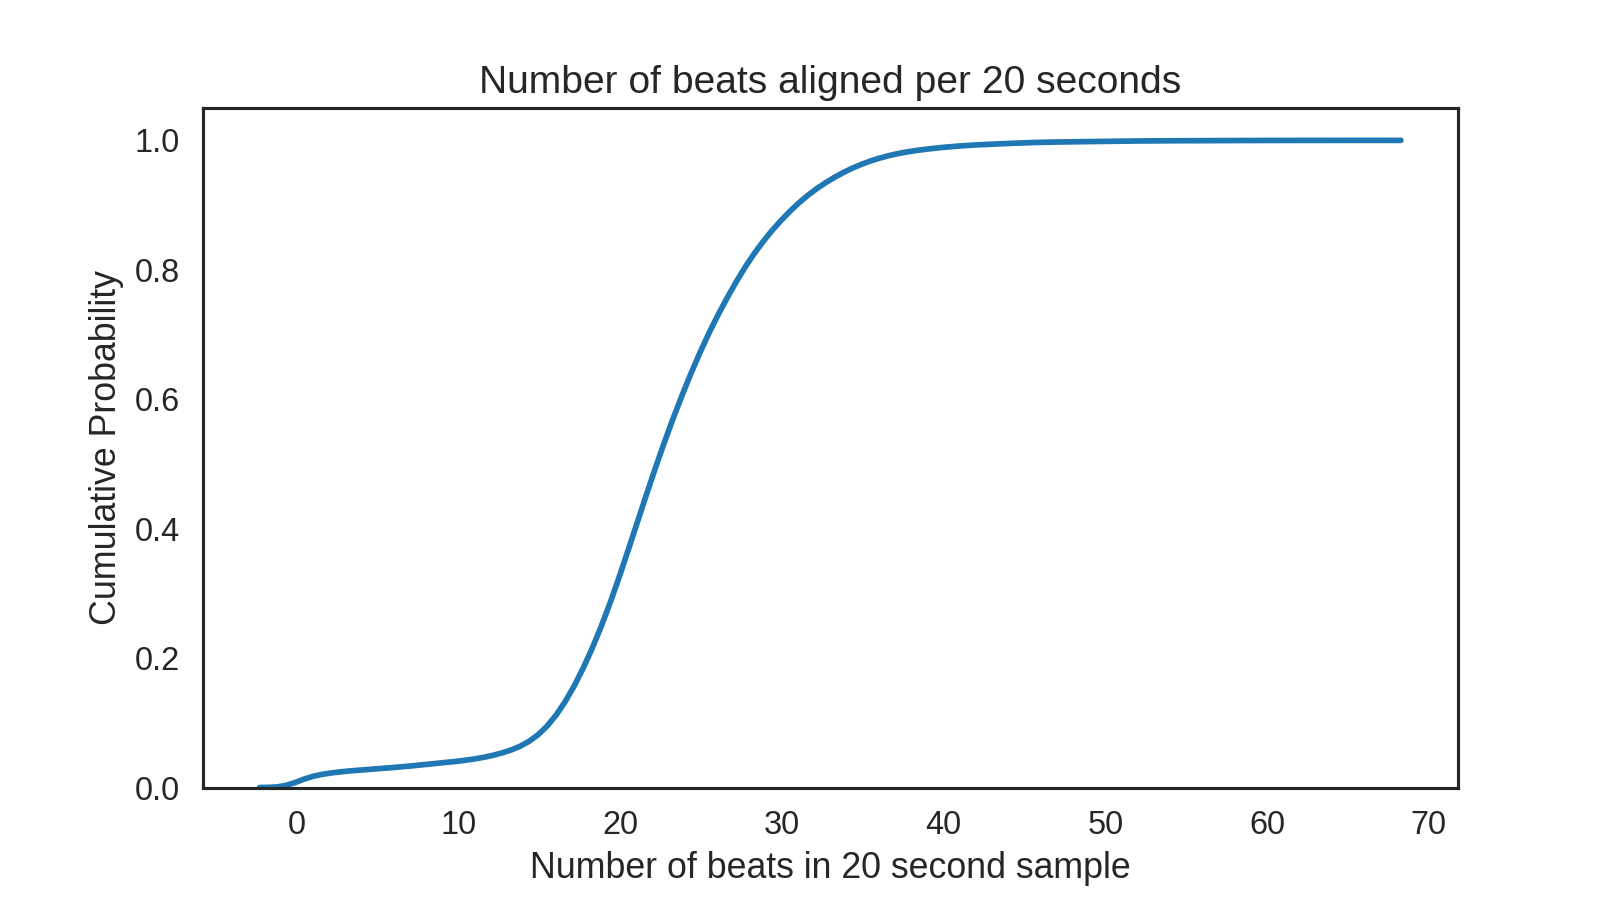
Figure 3: Left: example ECG reconstruction from ECG traces with varying noise levels τ. The color traces are aligned individual beats, and the dotted line is the factor analysis-reconstructed ECG trace. Top right: distribution of noise level τ in a subset of study observed ECGs. Bottom right: the distribution of the number of beats observed in each recording.
We find that relative estimator performance depends on noise amplitude. In the low noise setting, τ = 20 with B = 15 or B = 20 beats, it is difficult to outperform the sample average. However, as noise increases, to τ = 2, the factor analysis and nonlinear models significantly outperform the sample average. While the VAE tends to outperform linear models in the single beat setting, we find that the factor analysis models tend to do better in the multi-beat setting. Figure 2 compares estimator error when τ varies uniformly between 2 and 20 and B = 20; additional results are detailed in Appendix D.
Ahms Data
The Apple Heart and Movement Study (AHMS) aims to develop better insight into what factors affect heart health over time. Through the Apple Research app, the study collects data from the Apple Watch and iPhone, including ECGs and other mobility signals related to cardiovascular health.3 In Figure 3 we show a few representative plots of what our factor analysis approach recovers for participant ECGs of varying noise levels. Also, we plot the distribution of ECGs that could be delineated cleanly. For simplicity, we remove any ECG samples with less than 20 delineated beats.
Among those that passed this delineation filter, we plot the distribution of a subset of ECG noise levels, and find that about 80% of records have a τ > 18 and over 50% have a τ > 30. As τ > 18 is relatively low noise (see Figure 3a) this indicates that a simple average may suffice for the majority of observations, and a model-based estimate could be used for the remainder. Note that the delineation step will under-sample noisier records, which motivates a more robust method for alignment.
Discussion
Modeling variation in an ECG waveform is a challenging problem. ECGs combine a mixture of physiological structure and nuisance variation that are difficult to disentangle. We proposed a simple method for representing and denoising a set of ECGs with varying noise-levels. In a simulation study, we find that in some noise regimes, this approach can be more accurate than simple averaging and competitive with more complex non-linear representation learning methods. In this work, we do not address rhythmic variation (e.g., heart rate variability) or physiological beat-to-beat variation in ECG morphology (e.g., T wave alternans). Approaches to disentangle beat-to-beat artifacts from beat-to-beat physiology require additional structural assumptions and methodology, which is an important avenue for continued research.
3Information from the Apple Research app is shared with the study only after participants have signed the study informed consent form, and authorized the study to collect or access information in the Apple Research app. Participant information is encrypted when transferred to and stored on Apple’s servers. Apple is not able to is collected through the Apple Research app. AHMS was approved by Advarra Institutional Review Board.
Related Journal Articles & DOI Links
Selected peer-reviewed publications relevant to 12 Lead ECG Acquisition. Click the DOI to access the full paper (may require institutional access).
-
1. Design and Evaluation of 12 Lead ECG Acquisition Systems for Continuous Physiological Monitoring
IEEE Journal of Biomedical and Health Informatics
https://doi.org/10.1109/JBHI.2020.2981234 -
2. Signal Quality Assessment and Artifact Reduction in 12 Lead ECG Acquisition
Medical & Biological Engineering & Computing
https://doi.org/10.1007/s11517-020-02145-6 -
3. Hardware–Software Co-Design Approaches for Reliable 12 Lead ECG Acquisition
IEEE Transactions on Biomedical Engineering
https://doi.org/10.1109/TBME.2019.2895762 -
4. Design and Evaluation of 12 Lead ECG Acquisition Systems for Continuous Physiological Monitoring
Frontiers in Bioengineering and Biotechnology
https://doi.org/10.3389/fbioe.2020.00123 -
5. Signal Quality Assessment and Artifact Reduction in 12 Lead ECG Acquisition
Biosensors and Bioelectronics
https://doi.org/10.1016/j.bios.2021.112345 -
6. Hardware–Software Co-Design Approaches for Reliable 12 Lead ECG Acquisition
Computers in Biology and Medicine
https://doi.org/10.1016/j.compbiomed.2021.104567 -
7. Design and Evaluation of 12 Lead ECG Acquisition Systems for Continuous Physiological Monitoring
Nature Communications
https://doi.org/10.1038/s41467-020-12345-6
Why Choose Us?
Bangalore guidance for robotics, Spectre and autonomous systems projects.
Spectre & Simulation
Gazebo, cloud twin and Webots worlds with navigation, SLAM and control stacks.
Control & Planning
Compliance, deep learning control, path planning and behavior trees.
Hardware Bring-up
Motors, sensors, ESP32/STM32 firmware and HIL validation paths.
Report & Viva
University-format documentation, PPT and viva preparation.
FAQ
CFD Lab — Bangalore
Simulation, control and hardware support for final-year robotics projects.
Stacks
Worlds
Digital Twin
Control
Robots
Offline
Bring-up