RADx Data Hub: A Cloud Platform for FAIR, Harmonized
Covid-19 Data
Marcos Martinez-Romero1*, Matthew Horridge1, Nilesh Mistry2, Aubrie Weyhmiller3, Jimmy K. Yu1, Alissa Fujimoto2, Aria Henry3, Martin J. O’Connor1, Ashley Sier2, Stephanie Suber3, Mete U. Akdogan1, Yan Cao1, Somu Valliappan2, Joanna O. Mieczkowska3, Ashok Krishnamurthy3, Michael A. Keller2, Mark A. Musen1 & the RADx Data Hub team
Abstract
Background: The COVID-19 pandemic exposed significant limitations in existing data infrastructure, particularly the lack of systems for rapidly collecting, integrating, and analyzing data to support public health responses. Disparate and non-interoperable data systems led to delays in conducting comprehensive analyses and making timely decisions.
Objective: To overcome these challenges, the U.S. National Institutes of Health (NIH) launched the Rapid Acceleration of Diagnostics (RADx) initiative, with the RADx Data Hub serving as a centralized platform for de-identified and curated COVID-19 data. The objective of this paper is to present an overview of the RADx Data Hub’s architecture, data management processes, and capabilities.
Methods: The RADx Data Hub was developed on a scalable cloud infrastructure designed to comply with the FAIR (Findable, Accessible, Interoperable, Reusable) principles. The Hub integrates various data types, including clinical data, testing results, and social determinants of health, using metadata standards, interoperable formats, and ontology-based tools. It adopts a pipeline for data collection, harmonization, and validation, involving automated and manual quality checks to ensure data integrity.
Results: The RADx Data Hub hosts 178 studies across four RADx programs, including contributions from over 100 research organizations across 46 U.S. states and territories. The platform supports data discovery, access, and analysis through tools such as the Study Explorer and Analytics Workbench. These features enable researchers to conduct cross-study analyses and integrate diverse data sources.
Conclusions: The RADx Data Hub successfully addresses key data integration challenges by providing a centralized, FAIR-compliant platform for public health research. Its adaptable architecture and data management practices are designed to support secondary analyses and can be repurposed for other scientific disciplines, enhancing preparedness for future health crises.
Keywords: COVID-19 surveillance; Public health data infrastructure; Data harmonization and integration; Health disparities; FAIR data sharing; Cloud-based data platform; Pandemic response informatics; Secondary data analysis; Metadata standards; Digital health research.
Introduction
The COVID-19 pandemic exposed significant shortcomings in the infrastructure required to collect, integrate, and analyze data effectively for public health responses . The absence of standardized data and metadata, coupled with the lack of an accessible centralized platform, presented substantial barriers to informed decision-making and interdisciplinary collaboration . In response, the National Institutes of Health (NIH) launched the Rapid Acceleration of Diagnostics (RADx) initiative in 2020 , with a key objective to develop such a centralized platform—the RADx Data Hub . This platform aims to aggregate, harmonize, and provide access to data generated by various programs in the overall RADx initiative, enabling data reuse for secondary analyses and facilitating cross-study comparisons. The Data Hub supports innovative research into diagnostic tools, implementation strategies, and health disparities, particularly for underserved populations.
At the core of the RADx Data Hub (hereafter referred to as the Data Hub) is a cloud-based repository grounded in the FAIR (Findable, Accessible, Interoperable, Reusable) guiding principles for data sharing . The machinery and the specifications of the Data Hub are designed to make data (1) findable, through curation, annotation, and support for advanced search and data exploration; (2) accessible, through established privacy and security protocols meant to protect sensitive data while supporting data reuse; (3) interoperable, by leveraging semantic technologies and by defining standard data and metadata models for Data Hub entities; and (4) reusable, by developing routines to validate data quality, techniques to harmonize heterogeneous data, and cloud-based infrastructure to support integrated data analysis on sensitive data.
While the Data Hub was developed specifically to host COVID-19 studies, its underlying technologies were intentionally designed to be repurposed for other domains. The architecture, data and metadata models, software components, and protocols provide a reusable framework that can be adapted to support new systems addressing other scientific research domains. This paper presents the Data Hub as a key resource for secondary analysis of COVID-19 data and details the data management techniques and software tools developed to bring it to fruition as a reliable and accessible data platform.
Methods
The Data Hub’s approach to supporting data reusability and interoperability is built upon four key components: (1) a structured model organizing study data, metadata, and documentation, (2) an end-to-end pipeline for data collection and analysis, (3) a scalable, cloud-based system architecture, and (4) a comprehensive data and metadata harmonization framework. These components are complemented by rigorous data de-identification measures to ensure compliance with established privacy standards, resulting in a flexible foundation that can be adapted for use beyond the COVID-19 context to support a wide range of scientific research domains. The following subsections detail each component and illustrate how they interconnect to form a cohesive, FAIR-compliant infrastructure for scientific data collection, harmonization, and analysis.
A Model To Organize Study Information
The Data Hub sources its data from four RADx programs: RADx Radical (RADx-rad), RADx Underserved Populations (RADx-UP), RADx Technology (RADx-Tech), and RADx Digital Health Technologies (RADx-DHT) . These programs fund investigators that contribute study information through program-specific Coordination and Data Collection Centers (C)DCCs,1 each with a distinct mission. RADx-UP, the largest contributor, focuses on health disparities and
From Underserved Populations. Radx-Rad Explores
experimental (radical) technologies for non-traditional COVID-19 detection and surveillance settings. RADx-Tech supports the development and validation of diagnostic technologies. RADx-DHT generates digital health data from wearable devices, mobile apps, and real-time monitoring platforms. Collectively, the Data Hub integrates diverse research efforts, enabling comprehensive analyses through harmonized study data.
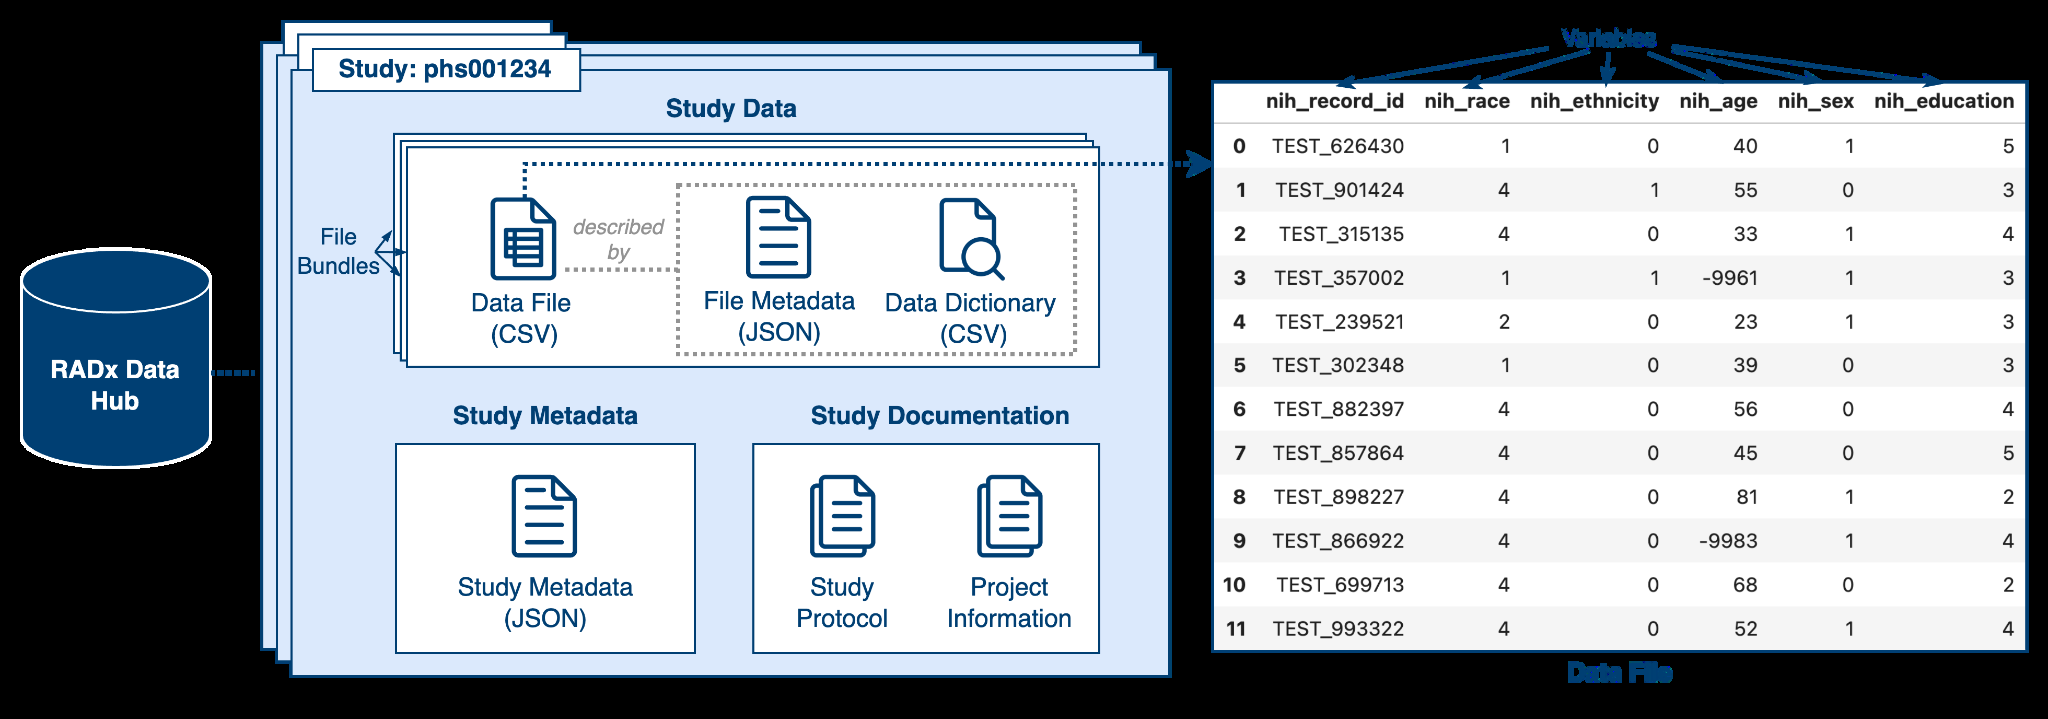
The Data Hub stores information for each study, categorized into three overarching components: study data, study metadata, and study documentation (Figure 1). Study data constitute the core outputs of each study, capturing the essential variables and results generated during research activities. Study data are organized into one or several file bundles, each comprising three main components: data file, data dictionary, and file metadata: ● Data file. A tabular Comma-Separated Values (CSV) document structured according to its corresponding data dictionary. Variables, defined in the data dictionary, represent measurable attributes or characteristics (e.g., age, sex, education) and are organized as columns in the data file. Each row corresponds to a data point, such as an experimental sample or study participant, with values recorded for one or more variables. A data dictionary is essential for interpreting the values in the data file.
1 The RADx-UP program includes a coordination function, whereas RADx-rad, RADx-Tech, and RADx-DHT focus solely on data collection. The abbreviation (C)DCCs is used to collectively refer to all of them. ● Data dictionary. A CSV document in which each row unambiguously describes the specification of a variable measured or collected by a study or experiment. The columns of the data dictionary provide identifiers for a variable, including properties such as the variable name, label, units of measurement, datatype, and other attributes relevant to specifying a variable’s values. The complete specification of data dictionaries used by the Data Hub can be found in the Data Hub Data Dictionary Specification . Data dictionaries are automatically validated against the data dictionary specification upon data submission, and compliance with the specification is strictly enforced. As a result, data dictionaries (and variable metadata, by extension) are amenable to uniform machine processing according to the specification.
● File metadata. Each data file is paired with a metadata file that describes its key characteristics, including versioning information, creator details, and summary statistics. Figure 1. Components of Data Hub Studies. This figure illustrates the organization of study information within the Data Hub. Study data (left) are organized into one or more file bundles. Each bundle contains a data file, file metadata, and a data dictionary. Additionally, studies are accompanied by study metadata and documentation. An example data file (right) demonstrates the structure of collected variables, including sample values.
Each study is also paired with a study metadata file, offering a comprehensive view of its scope, goals, and content. Study metadata includes details such as the study’s geographic and demographic focus, methodologies employed, key outcomes, funding sources, and contributing institutions. By providing a consolidated overview, study metadata facilitates the identification and evaluation of studies that are relevant to specific research questions, while enabling systematic reviews and meta-analyses.
In addition, each study is accompanied by study documentation that describes the design and execution processes. The study documentation includes study protocols, project summaries, manual of operations (MOP), and data-collection instruments. By capturing this rich contextual information, the study documentation helps end users understand the study and use the resulting data effectively. Additionally, it offers critical insights into the rationale behind the study design, the measures taken to maintain data quality, and the study’s adherence to regulatory and ethical standards, thereby building trust in the data and facilitating responsible data reuse.
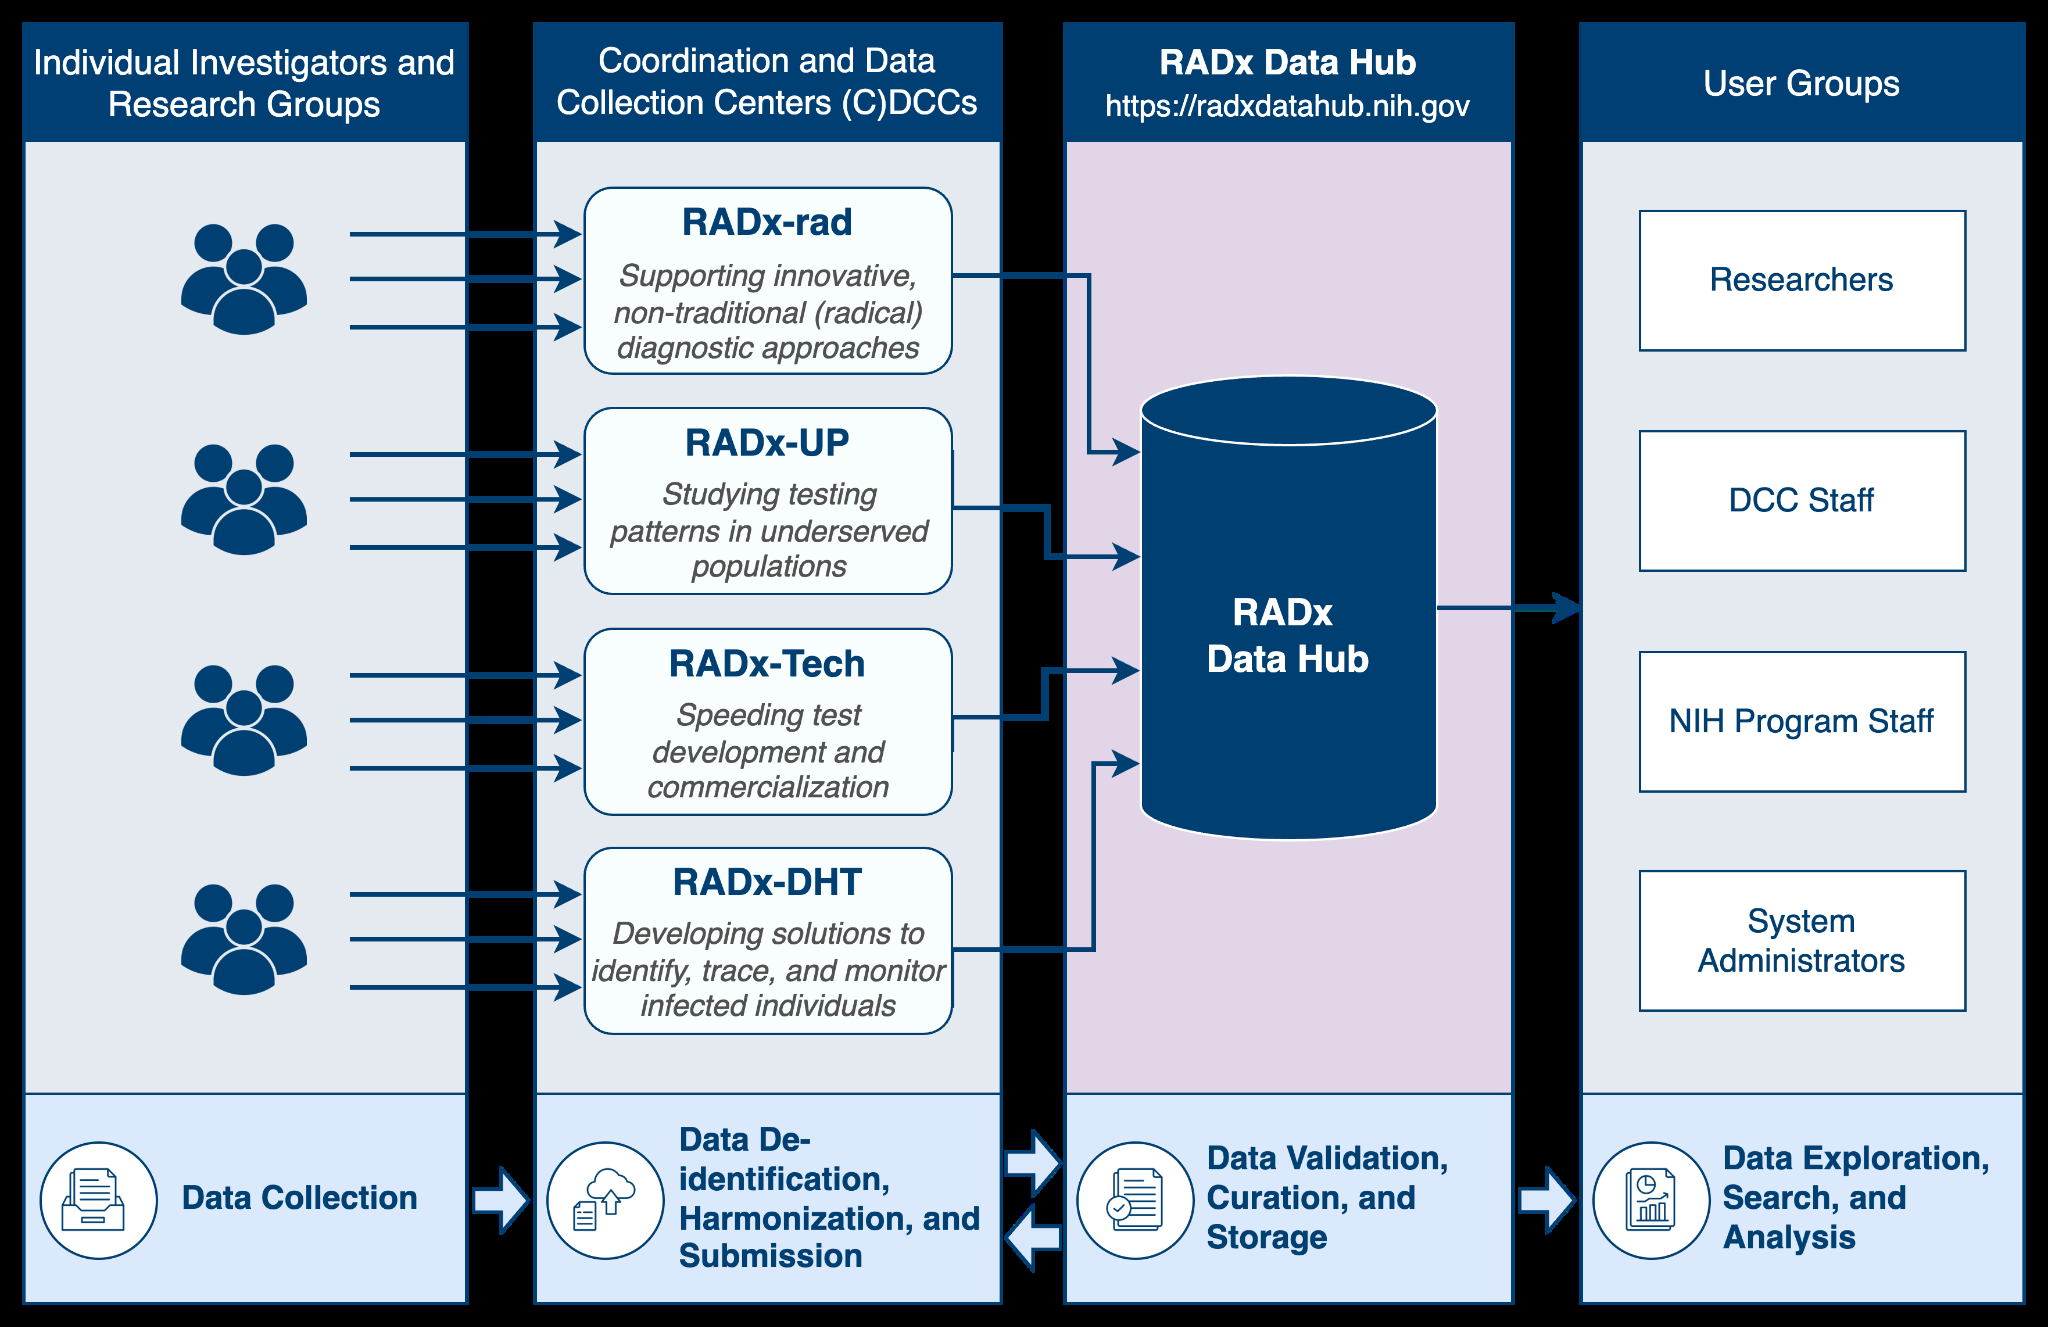
An End-to-End Pipeline for Data Collection and Analysis Data Hub’s end-to-end pipeline (Figure 2) streamlines collection, de-identification, harmonization, validation, curation, storage, and analysis of the data. Data producers, including individual study investigators and research groups, transmit their study data to one of the four (C)DCCs. These (C)DCCs, each aligned with a specific focus within the RADx initiative, play a critical role in the pipeline by standardizing, harmonizing, and preparing the data for inclusion in the Data Hub.
Figure 2. Overview of Data Hub’s end-to-end data pipeline. Individual investigators and research groups collect and transmit data to the appropriate Coordination and Data Collection Center (C)DCC. At the (C)DCCs, staff de-identify, harmonize, and submit the study data to the Data Hub. Any identified issues are communicated to data contributors, creating a feedback loop for iterative improvements and alignment with Data Hub standards. Once validated, the data are approved, curated, stored in the Data Hub, and then made accessible to users.
After submission to the Data Hub, the data undergo automated validation to detect quality issues, such as non-adherence to standards, incorrect formats, or incomplete metadata. Additionally, the validation process includes automated detection of potential Protected Health Information (PHI) and Personally Identifiable Information (PII) to ensure compliance with privacy and security regulations. These automated steps are followed by manual curation, enabling further refinement of the data. Once these processes are complete, the data are stored and made accessible to users.
A Fair Pipeline Using Cedar And Bioportal
The Data Hub leverages the CEDAR Workbench and the BioPortal ontology repository as foundational tools for metadata management and interoperability. CEDAR (Center for Expanded Data Annotation and Retrieval) is a suite of web-based tools designed to streamline the creation and management of high-quality metadata. At the core of CEDAR is the concept of metadata templates—structured forms that define the attributes and constraints necessary to describe specific types of data consistently. Templates incorporate controlled vocabularies, specifying permissible values for fields such as demographic characteristics, experimental conditions, and data collection methodologies. Researchers and data contributors use these templates to annotate data with standardized, machine-readable metadata, ensuring adherence to community standards and improving data FAIRness .
CEDAR uses the BioPortal ontology repository to integrate ontology terms into metadata templates, ensuring fields are annotated with standardized, semantically rich vocabularies. BioPortal is a comprehensive repository that hosts a vast range of biomedical ontologies, providing standardized terms and definitions across diverse domains to support consistent semantic annotation of data. It provides access to over 1,000 ontologies when building CEDAR templates, enabling users to select standardized terms and definitions to describe study variables.
This integration helps ensure that metadata fields, such as “age group” or “diagnostic technology,” are annotated with consistent, widely recognized terms, promoting interoperability and reuse of the data across different domains and platforms.
By embedding CEDAR’s structured metadata templates and BioPortal’s rich vocabulary resources into its metadata workflow, the Data Hub provides a comprehensive framework for FAIR compliance. The following subsections detail how this framework was used to help ensure the findability, accessibility, interoperability, and reusability of RADx data.
Findability: Exploring And Searching Study Data
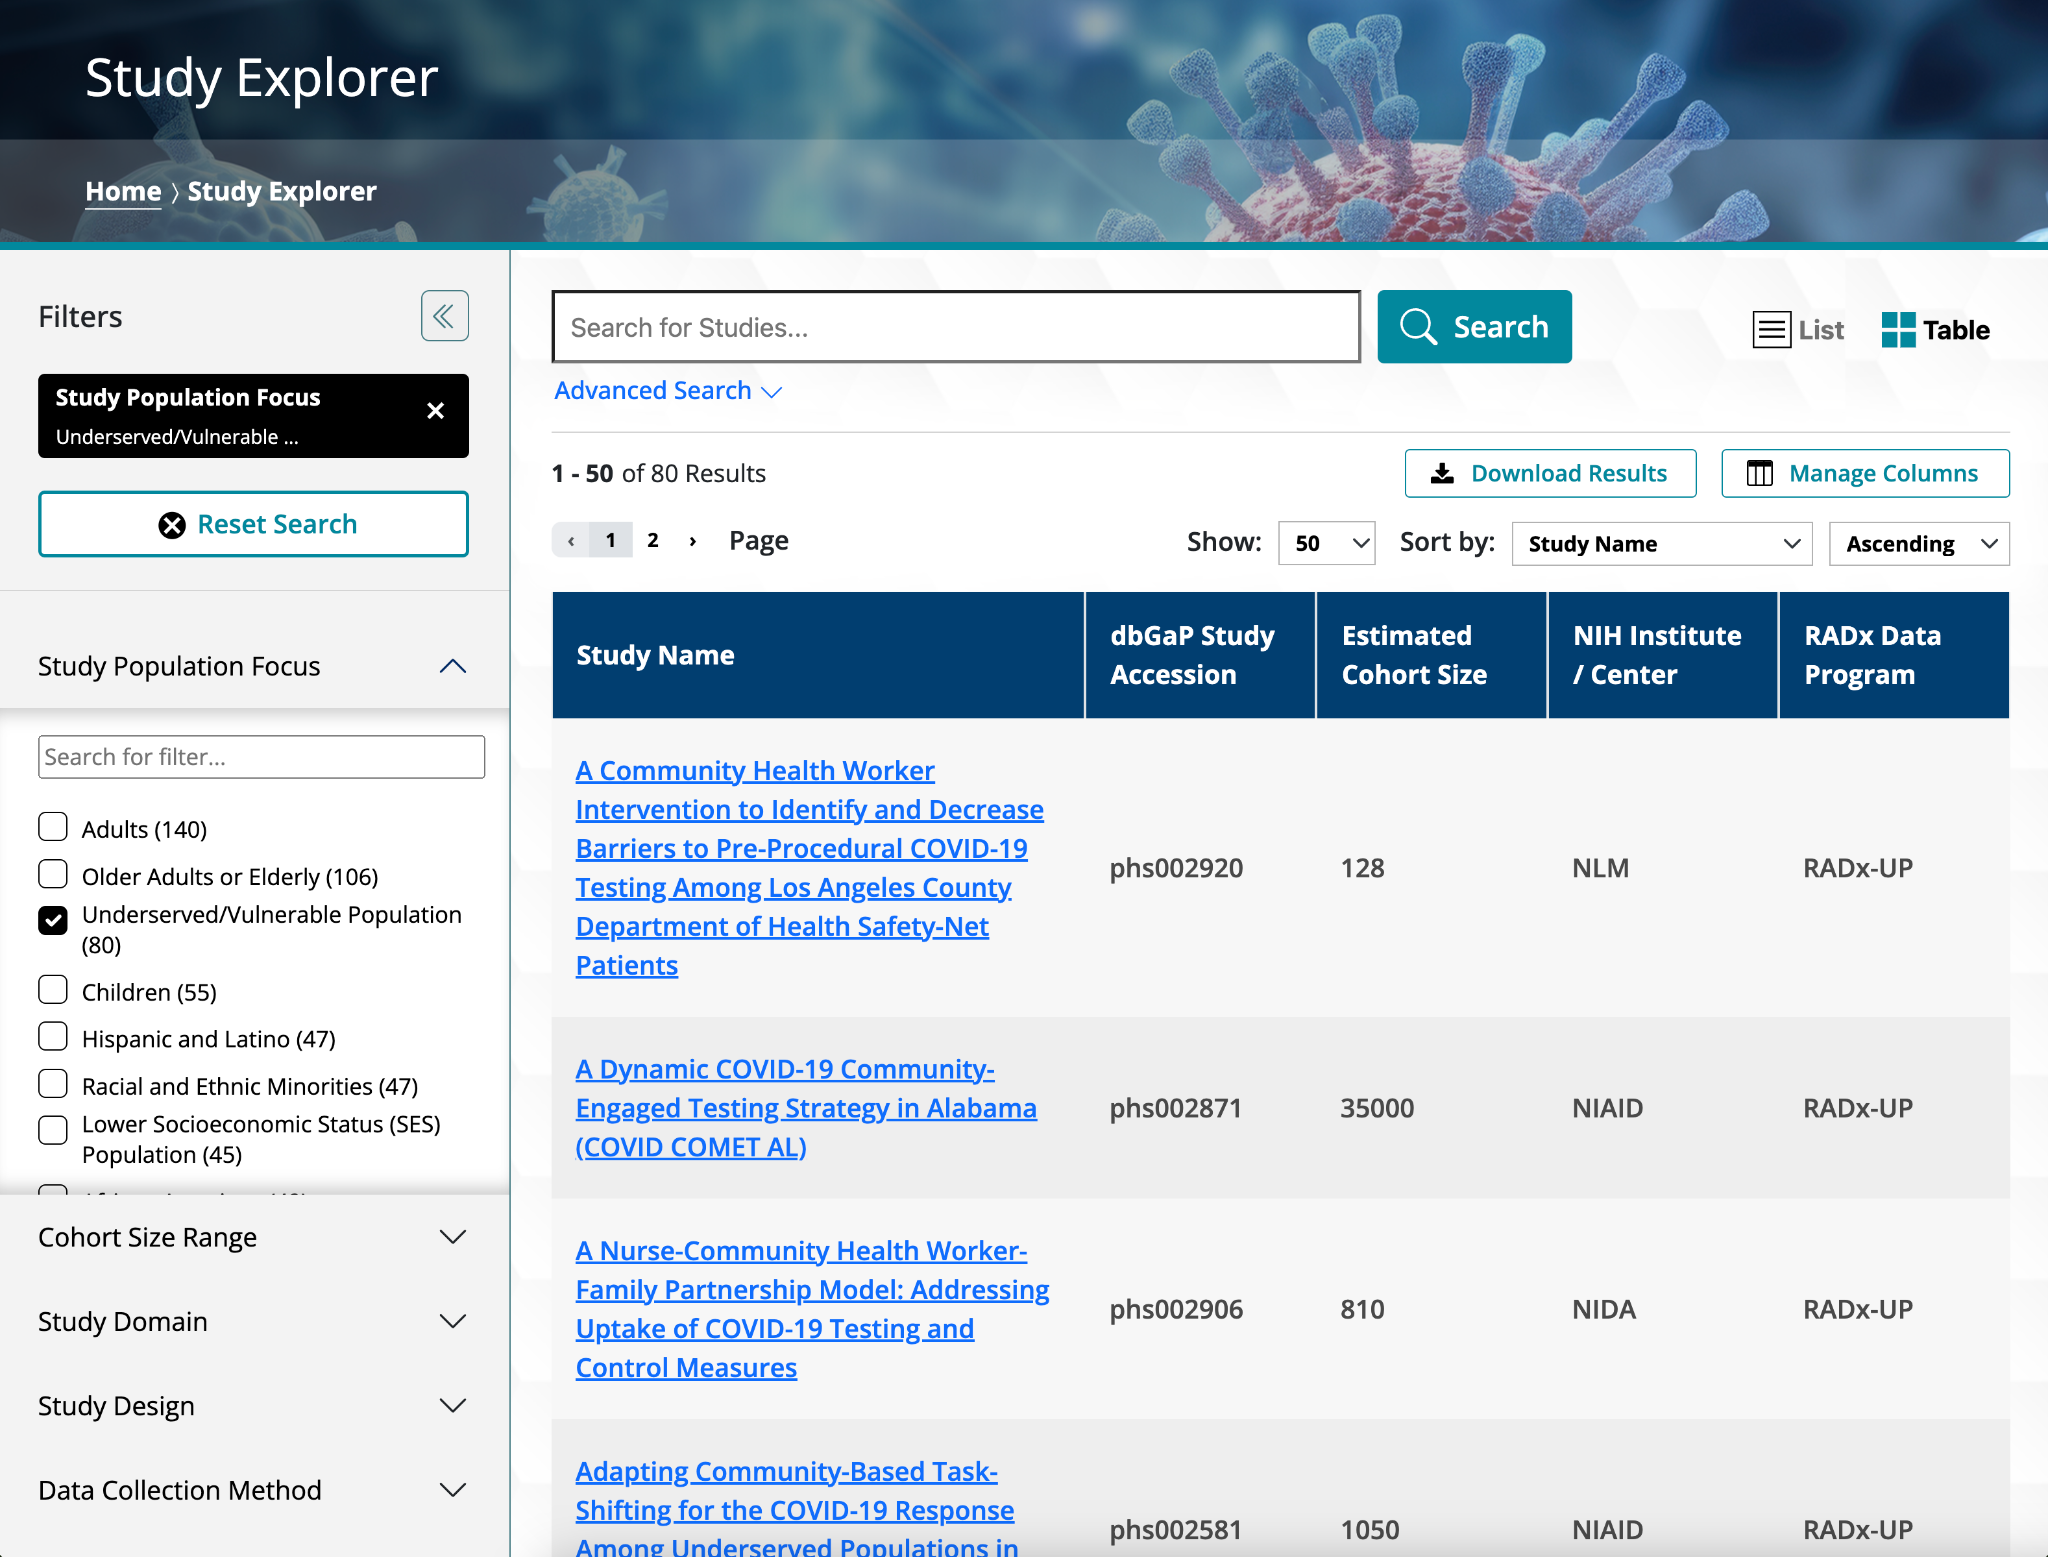
One of the primary purposes of the Data Hub is to provide a platform for researchers to find study data appropriate for their secondary analyses. While access to study data is governed by the NIH database of Genotypes and Phenotypes (dbGaP) and requires formal approval, the Study Explorer component of the Data Hub (Figure 3) is openly available. It allows users to browse the list of studies, explore their characteristics, and assess their suitability before submitting a data access request through dbGaP. The Study Explorer offers a range of search functionalities, including free-text search, conditional queries using multiple criteria, and options to sort, filter, and download results. Users can filter results using various facets, including study domain, sample size, and data collection method. Studies can also be located directly by querying for their title or other study attributes.
Figure 3. Study Explorer. The figure shows a screenshot of the Data Hub Study Explorer, with the “Study Population Focus” filter applied to retrieve 80 studies on underserved or vulnerable populations. A search box at the top, equipped with an autocomplete feature, allows users to quickly find studies by entering relevant keywords. The filtered results are displayed in a table, which includes information such as study names, dbGaP accessions, estimated cohort sizes, NIH institutes or centers sponsoring the study, and the RADx Data Program responsible for the study.
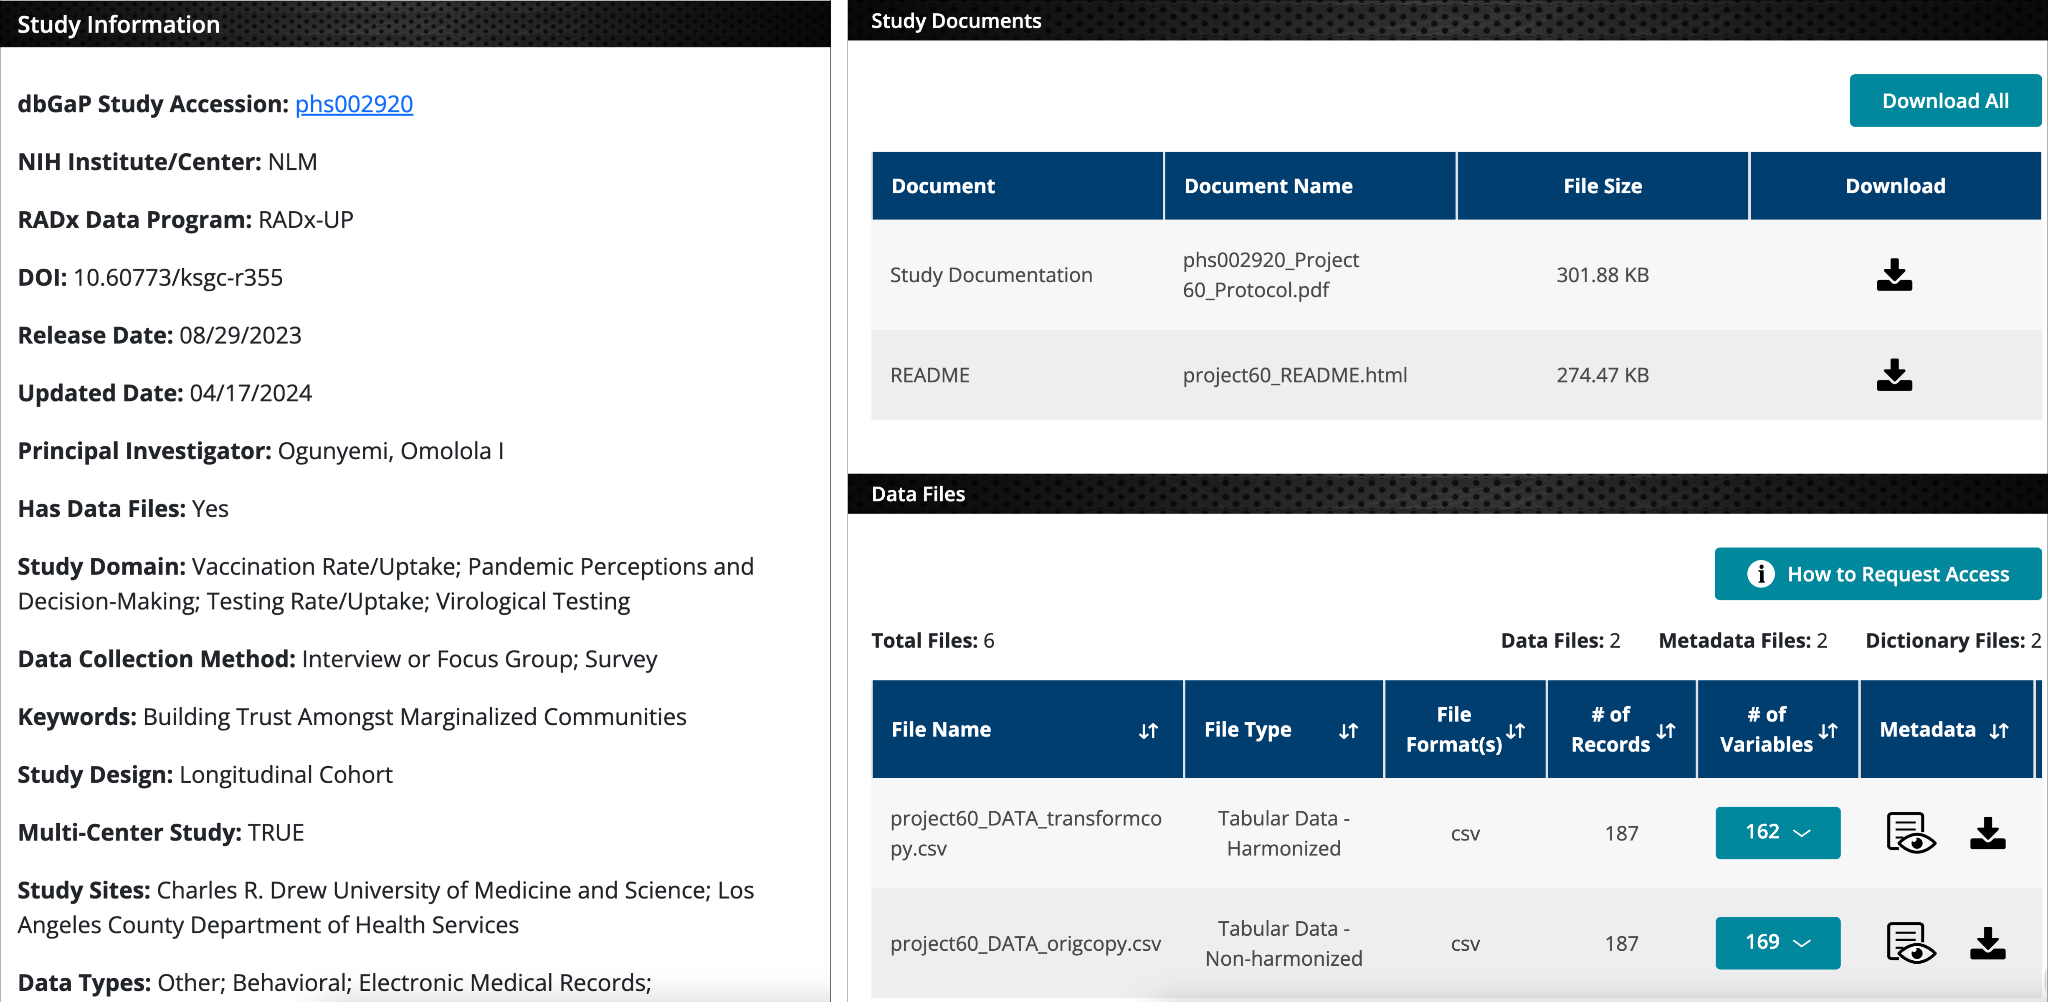
Upon locating a study of interest, users can view its details on the Study Overview page (Figure 4). This webpage provides a concise summary of the study, offering access to the key components: study metadata, documentation, and data files, including file metadata and data dictionaries. Study metadata can be downloaded in machine-readable formats, such as JSON and YAML, for easy integration into research workflows. To simplify metadata viewing, the Data Hub provides an interactive Metadata Viewer (Figure 5) powered by CEDAR’s Embeddable Editor , which includes links to ontology terms from the BioPortal ontology repository . This tool allows users to inspect all metadata associated with a study and to verify that the study aligns with their research goals. Additionally, the Study Overview page displays the variables used in each file, enabling researchers to identify variables relevant to their analyses or to search for related studies that share the same variables. Furthermore, each study on the Data Hub is assigned a unique DataCite Digital Object Identifier (DOI), a persistent string that provides a permanent reference, ensuring the study can be reliably located and accessed within the Data Hub.
Figure 4. Study Overview Page. This figure provides an overview of the information available for a selected study within the Data Hub. The panel at left summarizes key metadata, such as the dbGaP study accession, RADx Data Program, study domain, and data collection methods. The panel at right is divided into “Study Documents” and “Data Files.” The “Study Documents” section lists supporting files, such as study protocols and README files. The “Data Files” section contains the data files and their corresponding metadata, along with a button to request access to the data through the study’s dbGaP page.
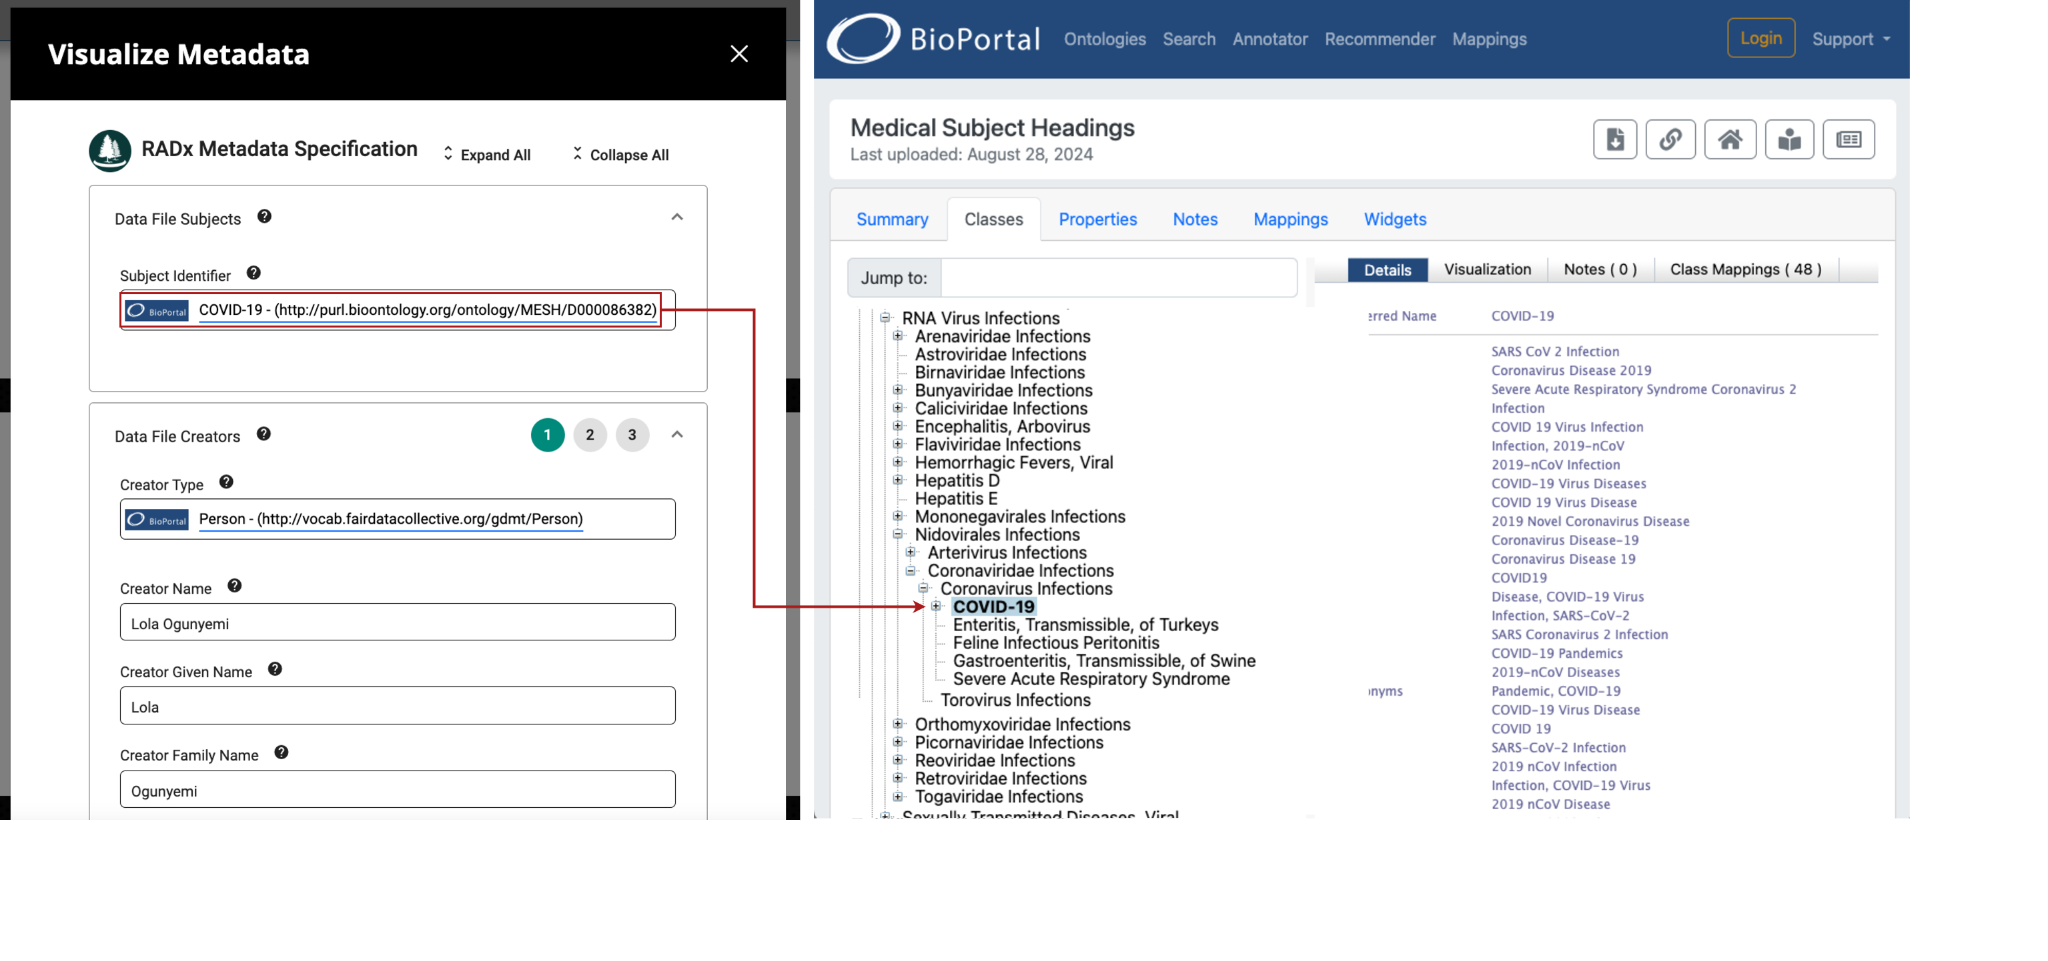
Figure 5. Metadata Viewer. The left side of the figure displays metadata for a specific data file, with terms constrained to ontology terms, linked to BioPortal for further exploration. The right side demonstrates a link from the “subject identifier” field to the corresponding term in the Medical Subject Headings (MeSH). Metadata are organized into expandable and collapsible sections for easy navigation, with “help” text providing guidance and context. The Metadata Viewer renders a CEDAR template designed for Data Hub files, ensuring consistency and accessibility across metadata records.
Accessibility: Ensuring Data Availability and Secure Access Protecting sensitive health-related data requires robust control mechanisms to ensure compliance with ethical standards, government regulations, and data use agreements. With the exception of RADx-DHT, whose data reside in the RAPIDS repository , all study data are stored in the Data Hub. Access to files from the Data Hub is reviewed and authorized by the NIH Data Access Committee (DAC) with an established Data Use Agreement through dbGaP . This agreement outlines specific terms for data usage, including requirements for privacy protections and ethical conduct. Additionally, users must follow the Data Hub User Code of Conduct , which sets standards for responsible data handling.
To formally request access to study-level data, users must log into the Data Hub using their electronic Research Administration (eRA) Commons or NIH credentials, locate the desired study, and submit an access request. This requirement ensures that only verified researchers and authorized personnel can access controlled datasets, in compliance with NIH security and data governance policies. While this login process may pose a barrier for new users, it helps protect sensitive research data and aligns with NIH’s data access standards. Any individual with Principal Investigator (PI) status can obtain an eRA Commons login and dbGaP authorization.
Once access is approved by the DAC, PIs can manage permissions for their team members via dbGaP. Tutorials on the data request process are available on the Data Hub Resource Center webpage to assist users with each step.
Study metadata, summary statistics, and documentation remain openly accessible through the Study Explorer and Study Overview pages. These resources allow users to evaluate the relevance of study data and variables before submitting a formal data access request, ensuring they can determine whether the available datasets align with their research needs without requiring authentication.
Interoperability: Enforcing Data and Metadata Standards The Data Hub establishes a foundation for interoperability by adopting globally recognized data formats and metadata standards, alongside a standardized set of NIH Common Data Elements (CDEs). CDEs are defined as combinations of standardized questions (variables) paired with an enumerated set of possible responses (values) that are “common” across multiple studies .
Variables in data files are mapped to these CDEs to ensure consistent (i.e., harmonized) interpretation across studies. The CDEs used in the Data Hub are defined in the Data Hub Global Codebook . This listing includes 133 core CDEs that provide a consistent framework for representing essential variables, such as demographic and participant health information, across all RADx studies. These CDEs are organized into 12 categories, including Race, Ethnicity, Age, Sex, Education, Domicile, Employment, Insurance Status, Disability Status, Medical History, Symptoms, and Health Status.
The Data Hub team is responsible for performing harmonization to these CDEs where possible by employing a harmonization methodology detailed in the “Data and Metadata Harmonization” section. Submitted studies, however, are not limited by these CDEs and may include additional variables collected by the original researchers.
Beyond the provision of CDEs, the Data Hub employs standardized file formats and metadata specifications to further enhance interoperability. Data files are provided in CSV format, organized in a consistent structure where variables are represented as columns and rows as individual data points. Data dictionaries follow the RADx Data Dictionary Specification , also in CSV format, ensuring uniform interpretation of variables. Metadata for data files and studies are formatted in JSON-LD, adhering to the CEDAR model specification . Additionally, study documentation is provided in standard formats, such as PDF and plain text, ensuring accessibility and compatibility for a wide range of users.
In practice, the (C)DCCs collaborate closely with the Data Hub team to ensure compliance with these global standards. The (C)DCCs conduct the initial harmonization, while the Data Hub team maintains the Global Codebook and performs additional post hoc harmonization as needed before studies are made publicly available. These efforts aim to enhance the interoperability of study data within the RADx ecosystem and with external data repositories and analytical platforms. This comprehensive standardization approach maximizes the data’s utility for research and public health applications.
Reusability: Prioritizing Data Quality and Enabling Secondary Data Analysis The Data Hub promotes study data reusability by focusing on two critical aspects: ensuring high data quality and providing an integrated platform for secondary data analysis.
Data Quality
To ensure study data utility and reliability, the Data Hub employs a rigorous quality assurance and quality control (QA/QC) process. This process begins with close collaboration between the Data Hub team and (C)DCC staff during data submission, ensuring adherence to the data and metadata standards for metadata files, data dictionaries, and documentation described in previous sections. QA/QC reviews are performed rigorously before data and metadata are made publicly findable, ensuring compliance with privacy policies, alignment with the Data Hub’s standards, and readiness for harmonization and secondary use.
A key aspect of this process involves evaluating file bundle completeness, identifying and addressing missing values, and standardizing metadata formats to ensure consistency across data files and studies. While the quality of the data reflects the efforts of the original data producers, the Data Hub enhances value by applying harmonization practices during ingestion and by documenting any data and metadata gaps or limitations. These enhancements improve transparency, facilitate cross-study comparisons, and make the data more reliable for downstream analyses.
Data Analytics Workbench
The Data Hub features a cloud-enabled platform called the Analytics Workbench as a key feature for promoting data reuse (Figure 6). This workbench is a versatile platform, powered by AWS SageMaker Studio technology, that enables users to download or transfer data, to create personalized workspaces, and to deploy advanced analytical tools. By leveraging this platform, researchers can securely access, manipulate, and analyze RADx data.
The workbench provides users standard data analysis tools such as RStudio, Python, and JupyterLab, all readily accessible without additional setup. Additionally, users can extend the platform’s capabilities by accessing add-ons such as Data Wrangler, a “no-code” solution for data transformation, analysis, and visualization, and SAS Viya Analytics Pro, a comprehensive cloud-hosted statistical environment for data access, transformation, analysis, visualization, and mapping. The workbench also supports integration with external platforms such as DockerHub and GitHub, enabling users to tailor their workflows to specific research needs.
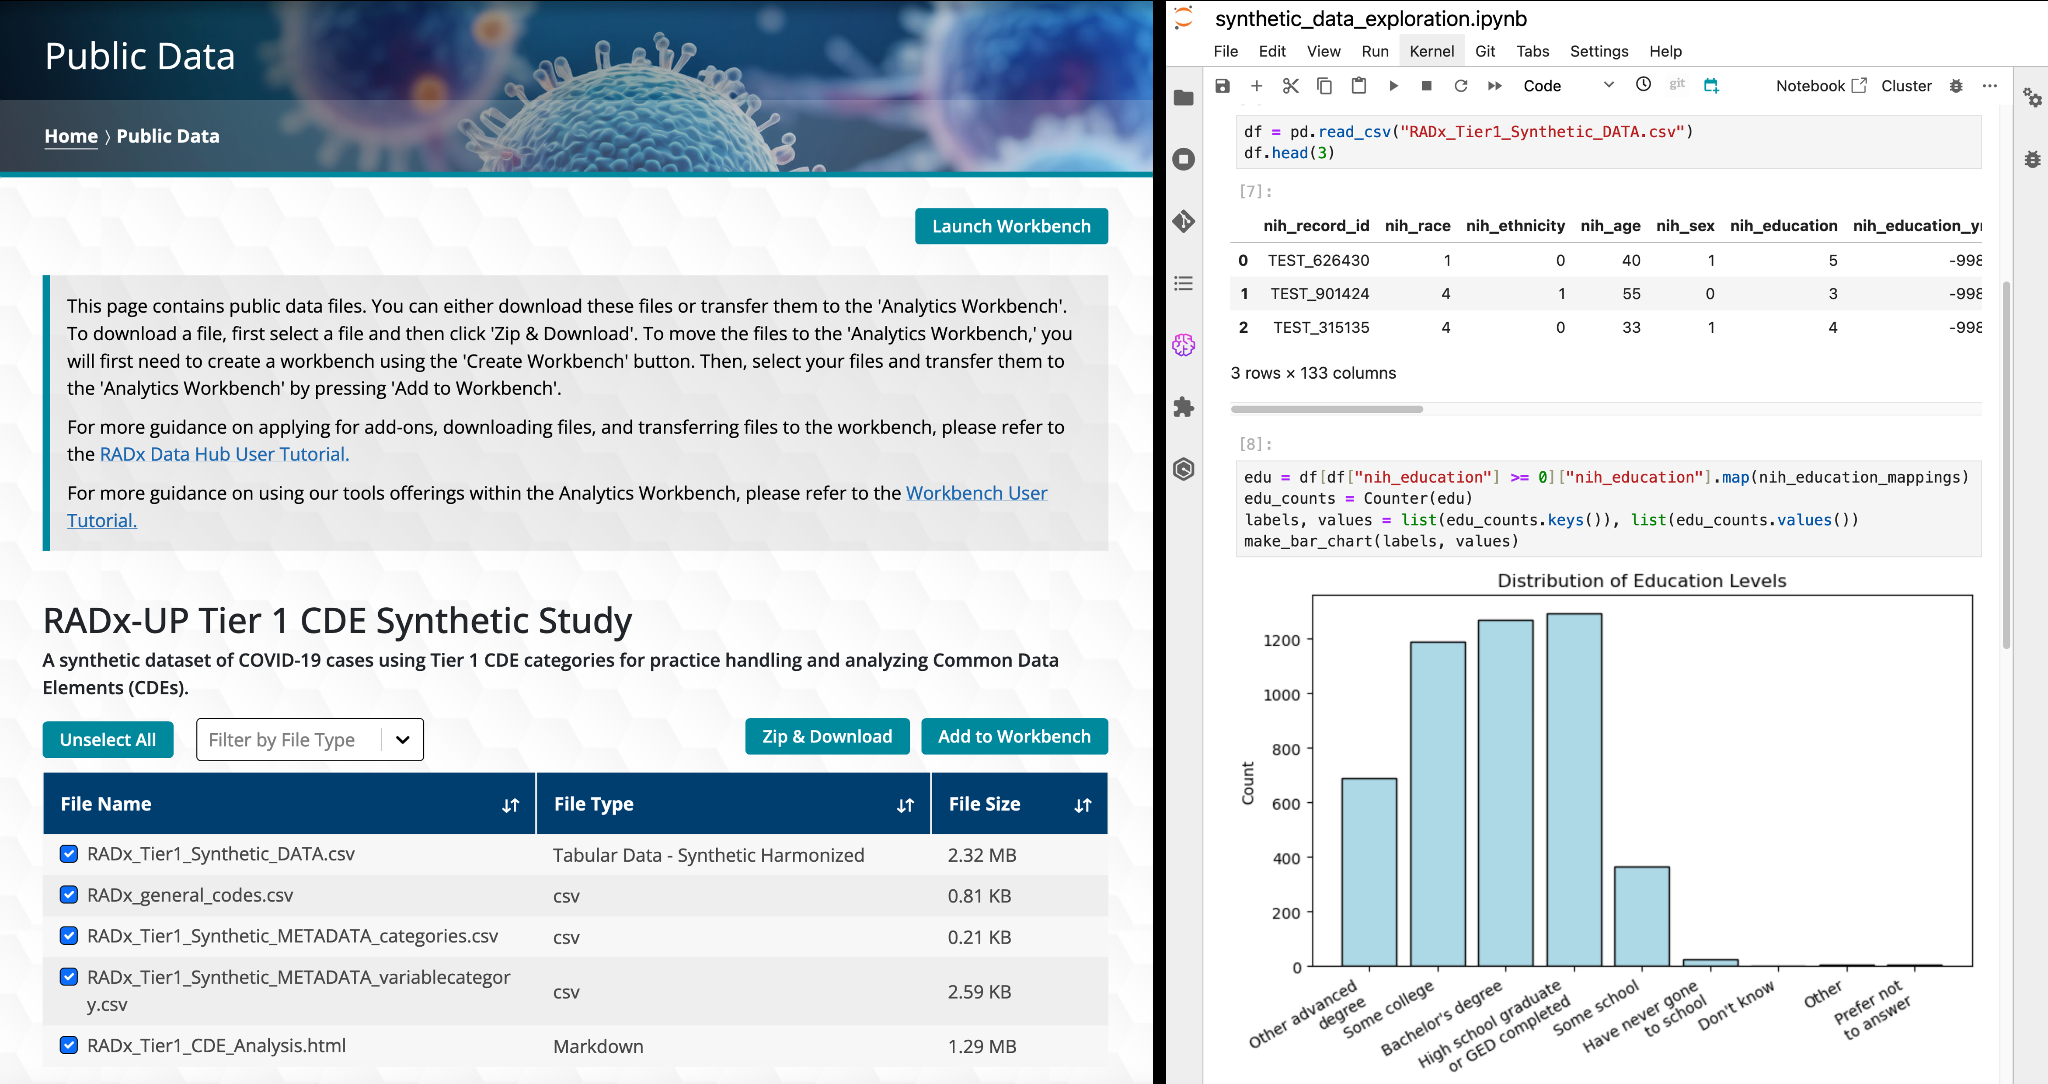
Users are able to view the Data Hub’s Public Data page and Analytics Workbench. The Public Data page provides access to data files that are openly available, including files containing synthetic data. Users can download these data files directly or transfer them to the Analytics Workbench for further analysis. This feature allows researchers to explore the platform’s tools and capabilities before requesting access to protected study data. The Analytics Workbench is shown on the right-hand side of Figure 6, where a Jupyter Notebook environment allows analysis of the distribution of the subject’s education levels within a synthetic data file. This example highlights the Workbench’s capacity to facilitate secure data analysis and visualization, offering a flexible environment equipped with various analytical tools.
Figure 6. Public Data and Analytics Workbench. The left side highlights the Public Data Page, where users can access and transfer public data files to the Workbench. The right side displays the Analytics Workbench using a Jupyter Notebook to analyze the distribution of education levels in synthetic data, showcasing the platform’s data analysis and visualization capabilities.
System Architecture
The Data Hub is a cloud-based platform designed to provide a scalable, secure, and FAIR-compliant infrastructure for collecting, harmonizing, and analyzing COVID-19 data. The Data Hub architecture supports the flow of diverse data types from data producers to a centralized data repository, enabling researchers and stakeholders to leverage data effectively.
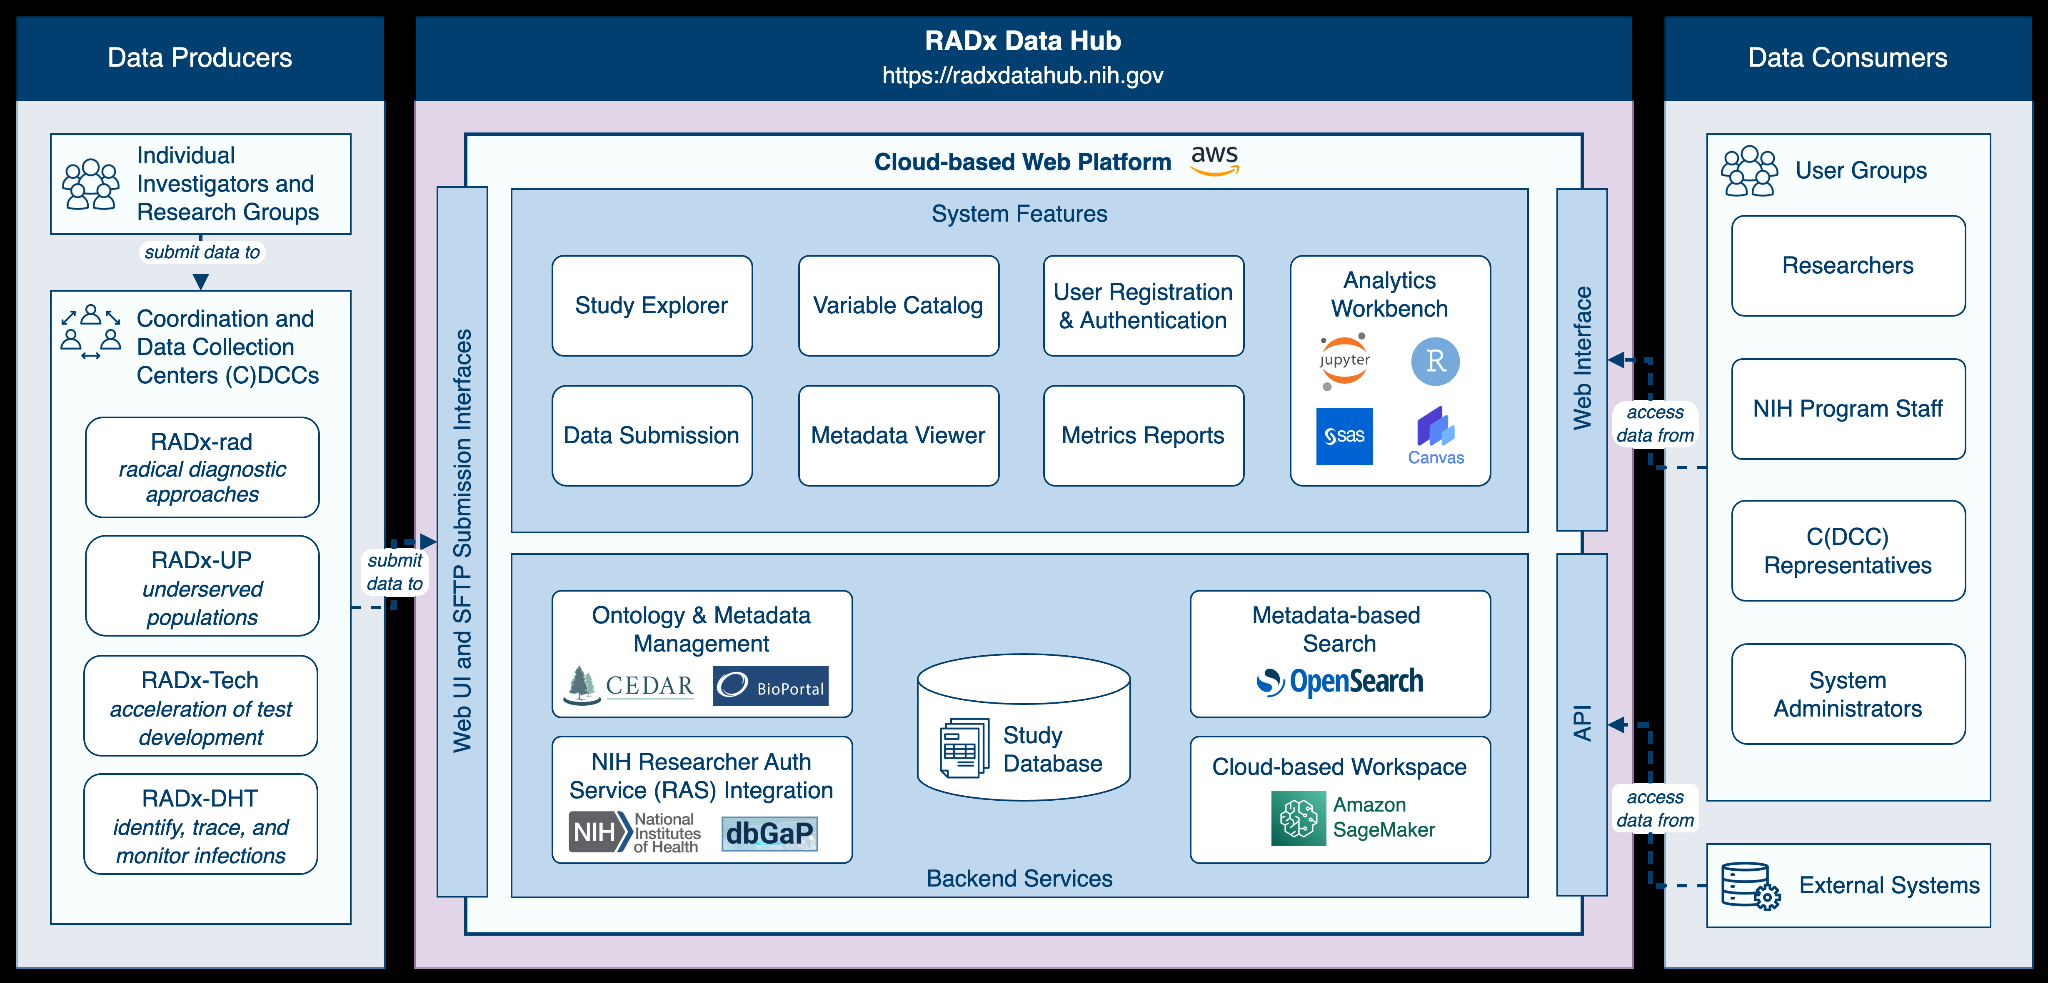
The architecture comprises two functional layers—the frontend and backend—both hosted on AWS cloud infrastructure and interconnected through secure APIs (Figure 7). This architecture is designed to scale with increasing data and user demands, while maintaining high performance and availability.
Figure 7. Overview of the Data Hub’s software architecture. Data producers submit study data to the Data Hub, hosted on AWS. The Data Hub features backend services for ontology and metadata management, metadata-based search, and secure storage, ensuring data is harmonized, validated, and curated. Its main features include study and variable search, exploration, and advanced analytics, while an integrated workbench provides researchers with a scalable environment for conducting advanced analyses and running machine learning workflows.
The frontend layer provides user-facing functionalities through a modern web interface built with React and Next.js. The frontend layer supports dynamic page rendering, device compatibility, and accessibility requirements (including Section 508 compliance ). Key features include the Study Explorer, Variable Catalog, and Metadata Viewer, which allow users to browse, search, and explore data and metadata, and access secure user registration and authentication systems.
Additional features, such as the Analytics Workbench, integrate Jupyter, R, and SAS to facilitate advanced data analysis and visualization. Metrics Reports further enhance this layer by providing actionable insights into data usage, quality, and platform performance, supporting effective system monitoring.
The backend layer is implemented using a microservice architecture powered by Spring Boot and Python. It handles business logic and workflows essential for data ingestion, harmonization, and search. Core components include (1) Submission Services for validating and processing incoming data, (2) Search Services powered by AWS OpenSearch for efficient metadata-based retrieval, and (3) an integrated Analytics Workbench leveraging AWS SageMaker for scalable machine learning workflows. Security and compliance are maintained through robust identity management systems, including NIH Researcher Auth Service (RAS) integration and role-based access control (RBAC).
The system’s software architecture is designed for flexibility and scalability to accommodate additional COVID-19 study data, facilitate the addition of new features, and support the potential expansion into other health domains. A Postgres relational database, managed via the AWS Relational Database Service (RDS), stores metadata, while raw data files (without metadata) are housed in Amazon S3. This separation ensures efficient querying and modular scalability. AWS OpenSearch indexes metadata to provide fast and precise search capabilities. CEDAR and BioPortal enable metadata annotation and semantic interoperability, ensuring adherence to FAIR principles.
The cloud infrastructure is built on AWS, leveraging serverless technologies, such as AWS Fargate and Lambda for containerized microservices and tasks and Elastic Load Balancers for high availability. Development, testing, and production environments are isolated to enhance security and streamline deployment workflows. Automated CI/CD pipelines enable rapid and reliable updates to the system, maintaining operational stability and performance.
Data And Metadata Harmonization
Harmonization is a key component of the Data Hub’s mission to standardize study data, enabling cross-study analyses and the re-exploration of data within individual studies. Harmonization can be approached in two ways: (1) prospective harmonization, where common data and metadata standards are defined and established ahead of data collection, and (2) retrospective harmonization, which enforces common data standards and ensures consistent representation of semantically equivalent data through careful curation and processing after the data have been collected . Given the urgent, time-sensitive nature of the RADx initiative, prospective harmonization was not feasible. Developing and implementing advanced standards prior to data collection would have delayed critical public health research efforts. Therefore, retrospective harmonization was adopted as a pragmatic solution, enabling the standardization of diverse information while ensuring timely data availability for the broader goals of the RADx initiative.
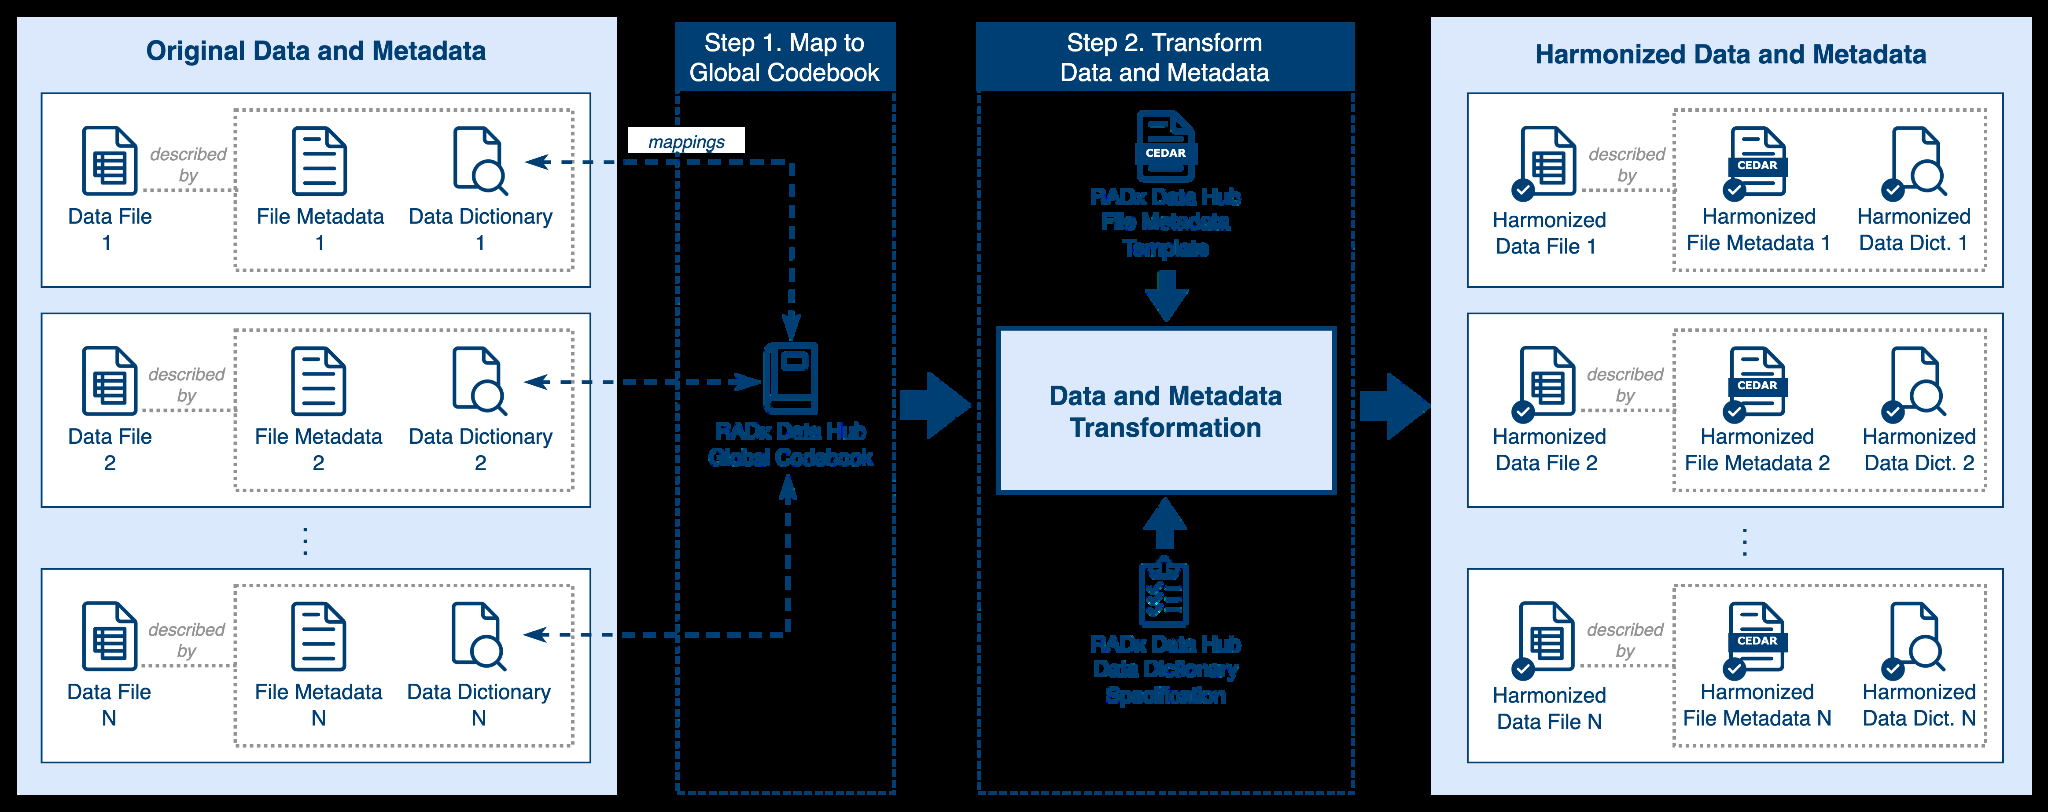
The harmonization process within the Data Hub, as illustrated in Figure 8, involves two main steps: (1) mapping data dictionaries to the Data Hub’s Global Codebook and (2) transforming data and metadata to align with standardized templates.
Figure 8. Harmonization Workflow. Harmonization of data files and metadata files within the Data Hub involves a two-step process. The Data Hub receives original data files, accompanied by their respective metadata files and data dictionaries (at left). In Step 1, the original data dictionaries are mapped to the Data Hub Global Codebook for CDEs, standardizing variable definitions and allowable values across studies. In Step 2, the original data and metadata are transformed into harmonized formats: data files are transformed using mappings from Step 1; metadata files are aligned to a CEDAR metadata template; and data dictionaries are converted to the Data Hub Data Dictionary Specification (center). This process ensures the resulting harmonized data files, metadata, and dictionaries are consistent and interoperable across the Data Hub (at right).
The harmonization workflow begins with mapping original data dictionaries provided by investigators to the Global Codebook of RADx Common Data Elements (CDEs), which serves as a unified framework for standardizing variable definitions and values across studies. The identification and creation of these mappings are performed manually by the Data Hub team, leveraging their expertise to account for the variability and complexity of submitted data. The resulting mappings are stored in the Global Codebook, creating a centralized, reproducible resource that supports ongoing and future harmonization efforts.
Following the mapping process, data and metadata are transformed to achieve harmonization, ensuring consistency and interoperability across datasets. Data files are transformed using the mappings identified previously. Study-level metadata (e.g., Principal Investigator information, funding sources, institutional affiliations) are aligned with a dedicated CEDAR metadata template . Similarly, data file metadata (e.g., file name, version, creator) are structured using a CEDAR template inspired by the DataCite Metadata Schema . The DataCite Metadata Schema provides a widely recognized list of standard core metadata properties for citation and retrieval purposes, which the CEDAR template augments by incorporating additional fields tailored to specific needs, such as detailed funding information and file characteristics. By leveraging the strengths of the DataCite standard while extending its functionality, the CEDAR template ensures that metadata are both globally compatible and capable of meeting diverse research requirements. Additionally, data dictionaries are converted to the Data Hub Data Dictionary Specification , ensuring uniformity in structure and representation.
Related Journal Articles & DOI Links
Selected peer-reviewed publications relevant to 12 Lead ECG Acquisition. Click the DOI to access the full paper (may require institutional access).
-
1. Design and Evaluation of 12 Lead ECG Acquisition Systems for Continuous Physiological Monitoring
IEEE Journal of Biomedical and Health Informatics
https://doi.org/10.1109/JBHI.2020.2981234 -
2. Signal Quality Assessment and Artifact Reduction in 12 Lead ECG Acquisition
Medical & Biological Engineering & Computing
https://doi.org/10.1007/s11517-020-02145-6 -
3. Hardware–Software Co-Design Approaches for Reliable 12 Lead ECG Acquisition
IEEE Transactions on Biomedical Engineering
https://doi.org/10.1109/TBME.2019.2895762 -
4. Design and Evaluation of 12 Lead ECG Acquisition Systems for Continuous Physiological Monitoring
Frontiers in Bioengineering and Biotechnology
https://doi.org/10.3389/fbioe.2020.00123 -
5. Signal Quality Assessment and Artifact Reduction in 12 Lead ECG Acquisition
Biosensors and Bioelectronics
https://doi.org/10.1016/j.bios.2021.112345 -
6. Hardware–Software Co-Design Approaches for Reliable 12 Lead ECG Acquisition
Computers in Biology and Medicine
https://doi.org/10.1016/j.compbiomed.2021.104567 -
7. Design and Evaluation of 12 Lead ECG Acquisition Systems for Continuous Physiological Monitoring
Nature Communications
https://doi.org/10.1038/s41467-020-12345-6
Why Choose Us?
Bangalore guidance for robotics, Spectre and autonomous systems projects.
Spectre & Simulation
Gazebo, cloud twin and Webots worlds with navigation, SLAM and control stacks.
Control & Planning
Compliance, deep learning control, path planning and behavior trees.
Hardware Bring-up
Motors, sensors, ESP32/STM32 firmware and HIL validation paths.
Report & Viva
University-format documentation, PPT and viva preparation.
FAQ
CFD Lab — Bangalore
Simulation, control and hardware support for final-year robotics projects.
Stacks
Worlds
Digital Twin
Control
Robots
Offline
Bring-up