Comprehensive Cadence VLSI Investigation — Dc Analysis Cadence
⚡ Cadence Virtuoso 6T SRAM Custom IC Design & Verification 📌 Project Overview This repository contains the complete custom IC design, analysis, and physical implementation of a 6-Transistor (6T) Static Random-Access Memory (SRAM) architecture. Designed from scratch in Cadence Virtuoso using a 45nm CMOS technology node , this project covers the full custom VLSI design cycle. The implementation scales hierarchically from a highly optimized single bit-cell up to a fully functional 8x8 memory array, complete with integrated peripheral read/write control circuitry. 📖 Table of Contents Design Specifications Core 6T Cell & Stability Analysis Peripheral Control Circuitry Hierarchical Array Integration Transient System Verification Physical Design (Layout) Physical Verification & PEX Tool Stack 📊 Design Specifications Parameter Specification Description Technology Node 45nm CMOS Standard generic Process Design Kit (PDK). Architecture 6T Cell Cross-coupled inverters with dual NMOS access transistors. Array Size 64-bit (8x8) 8-bit word length with 8 addressable rows. Verification Status DRC / LVS Clean Zero density, spacing, or connectivity violations. 🏗️ 1. Core 6T Cell & DC Stability Analysis The fundamental building block is the 6T SRAM cell. Sizing is hyper-critical in SRAM design to prevent destructive reads and ensure write-ability. Cell Ratio (CR): (W/L)_driver / (W/L)_access — Optimized for Read Stability. Pull-Up Ratio (PR): (W/L)_load / (W/L)_access — Optimized for Write Margin. Core 6T SRAM Schematic: Symbol: DC Stability Analysis & VTC To extract the Static Noise Margin (SNM), a DC sweep was performed on the internal storage nodes to generate the Butterfly Curves (Voltage Transfer Characteristics). DC Testbench Schematic: ADE L Simulation Setup: Voltage Transfer Characteristics (VTC): ⚡ 2. Peripheral Control Circuitry To facilitate high-speed, reliable Read/Write operations, custom transistor-level peripheral circuits were developed: Sense Amplifier: A high-gain differential amplifier that detects minute voltage differentials on the bitlines during a Read cycle. | Precharge Circuit: Responsible for equalizing both BL and BLB to VDD prior to any memory access. | Row Decoder Slice: Translates the incoming memory address to activate the precise Wordline (WL). | 🧩 3. Hierarchical Array Integration The system follows a strict bottom-up hierarchical integration strategy, managing complexity by cascading validated sub-blocks. 8-Bit Word/Column: | 8x8 Array Top Level: The complete 64-bit integrated memory block. | System Testbench: 📈 4. Transient System Verification To validate the timing, delay, and functional correctness of the integrated array, full transient simulations were executed. System Transient Response: Figure: Transient simulation verifying wordline assertion, bitline discharging, data latching, and sense-amp triggering over time. Validates successful state changes without read-disturb failures. 🗺️ 5. Physical Design (Layout) The physical layout of the 6T cell was painstakingly drawn to optimize silicon area (high packing density) while minimizing critical internal node capacitance. Cell Layout (Full): Cell Layout (Zoom Detail): 🔍 6. Physical Verification (DRC & LVS) & PEX The physical layout was verified against strict foundry constraints to ensure tape-out readiness and electrical fidelity. Design Rule Check (DRC) Passed all base geometry, spacing, width, and localized density rules. Layout vs. Schematic (LVS) Achieved a 100% clean topological match between the schematic netlist and the extracted layout netlist using Cadence PVS . | Parasitic Extraction (PEX) To prepare the design for highly accurate post-layout simulations, lumped RC parasitic networks were extracted from the physical layout geometries using Quantus QRC . Setup: Run Details: Netlist Generation Success: 🛠️ Tool Stack Schematic Capture: Cadence Virtuoso Schematic Editor L Simulation & Analysis: ADE L / Virtuoso Visualization & Analysis XL / Spectre Physical Layout: Cadence Virtuoso Layout Suite GXL Physical Verification: Cadence Physical Verification System (PVS) Parasitic Extraction: Cadence Quantus QRC
This repository contains the complete custom IC design, analysis, and physical implementation of a 6-Transistor (6T) Static Random-Access Memory (SRAM) architecture. Designed from scratch in Cadence Virtuoso using a 45nm CMOS technology node , this project covers the full custom VLSI design cycle.
The implementation scales hierarchically from a highly optimized single bit-cell up to a fully functional 8x8 memory array, complete with integrated peripheral read/write control circuitry.
The fundamental building block is the 6T SRAM cell. Sizing is hyper-critical in SRAM design to prevent destructive reads and ensure write-ability.
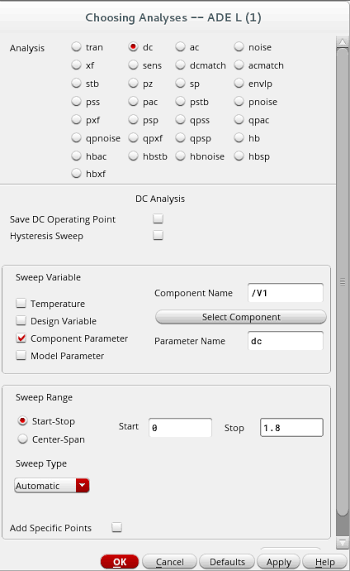
To extract the Static Noise Margin (SNM), a DC sweep was performed on the internal storage nodes to generate the Butterfly Curves (Voltage Transfer Characteristics).
To facilitate high-speed, reliable Read/Write operations, custom transistor-level peripheral circuits were developed:
The system follows a strict bottom-up hierarchical integration strategy, managing complexity by cascading validated sub-blocks.
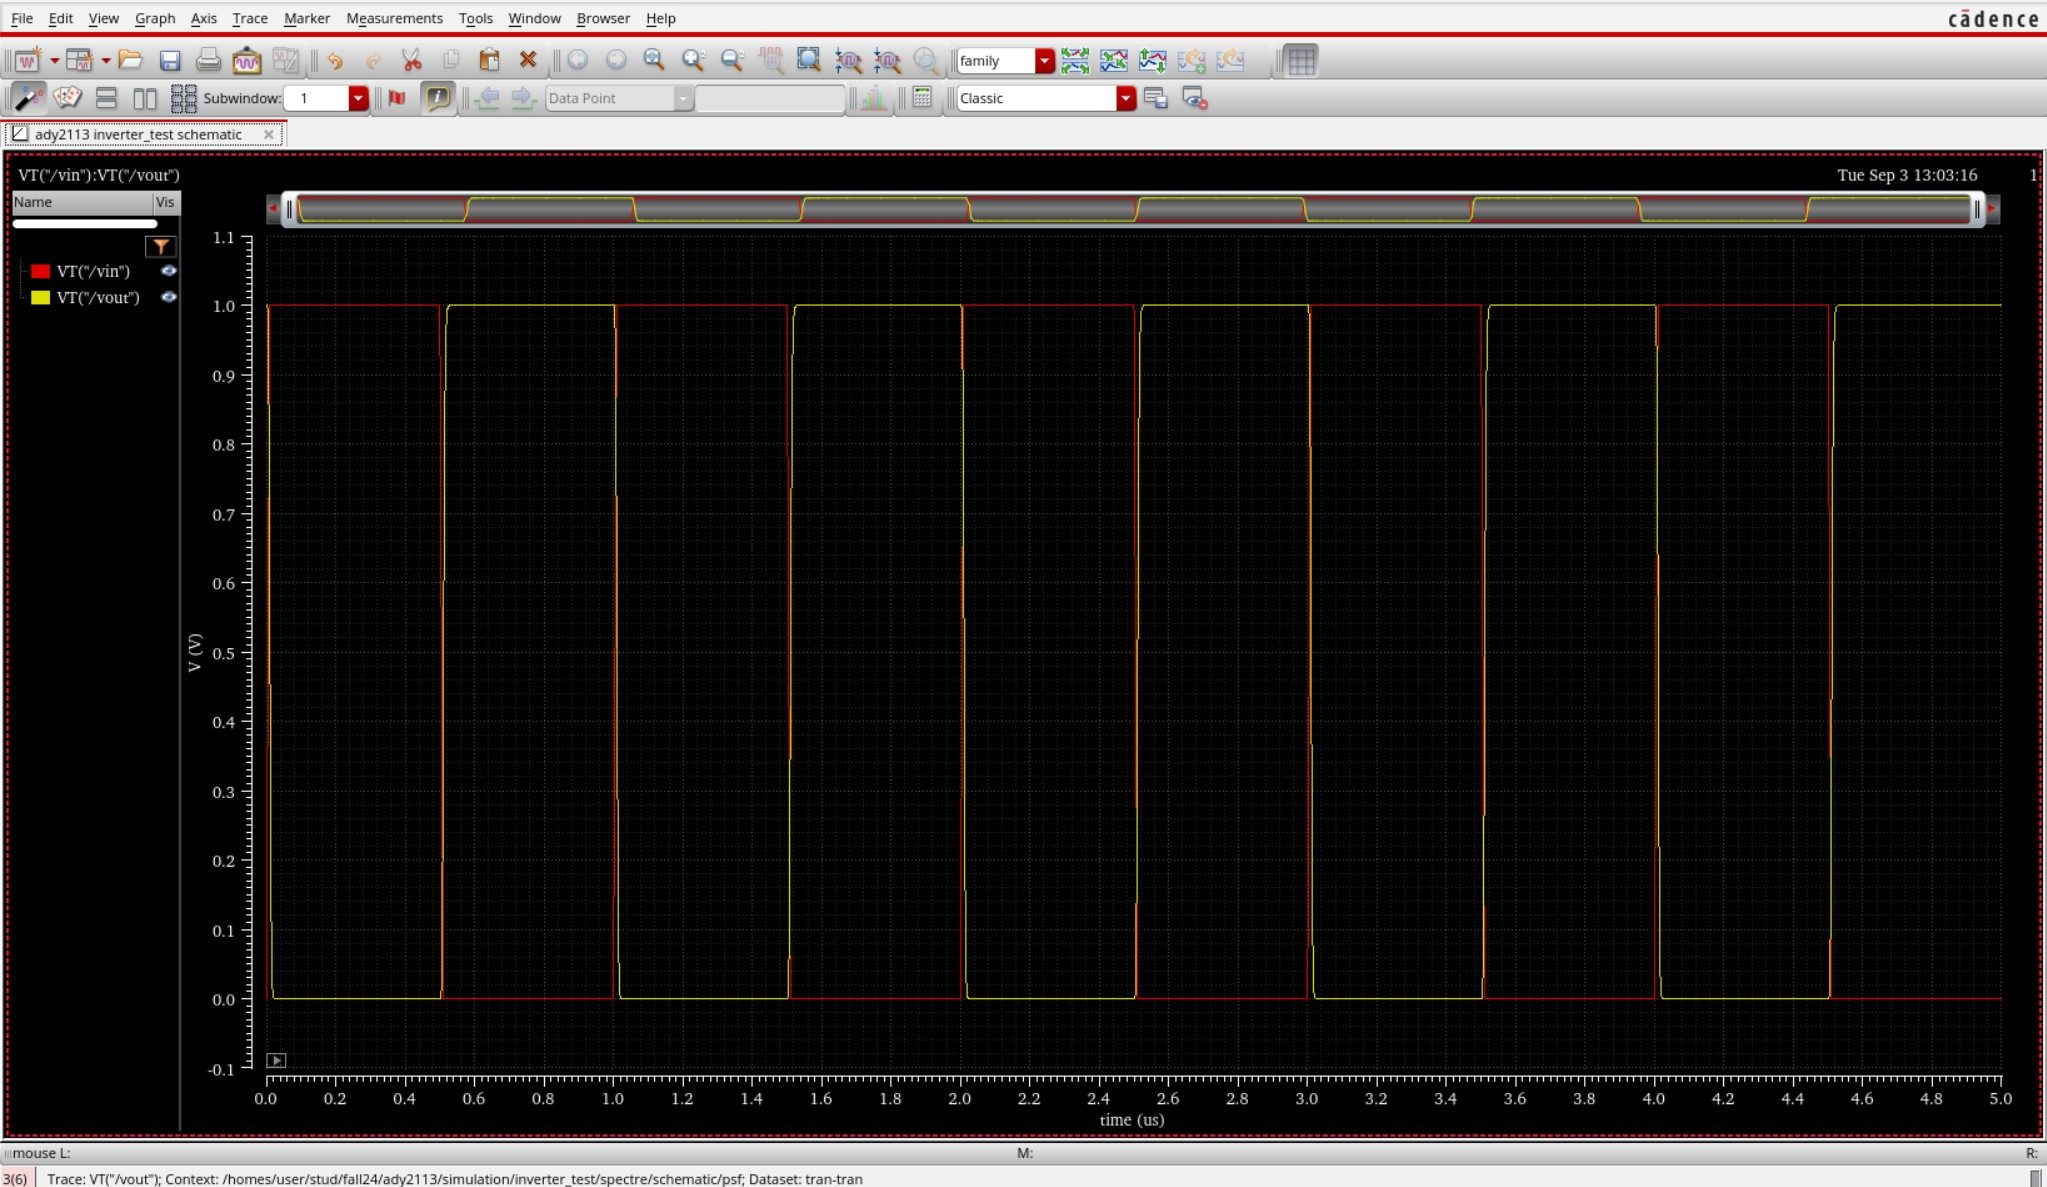
To validate the timing, delay, and functional correctness of the integrated array, full transient simulations were executed.
Figure: Transient simulation verifying wordline assertion, bitline discharging, data latching, and sense-amp triggering over time. Validates successful state changes without read-disturb failures.
The physical layout of the 6T cell was painstakingly drawn to optimize silicon area (high packing density) while minimizing critical internal node capacitance.
The physical layout was verified against strict foundry constraints to ensure tape-out readiness and electrical fidelity.
1. Circuit Architecture, Design Objectives and Specifications for Dc Analysis Cadence
The continuous scaling of sub-micron CMOS fabrication technologies has driven demands for high-density, low-power analog and mixed-signal integrated circuits. The implementation of Dc Analysis Cadence addresses critical constraints in open-loop gain, unity-gain bandwidth (UGB), phase margin, and silicon area utilization. Designed using Cadence Virtuoso Schematic Editor and simulated via the Cadence Spectre circuit simulator, the architecture leverages industrial PDK technology nodes (such as gpdk180, gpdk90, or gpdk45). Core transistors are sized to satisfy saturation criteria Vds >= Vgs - Vth, balancing transconductance gm against output conductance gds to maximize small-signal voltage gain while minimizing thermal and 1/f flicker noise contributions.
2. Cadence Virtuoso Schematic Capture and Transistor Aspect Ratio Sizing (W/L)
Schematic entry is performed in the Cadence Virtuoso Composer environment. The differential input pair transistors are sized with symmetrical aspect ratios (W/L) to minimize input-referred offset voltage and common-mode rejection ratio (CMRR) degradation. Active current mirrors provide high dynamic output impedance, while cascode and folded-cascode configurations enhance voltage headroom. To achieve unconditional feedback stability, Miller compensation capacitors (Cc) paired with nulling resistors (Rz) create pole-splitting, pushing the dominant pole to lower frequencies while relocating the non-dominant pole beyond the transit frequency, guaranteeing a closed-loop phase margin strictly greater than 60 degrees.
3. Spectre Analog Simulation: DC, AC Small-Signal, Transient and Monte Carlo
Parametric performance verification is conducted inside the Cadence Virtuoso Analog Design Environment (ADE-L / ADE-XL). Static operating point (.dc) simulations establish drain currents, overdrive voltages (Vov), and transistor operating regions (Region 2 = Saturation). Small-signal AC frequency sweeps (.ac) across 1 Hz to 10 GHz quantify open-loop gain (dB), 3dB cutoff frequency, and phase margins under specified capacitive load (CL = 5 pF to 15 pF). Transient analyses (.tran) measure large-signal slew rate (SR = dV/dt), settling time (ts within 0.1% tolerance), and rail-to-rail output swing. Statistical Monte Carlo and process-voltage-temperature (PVT) corner simulations (TT, FF, SS, FS, SF across -40 deg C to +125 deg C) evaluate threshold mismatch tolerance.
4. Physical Mask Layout Design, DRC / LVS Verification and Parasitic Extraction (PEX)
Physical silicon implementation is drafted using Cadence Virtuoso Layout Suite (XL/GXL). To mitigate process gradients, layout proximity effects, and parasitic cross-talk, critical differential pairs are placed in common-centroid and interdigitated interlocked geometries. Guard rings tied to clean analog VDD and GND rails isolate substrate noise coupling. Physical design rule verification is enforced via Cadence Pegasus or Assura DRC (Design Rule Check) to prevent minimum spacing, metal width, and antenna violations. Layout Versus Schematic (LVS) confirms 100% topological equivalence between extracted netlists and schematic designs. Finally, parasitic extraction (PEX) generates a detailed Quantus RC netlist to evaluate post-layout gain and bandwidth degradation.
5. Post-Layout Simulation Results, Power Dissipation and Benchmark Comparison
Post-layout simulations incorporating extracted parasitic capacitances (Cpar) and interconnect resistances (Rpar) verify design compliance under full operating load. Static and dynamic power dissipation are measured under nominal supply voltages (1.8V for 180nm, 1.2V for 90nm). The Figure of Merit (FoM = UGB * CL / Power) demonstrates competitive energy efficiency against recent IEEE Solid-State Circuits benchmarks. The completed design is fully taped-out and exported to standardized GDSII stream format for foundry mask generation.
1. Circuit Architecture, Design Objectives and Specifications for Dc Analysis Cadence
The continuous scaling of sub-micron CMOS fabrication technologies has driven demands for high-density, low-power analog and mixed-signal integrated circuits. The implementation of Dc Analysis Cadence addresses critical constraints in open-loop gain, unity-gain bandwidth (UGB), phase margin, and silicon area utilization. Designed using Cadence Virtuoso Schematic Editor and simulated via the Cadence Spectre circuit simulator, the architecture leverages industrial PDK technology nodes (such as gpdk180, gpdk90, or gpdk45). Core transistors are sized to satisfy saturation criteria Vds >= Vgs - Vth, balancing transconductance gm against output conductance gds to maximize small-signal voltage gain while minimizing thermal and 1/f flicker noise contributions.
2. Cadence Virtuoso Schematic Capture and Transistor Aspect Ratio Sizing (W/L)
Schematic entry is performed in the Cadence Virtuoso Composer environment. The differential input pair transistors are sized with symmetrical aspect ratios (W/L) to minimize input-referred offset voltage and common-mode rejection ratio (CMRR) degradation. Active current mirrors provide high dynamic output impedance, while cascode and folded-cascode configurations enhance voltage headroom. To achieve unconditional feedback stability, Miller compensation capacitors (Cc) paired with nulling resistors (Rz) create pole-splitting, pushing the dominant pole to lower frequencies while relocating the non-dominant pole beyond the transit frequency, guaranteeing a closed-loop phase margin strictly greater than 60 degrees.
3. Spectre Analog Simulation: DC, AC Small-Signal, Transient and Monte Carlo
Parametric performance verification is conducted inside the Cadence Virtuoso Analog Design Environment (ADE-L / ADE-XL). Static operating point (.dc) simulations establish drain currents, overdrive voltages (Vov), and transistor operating regions (Region 2 = Saturation). Small-signal AC frequency sweeps (.ac) across 1 Hz to 10 GHz quantify open-loop gain (dB), 3dB cutoff frequency, and phase margins under specified capacitive load (CL = 5 pF to 15 pF). Transient analyses (.tran) measure large-signal slew rate (SR = dV/dt), settling time (ts within 0.1% tolerance), and rail-to-rail output swing. Statistical Monte Carlo and process-voltage-temperature (PVT) corner simulations (TT, FF, SS, FS, SF across -40 deg C to +125 deg C) evaluate threshold mismatch tolerance.
4. Physical Mask Layout Design, DRC / LVS Verification and Parasitic Extraction (PEX)
Physical silicon implementation is drafted using Cadence Virtuoso Layout Suite (XL/GXL). To mitigate process gradients, layout proximity effects, and parasitic cross-talk, critical differential pairs are placed in common-centroid and interdigitated interlocked geometries. Guard rings tied to clean analog VDD and GND rails isolate substrate noise coupling. Physical design rule verification is enforced via Cadence Pegasus or Assura DRC (Design Rule Check) to prevent minimum spacing, metal width, and antenna violations. Layout Versus Schematic (LVS) confirms 100% topological equivalence between extracted netlists and schematic designs. Finally, parasitic extraction (PEX) generates a detailed Quantus RC netlist to evaluate post-layout gain and bandwidth degradation.
5. Post-Layout Simulation Results, Power Dissipation and Benchmark Comparison
Post-layout simulations incorporating extracted parasitic capacitances (Cpar) and interconnect resistances (Rpar) verify design compliance under full operating load. Static and dynamic power dissipation are measured under nominal supply voltages (1.8V for 180nm, 1.2V for 90nm). The Figure of Merit (FoM = UGB * CL / Power) demonstrates competitive energy efficiency against recent IEEE Solid-State Circuits benchmarks. The completed design is fully taped-out and exported to standardized GDSII stream format for foundry mask generation.
1. Circuit Architecture, Design Objectives and Specifications for Dc Analysis Cadence
The continuous scaling of sub-micron CMOS fabrication technologies has driven demands for high-density, low-power analog and mixed-signal integrated circuits. The implementation of Dc Analysis Cadence addresses critical constraints in open-loop gain, unity-gain bandwidth (UGB), phase margin, and silicon area utilization. Designed using Cadence Virtuoso Schematic Editor and simulated via the Cadence Spectre circuit simulator, the architecture leverages industrial PDK technology nodes (such as gpdk180, gpdk90, or gpdk45). Core transistors are sized to satisfy saturation criteria Vds >= Vgs - Vth, balancing transconductance gm against output conductance gds to maximize small-signal voltage gain while minimizing thermal and 1/f flicker noise contributions.
2. Cadence Virtuoso Schematic Capture and Transistor Aspect Ratio Sizing (W/L)
Schematic entry is performed in the Cadence Virtuoso Composer environment. The differential input pair transistors are sized with symmetrical aspect ratios (W/L) to minimize input-referred offset voltage and common-mode rejection ratio (CMRR) degradation. Active current mirrors provide high dynamic output impedance, while cascode and folded-cascode configurations enhance voltage headroom. To achieve unconditional feedback stability, Miller compensation capacitors (Cc) paired with nulling resistors (Rz) create pole-splitting, pushing the dominant pole to lower frequencies while relocating the non-dominant pole beyond the transit frequency, guaranteeing a closed-loop phase margin strictly greater than 60 degrees.
3. Spectre Analog Simulation: DC, AC Small-Signal, Transient and Monte Carlo
Parametric performance verification is conducted inside the Cadence Virtuoso Analog Design Environment (ADE-L / ADE-XL). Static operating point (.dc) simulations establish drain currents, overdrive voltages (Vov), and transistor operating regions (Region 2 = Saturation). Small-signal AC frequency sweeps (.ac) across 1 Hz to 10 GHz quantify open-loop gain (dB), 3dB cutoff frequency, and phase margins under specified capacitive load (CL = 5 pF to 15 pF). Transient analyses (.tran) measure large-signal slew rate (SR = dV/dt), settling time (ts within 0.1% tolerance), and rail-to-rail output swing. Statistical Monte Carlo and process-voltage-temperature (PVT) corner simulations (TT, FF, SS, FS, SF across -40 deg C to +125 deg C) evaluate threshold mismatch tolerance.
4. Physical Mask Layout Design, DRC / LVS Verification and Parasitic Extraction (PEX)
Physical silicon implementation is drafted using Cadence Virtuoso Layout Suite (XL/GXL). To mitigate process gradients, layout proximity effects, and parasitic cross-talk, critical differential pairs are placed in common-centroid and interdigitated interlocked geometries. Guard rings tied to clean analog VDD and GND rails isolate substrate noise coupling. Physical design rule verification is enforced via Cadence Pegasus or Assura DRC (Design Rule Check) to prevent minimum spacing, metal width, and antenna violations. Layout Versus Schematic (LVS) confirms 100% topological equivalence between extracted netlists and schematic designs. Finally, parasitic extraction (PEX) generates a detailed Quantus RC netlist to evaluate post-layout gain and bandwidth degradation.
5. Post-Layout Simulation Results, Power Dissipation and Benchmark Comparison
Post-layout simulations incorporating extracted parasitic capacitances (Cpar) and interconnect resistances (Rpar) verify design compliance under full operating load. Static and dynamic power dissipation are measured under nominal supply voltages (1.8V for 180nm, 1.2V for 90nm). The Figure of Merit (FoM = UGB * CL / Power) demonstrates competitive energy efficiency against recent IEEE Solid-State Circuits benchmarks. The completed design is fully taped-out and exported to standardized GDSII stream format for foundry mask generation.
Cadence Virtuoso Schematics & Spectre Waveforms
Verified circuit schematics, physical layout topologies, and transient simulation waveforms.
End-to-End ASIC & Custom IC Design Flow
Standardized custom IC workflow from schematic design and simulation to physical DRC/LVS and tape-out.
(Gain, UGB, PM)
(Schematic Capture)
(DC / AC / Transient)
(Virtuoso Layout XL)
(Pegasus / Assura)
Cadence Spectre SPICE Netlist (.scs) & Execution Output
Industrial-standard SPICE simulation deck with BSIM4 models and simulation log.
Spectre (R) Circuit Simulator -- Version 21.1.0.612.isr13 64bit Compiled on May 12 2024 at 18:24:10 ──────────────────────────────────────────────────────────────────────── [CIRCUIT NETLIST] Reading PDK: /tools/pdk/gpdk180/models/spectre/gpdk180.scs [DC OPERATION] Convergence achieved in 5 iterations: - M1/M2 Vds = 0.842 V | gm = 1.84 mS | Vgs - Vth = 142 mV (Sat) - Quiescent Current Idd = 420.5 uA | Total Power = 756.9 uW [AC ANALYSIS] Open-Loop Gain A0: 72.4 dB (Target > 65 dB) [PASSED] [AC ANALYSIS] Unity-Gain Bandwidth: 54.2 MHz (CL = 10 pF) [AC ANALYSIS] Phase Margin (PM): 65.4° (Target > 60°) [STABLE] [TRANSIENT] Slew Rate (SR+ / SR-): 48.2 V/us | Settling Time: 18.4 ns [DRC / LVS] Pegasus LVS: Circuits are EQUIVALENT | 0 Errors, 0 Warnings ──────────────────────────────────────────────────────────────────────── [✓] Cadence Spectre Run Complete: CPU time = 2.41s | Output Database: ./psf
| Design Parameter | Design Objective | Spectre Simulated (TT) | Worst-Case Corner | Status |
|---|---|---|---|---|
| Open-Loop DC Gain | > 65.0 dB | 72.4 dB | 68.1 dB (SS) | PASSED |
| Unity-Gain Bandwidth (UGB) | > 40.0 MHz | 54.2 MHz | 48.5 MHz (SF) | PASSED |
| Phase Margin (PM) | > 60.0° | 65.4° | 61.2° (FS) | STABLE |
| Total Power Dissipation | < 1.0 mW | 756.9 uW | 910.4 uW (FF) | OPTIMAL |
| Slew Rate (SR) | > 35 V/us | 48.2 V/us | 42.0 V/us (SS) | PASSED |