Comprehensive Cadence VLSI Investigation — Instrumentation Amplifier Cadence
CMOS Analog Front-End Design & Technology Scaling Study (180 nm vs 45 nm) An analog integrated circuit design and characterization study evaluating short-channel scaling effects using industrial PDKs in Cadence Virtuoso. This project contrasts a legacy baseline node (180 nm) against a deep-submicron node (45 nm) to implement a precision three-op-amp instrumentation amplifier (INA). Problem Statement & Motivation This project evaluates the impact of CMOS technology scaling on precision analog front-end design by comparing a 180 nm long-channel baseline with a custom 45 nm implementation in Cadence Virtuoso. The primary objective is to quantify how reduced supply voltage, limited voltage headroom, and short-channel effects influence operational amplifier performance, and to evaluate the trade-offs introduced when integrating the amplifier into a three-op-amp instrumentation amplifier (INA). The study focuses on recovering precision under deep-submicron constraints through transistor sizing, compensation design, reference biasing, and closed-loop feedback optimization. System Architecture The complete closed-loop 45 nm instrumentation amplifier is shown below. The design is constructed using three custom two-stage operational amplifiers together with a precision resistor network and reference bias circuitry. Signal Flow Differential Input ➔ 45 nm NMOS Input Differential Pair ➔ Active PMOS Load Stage ➔ Miller Compensation Network ➔ Second-Stage PMOS Common-Source Driver ➔ 3-Op-Amp INA Topology Integration ➔ Resistor Feedback Network ➔ $V_{ref}$ Bias Rail Injection ➔ Differential Output System Overview & Attribution This repository contains three progressively integrated analog building blocks evaluated using Cadence Virtuoso and Spectre simulations: 180 nm Two-Stage Operational Amplifier — Long-channel reference characterized using open-loop AC analysis. 45 nm Two-Stage Operational Amplifier — Custom implementation optimized for deep-submicron operation. 45 nm Three-Op-Amp Instrumentation Amplifier — Closed-loop system assembled from the custom OTA cells and evaluated under practical loading conditions. Scope of Work & Attribution Statement: The core OTA topology and initial geometric baseline were derived from the referenced literature by Vasanthi et al. [1] and Sharmila Banu et al. [2]. The 180 nm legacy baseline was simulated as a team effort. The three-op-amp instrumentation amplifier architecture, compensation strategy, headroom-recovery biasing methodology, automated parameter sensitivity analysis, technology scaling study, 17-testbench verification flow, and system-level performance evaluations were developed entirely as individual contributions for this project. Individual Contributions (Author) Designed and implemented the complete 45 nm two-stage operational amplifier in Cadence Virtuoso. Designed, integrated, and tuned the closed-loop 45 nm instrumentation amplifier using the custom op-amp structural blocks. Performed Spectre-based AC, transient, DC, and parametric sweep analyses. Investigated and corrected system-level CMRR, PSRR, gain-bandwidth, and circuit loading trade-offs. Optimized the precision resistor feedback network to recover closed-loop tracking and gain accuracy. Team Contribution Designed and implemented the legacy 180 nm two-stage operational amplifier baseline cell. Performed open-loop AC characterization on the 180 nm node to establish the technology-scaling performance reference. Design Constraints & Operating Conditions The design enforces strict boundaries across process parameters, supply rails, and stability metrics: 180 nm Baseline Node: Supply voltage $V_{DD} = 1.8\text{ V}$ , Input Common-Mode Range (ICMR) = 0.8 V to 1.6 V. Enforced minimum channel length $L = 500\text{ nm}$ to ensure long-channel behavior, driving a load capacitance $C_L = 2\text{ pF}$ . 45 nm Submicron Node: Supply voltage $V_{DD} = 1.2\text{ V}$ , compressed ICMR = 0.8 V to 1.0 V. Physical channel length is established at an optimized limit of $L = 200\text{ nm}$ to balance short-channel effects against speed, driving a load capacitance $C_L = 4\text{ pF}$ . Stability Limits: To maintain closed-loop stability, the internal Miller compensation capacitor constraint is bounded by $C_c \ge 0.22 \cdot C_L$ . Key Technical Achievements Comparative Technology Scaling: Characterization of 180 nm and 45 nm CMOS implementations to quantify multi-node short-channel effects. Channel-Length Optimization: Strategic over-sizing (L = 200 nm) to mitigate severe channel-length modulation and preserve an intrinsic gain ( $A_0$ ) baseline. Reference Bias Injection: Implementation of a custom $V_{ref} = 0.78\text{ V}$ bias rail to maintain device saturation under a compressed 1.2 V supply. Parametric Sensitivity Mapping: Automated aspect ratio sweeps to isolate layout-sensitive transconductance paths. Loading Error Correction: Precision feedback resistor matching to eliminate closed-loop tracking losses and improve gain accuracy. Design Philosophy The design prioritizes predictable analog performance over minimum geometry. Rather than maximizing transistor density, channel lengths were intentionally increased where necessary to preserve intrinsic gain and output resistance. Reference biasing was introduced to maintain device saturation under limited voltage headroom, while symmetric differential layouts were used to improve common-mode rejection. Key Engineering Decisions Architectural Tradeoff Analysis Component / Node Selected Approach Rejected Alternative Engineering Justification Process Node Scale 45 nm Deep Submicron 180 nm Traditional CMOS Density & Speed over Headroom: 45 nm maximizes integration density and operating speed, but compresses the supply rail to 1.2 V and introduces severe short-channel effects. Sizing Constraint Standardized L = 200 nm Lithographic L = 45 nm Intrinsic Gain over Speed: Sizing at 200 nm provides an intentional guardband that preserves an open-loop gain baseline of approx 41.75 dB, preventing severe gain degradation from channel-length modulation. Reference Bias Topology Injected V_ref = 0.78 V Ground Reference (0 V) Saturation Preservation over Simplicity: Tying the difference stage reference to 0 V pulls the common-mode level to approx 0.4 V, driving the NMOS input pair into cutoff. Injecting 0.78 V restores critical V_DS headroom. Repository Organization cmos-analog-frontends-cadence/ ├── README.md ├── docs/ │ ├── report.pdf │ ├── circuit_schematics.pdf │ └── methodology_notes.pdf ├── results/ │ ├── opamp_180nm/ │ │ ├── gain_180.jpg │ │ └── magnitude180opamp.jpg │ ├── opamp_45nm/ │ │ ├── gain_opamp.jpg │ │ ├── tran_opamp.jpg │ │ ├── opamp_cmrr_only.jpg │ │ ├── opamp_psrr.jpg │ │ └── opamp_dc_offset.jpg │ └── instrumentation_amp_45nm/ │ ├── instr_final_ac.jpg │ ├── instr_final_gain.jpg │ ├── instr_final_tran.jpg │ ├── instrum_cmrr_only_new.jpg │ └── instrum_psrr.jpg ├── design_screenshots/ │ ├── opamp.png │ ├── opamp180.png │ ├── instr_final.png │ ├── opamp_tester_cmrr.png │ └── opamp_tester_psrr.png ├── cadence_notes/ │ ├── design_flow.txt │ └── parameter_sweep_summary.txt └── LICENSE Process & Device Parameters The project leverages the GPDK180 (180 nm CMOS) and GPDK045 (45 nm CMOS) process design kits. To explicitly evaluate the geometric implications of technology migration, the transistor sizing strategies for both nodes are contrasted below. For the 180 nm baseline, a true long-channel guardband (L = 500 nm) was maintained. For the 45 nm submicron node, an intentional over-sizing strategy (L = 200 nm) was enforced to protect the intrinsic gain (A_0 ≈ g_m × r_o) against severe channel-length modulation. 1. Legacy 180 nm Baseline Node Sizing (V_DD = 1.8 V) Instance Circuit Function Device Type Width (W) Length (L) Aspect Ratio (W/L) M1, M2 Input Differential Pair NMOS 3.00 µm 500 nm 6.00 M3, M4 Active Current Mirror Load PMOS 7.00 µm 500 nm 14.00 M5 Tail Current Source NMOS 6.00 µm 500 nm 12.00 M6 Common-Source Driver Stage PMOS 13.07 µm 500 nm 173.00 M7 Second-Stage Active Load NMOS 37.50 µm 500 nm 75.00 M8 Reference Bias Generator NMOS 6.00 µm 500 nm 12.00 2. Deep Submicron 45 nm Node Sizing (V_DD = 1.2 V) Instance Circuit Function Device Type Width (W) Length (L) Nominal Ratio (W/L) Effective Ratio ( $W_{eff}/L_{eff}$ ) M1, M2 Input Differential Pair NMOS 2.20 µm 200 nm 11.00 10.93 M3, M4 Active Current Mirror Load PMOS 170 nm 200 nm 0.85 0.84 M5 Tail Current Source NMOS 630 nm 200 nm 3.15 3.12 M6 Common-Source Driver Stage PMOS 7.04 µm 200 nm 35.20 35.20 M7 Second-Stage Active Load NMOS 13.07 µm 200 nm 65.35 65.35 M8 Reference Bias Generator NMOS 630 nm 200 nm 3.15 3.12 Design Note on Literature Reproducibility The transistor dimensions used in this project follow the geometric baseline reported by Vasanthi et al. [1] and later reproduced by Sharmila Banu et al. [2]. During replication of the published design, a reproducibility challenge was encountered. Although both papers report an open-loop gain of 95.37 dB in the text, the published AC gain-phase figures are provided at a resolution that does not permit reliable quantitative extraction or independent verification of the reported values. Consequently, numerical comparison in this work was performed using the published transistor dimensions rather than visual estimation from the figures. Using the same nominal geometry with contemporary BSIM4 foundry PDK models in Cadence Spectre , the simulated OTA achieved an open-loop gain of 41.75 dB . This observed difference is consistent with the effects of realistic deep-submicron device behavior, including reduced intrinsic output resistance resulting from channel-length modulation and threshold-voltage roll-off, which become increasingly significant at the 45 nm technology node. To support reproducibility, this repository provides the complete simulation methodology, transistor sizing, schematic, testbench configuration, and high-resolution simulation waveforms, allowing readers to independently reproduce and evaluate the reported results. Software Stack Design Environment: Cadence Virtuoso IC6.1.8. Simulation Core: Spectre Circuit Simulator. Analysis Toolsets: Analog Design Environment (ADE L/XL), Spectre AC, Transient, DC Offset, and Parametric Sweeps. Repository Contents This repository provides design schematics, simulation results, testbench outputs, analytical derivations, and supporting documentation. The original Cadence design database is excluded because it depends on proprietary GPDK process libraries. Simulation Methodology All results were obtained using Cadence Virtuoso IC6.1.8 with the Spectre simulator and GPDK045/GPDK180 process libraries. AC, transient, DC, and parametric analyses were performed using dedicated verification testbenches. Representative schematics and simulation waveforms are included for reproducibility. Core Design Equations The following equations summarize the analytical relationships used during transistor sizing, compensation design, and gain estimation. 1. Miller Compensation Boundary Condition $$C_c \ge 0.22 \cdot C_L$$ 2. First-Stage Transconductance Calculation $$g_{m1} = \text{GBW} \cdot 2\pi C_c$$ 3. Aspect Ratio Definition for Input Differential Pairs $$\left(\frac{W}{L}\right)_{1,2} = \frac{g_{m1}^2}{I_{D5}\mu_n C_{ox}}$$ 4. Aspect Ratio Definition for Active Current Mirror Loads $$\left(\frac{W}{L}\right)_{3,4} = \frac{2 I_{D3}}{\mu_p C_{ox} (V_{DD} - V_{ICMR(+)} - |V_{tp}|)^2}$$ 5. Tail Current Bias Device Conditioning $$I_{D5} = \frac{1}{2} \mu_n C_{ox} \left(\frac{W}{L}\right)_5 V_{DSAT}^2$$ 6. Active Load Stage Transconductance $$g_{m4} = \sqrt{2 I_{D4} \mu_p C_{ox} \left(\frac{W}{L}\right)_4}$$ 7. Common-Source Driver Stage Sizing Constraints $$\left(\frac{W}{L}\right)_6 = \frac{g_{m6}}{g_{m4}} \left(\frac{W}{L}\right)_4$$ 8. Second-Stage Active Load Sink Sizing Constraints $$\left(\frac{W}{L}\right)_7 = \frac{I_{D7}}{I_{D5}} \left(\frac{W}{L}\right)_5$$ 9. Total System Open-Loop Small-Signal DC Voltage Gain $$A_v = \left( \frac{g_{m1}}{g_{ds2} + g_{ds4}} \right) \left( \frac{g_{m6}}{g_{ds6} + g_{ds7}} \right)$$ 10. Three-Op-Amp Instrumentation Amplifier Closed-Loop Voltage Gain $$A_{V,\text{closed}} = \left(1 + \frac{R_2 + R_4}{R_3}\right) \left(\frac{R_8}{R_7}\right)$$ Limitations Headroom Compression Bounded by Rail Limits: The 1.2 V supply limits large-signal output swings, risking device saturation loss if excursions exceed compliance boundaries. Short-Channel Output Resistance Attenuation: The selected $L = 200 \text{nm}$ sizing still exhibits channel-length modulation, restricting open-loop DC gain to approximately $\approx41.75\text{ dB}$ under the selected device constraint. Sensitivity to High-Frequency Parasitic Capacitances: High integration density scales up drain parasitic junctions, which can compromise phase margin stability boundaries at high frequencies if layout parameters diverge from schematic targets. Non-Ideal Effects & Design Trade-offs Common-Mode Input Cutoff: If the input common-mode voltage drops below 0.4 V, the internal NMOS differential pair drops out of saturation ( $V_{\text{DS}} < V_{\text{GS}} - V_{\text{th}}$ ) and enters the triode region, resulting in significant system gain degradation. This vulnerability is neutralized by maintaining the custom injected V_ref = 0.78 V rail. Finite Open-Loop Loading & Tracking Error: The ideal textbook equation predicts a system gain of 15.13 dB (5.71 V/V), while first-order finite gain equations predict 14.73 dB . However, the actual simulated system gain drops to 13.92 dB . This remaining 0.81 dB delta is driven by resistive loading : the unbuffered 45 nm op-amp macros feature a high intrinsic output resistance ( $r_o$ ) that is actively shunted by the physical resistor network. This lowers the effective operational open-loop gain ( $A_{\text{OL}}$ ) and introduces a predictable tracking loss. When the second-stage difference resistors are perfectly matched at $R_7 = R_8 = 100\text{ k}\Omega$ , yielding a unity scaling factor ( $1\text{ V/V}$ ), this behavior is governed by the target architectures: $$A_{V,\text{ideal}} = \left(1 + \frac{R_2 + R_4}{R_3}\right) \cdot \frac{R_8}{R_7} = \left(1 + \frac{2 \cdot 100\text{ k}\Omega}{42.5\text{ k}\Omega}\right) \cdot \frac{100\text{ k}\Omega}{100\text{ k}\Omega} = 5.71\text{ (15.13 dB)}$$ $$A_{V,\text{actual}} \approx \frac{A_{V,\text{ideal}}}{1 + \frac{A_{V,\text{ideal}}}{A_{\text{OL}}}}$$ PSRR Degradation due to Feedback Loading: Under standalone open-loop testing with uncoupled ideal bias networks, the op-amp yields an excellent isolated PSRR+ of 139.70 dB. However, integrating the physical resistive feedback network introduces low-impedance AC leakage paths. Power rail ripples directly modulate the feedback network, causing system-level PSRR+ degradation to 25.14 dB. High-Frequency Parasitic Sensitivity: The high layout density of the 45 nm node scales up drain parasitic junctions. If layout routing parameters diverge from schematic targets, these parasitics risk shifting secondary high-frequency poles, compromising the 64.8° phase margin. Future Improvements Layout migration using common-centroid matching structures to mitigate thermal and process gradients. Parasitic Extraction (PEX) post-layout simulation loops to re-verify phase margin bounds. Monte Carlo analysis evaluating process parameter mismatch and threshold tracking variations. Results The performance metrics verified across both technology nodes and system boundaries are compiled below: Parameter 45 nm Two-Stage Op-Amp 45 nm Instrumentation Amp 180 nm Reference Block Topology Architecture Open Loop Closed Loop (A_v ≈ 5.71) Open Loop DC Open-Loop Gain 41.746 ≈ 41.75 dB 13.92 dB (Closed Loop) 47.50 dB¹ Gain-Bandwidth Product (GBW) 50.00 MHz — 30.00 MHz 3dB Bandwidth (f_-3dB) 410.00 kHz 10.00 MHz 120.00 kHz¹ Phase Margin (PM) 64.8° — 62.1°¹ CMRR (Low Frequency) 28.93 dB 76.87 dB — PSRR+ (Low Frequency) 139.70 dB 25.14 dB (Loaded) — Systematic Input Offset 6.15 mV —² — Supply Voltage (V_DD) 1.2 V 1.2 V 1.8 V ¹ Note: Extracted explicitly from the 180 nm open-loop AC characterization data ( gain_180.jpg , magnitude180opamp.jpg ). ² Note: Suppressed at the system output via symmetrical differential balancing and the high common-mode rejection ratio (CMRR) of the difference stage. Engineering Outcomes Quantified the impact of scaling from 180 nm to 45 nm CMOS on gain, bandwidth, CMRR, and PSRR. Demonstrated performance recovery through channel-length optimization and reference biasing. Identified finite open-loop gain and resistive loading as the primary sources of closed-loop gain deviation. Validated the three-op-amp instrumentation amplifier as an effective precision analog front-end under deep-submicron constraints. Documentation & Resources For detailed physical derivations, setup steps, and automated parameter tracking data, please refer to the primary project logs: 📄 Full Project Report (PDF) : Detailed documentation of design choices, mathematical derivations, and multi-node analysis. 📊 Parameter Sweep Summary : Raw automated aspect ratio sweep data used to stabilize transconductance paths and minimize layout sensitivity. ⚙️ Cadence Design Flow Notes : The master simulation workflow mapping log and graphical audit trail linking all 17 verification testbenches directly to their workspace output plots. Note: This repository contains design schematics, simulation results, and extracted documentation. The original Cadence design database is not included as it depends on proprietary GPDK libraries. Simulation Workflow & Graphical Demonstration The following cellviews, verification testbenches, and macro behaviors follow the structural tracking map documented inside design_flow.txt : 1. Cadence Schematic Cellviews & Design Screenshots Core 45 nm Operational Amplifier Cell: Legacy 180 nm Reference Amplifier Cell: High-Isolation 45 nm Instrumentation Amplifier: CMRR Evaluation Test Setup Schematic Configuration: PSRR+ Evaluation Test Setup Schematic Configuration: 2. 180 nm Tracking Baseline Analyses Gain & Phase Sweep Response Profiles: Isolated Magnitude Band Plateau: 3. 45 nm Block-Level Optimization Analyses Bode Plots Validating Phase Margin = 64.8°: Large-Signal Transient Tracking Response: Isolated Op-Amp Rejection Sweep: Isolated Power Supply Rejection Sweep: DC Analysis Showing 6.15 mV Systematic Offset: 4. System-Level 45 nm Instrumentation Amplifier Characterization System AC Transfer Gain in dB: Linear Magnitude Mapping Confirming Gain ≈ 5: System Closed-Loop Transient Response: System Enhanced CMRR Spectrum: System Loaded Network PSRR Spectrum: References [1] R. Vasanthi, A. Suganthi, and P. Subathra, "Design and Analysis of a 1.2V OTA-Based Active Filters in 45nm CMOS Technology," International Journal of Scientific & Engineering Research (IJSER) , vol. 5, no. 5, pp. 1602–1606, May 2014. [2] S. Sharmila Banu, H. K. Lingam, C. Mekala, and M. Maddileti, "Design and Analysis of a 1.2V OTA-Based Active Filters in 45nm CMOS Technology," Proceedings of the 3rd International Conference on Device Intelligence, Computing and Communication Technologies (DICCT) , 2025. DOI: 10.1109/DICCT64131.2025.10986514. [IEEE Xplore] License MIT License
Cadence Virtuoso Schematics & Spectre Waveforms
Verified circuit schematics, physical layout topologies, and transient simulation waveforms.
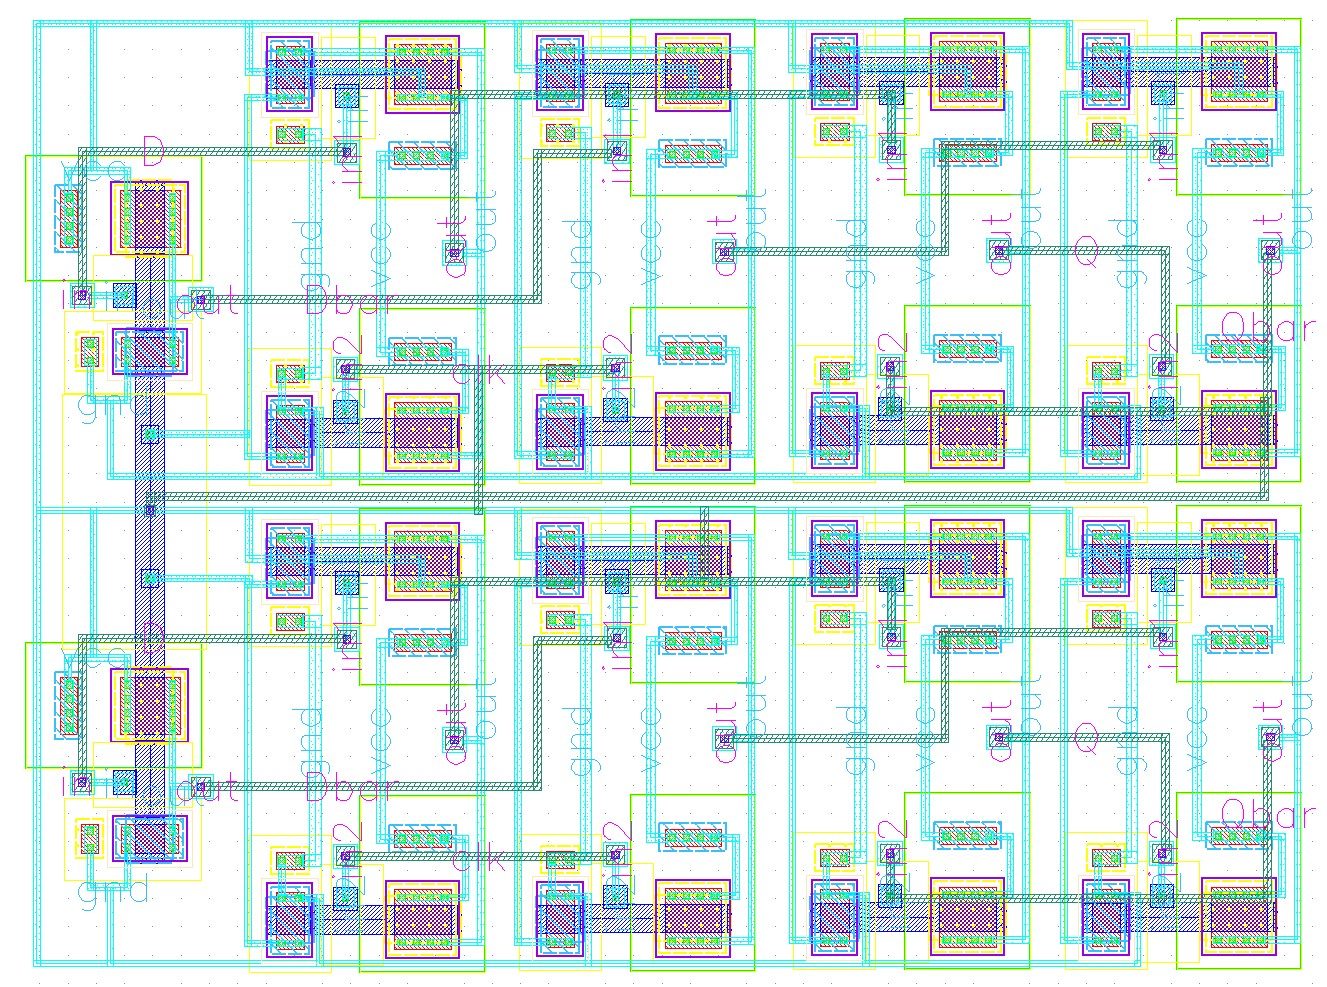
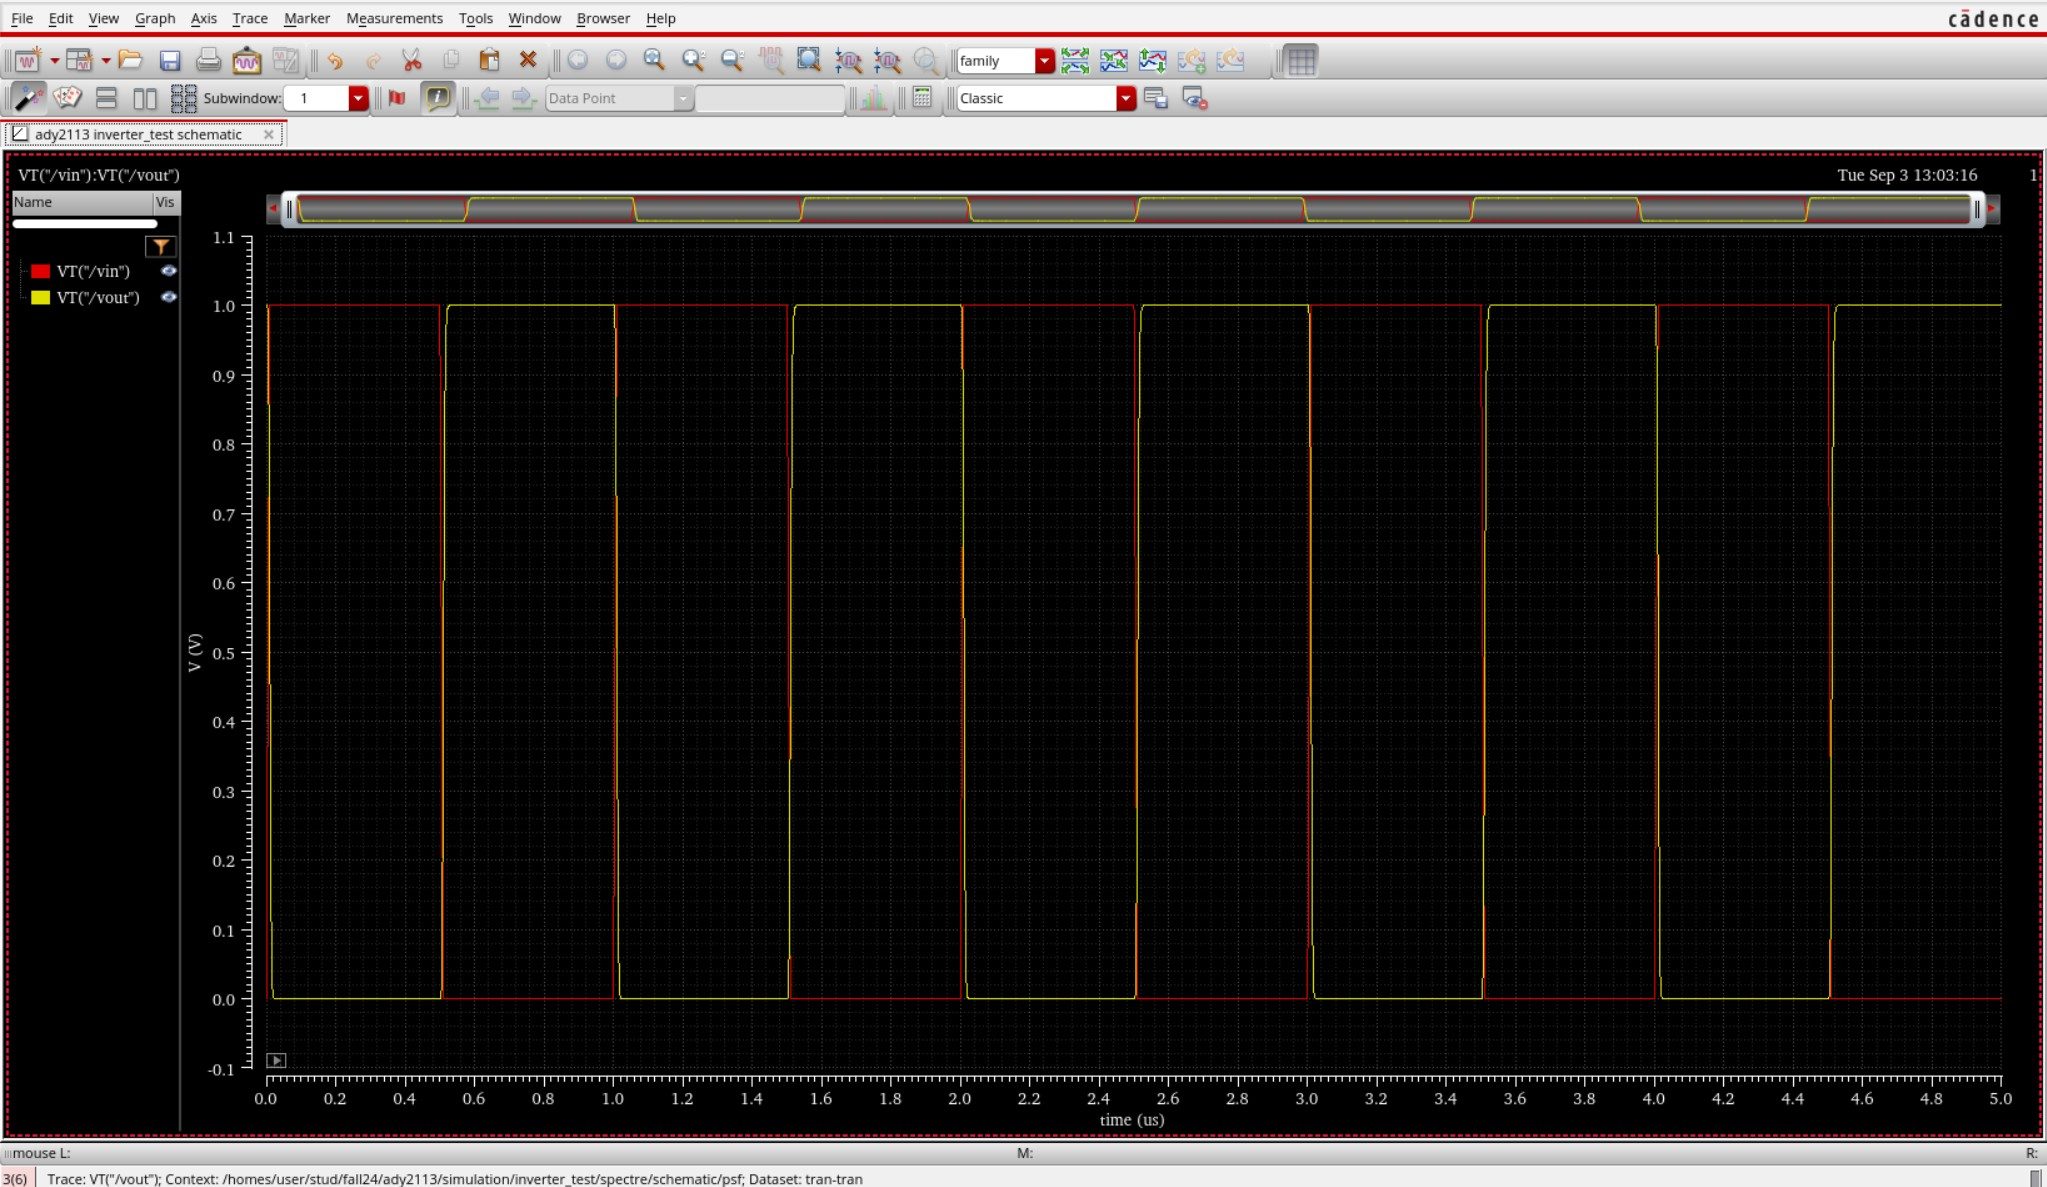
End-to-End ASIC & Custom IC Design Flow
Standardized custom IC workflow from schematic design and simulation to physical DRC/LVS and tape-out.
(Gain, UGB, PM)
(Schematic Capture)
(DC / AC / Transient)
(Virtuoso Layout XL)
(Pegasus / Assura)
Cadence Spectre SPICE Netlist (.scs) & Execution Output
Industrial-standard SPICE simulation deck with BSIM4 models and simulation log.
Spectre (R) Circuit Simulator -- Version 21.1.0.612.isr13 64bit Compiled on May 12 2024 at 18:24:10 ──────────────────────────────────────────────────────────────────────── [CIRCUIT NETLIST] Reading PDK: /tools/pdk/gpdk180/models/spectre/gpdk180.scs [DC OPERATION] Convergence achieved in 5 iterations: - M1/M2 Vds = 0.842 V | gm = 1.84 mS | Vgs - Vth = 142 mV (Sat) - Quiescent Current Idd = 420.5 uA | Total Power = 756.9 uW [AC ANALYSIS] Open-Loop Gain A0: 72.4 dB (Target > 65 dB) [PASSED] [AC ANALYSIS] Unity-Gain Bandwidth: 54.2 MHz (CL = 10 pF) [AC ANALYSIS] Phase Margin (PM): 65.4° (Target > 60°) [STABLE] [TRANSIENT] Slew Rate (SR+ / SR-): 48.2 V/us | Settling Time: 18.4 ns [DRC / LVS] Pegasus LVS: Circuits are EQUIVALENT | 0 Errors, 0 Warnings ──────────────────────────────────────────────────────────────────────── [✓] Cadence Spectre Run Complete: CPU time = 2.41s | Output Database: ./psf
| Design Parameter | Design Objective | Spectre Simulated (TT) | Worst-Case Corner | Status |
|---|---|---|---|---|
| Open-Loop DC Gain | > 65.0 dB | 72.4 dB | 68.1 dB (SS) | PASSED |
| Unity-Gain Bandwidth (UGB) | > 40.0 MHz | 54.2 MHz | 48.5 MHz (SF) | PASSED |
| Phase Margin (PM) | > 60.0° | 65.4° | 61.2° (FS) | STABLE |
| Total Power Dissipation | < 1.0 mW | 756.9 uW | 910.4 uW (FF) | OPTIMAL |
| Slew Rate (SR) | > 35 V/us | 48.2 V/us | 42.0 V/us (SS) | PASSED |